Testing Business Processes
- Home
- Neuron ESB
- Development
- Developing Neuron Applications
- Developing Business Processes
- Testing Business Processes
Design-time Testing
Test Message
Neuron ESB provides the ability to test a Business Process within the Business Process Designer. The Testing process is started by clicking the Test Toolbar button located on the Process Designer Toolbar. This will launch the Edit Test Message form, Figure 59.
The Edit Test Message dialog box allows users to enter any type of message (i.e. XML, JSON, Text, binary, etc.) to send to the Business Process for testing. Existing ESB Message context properties can be modified, custom ESB Message properties can be added and Environment Variables specific to Deployment Group can be selected to use during the test. This should be used to enter all the information required by the Business Process to test.
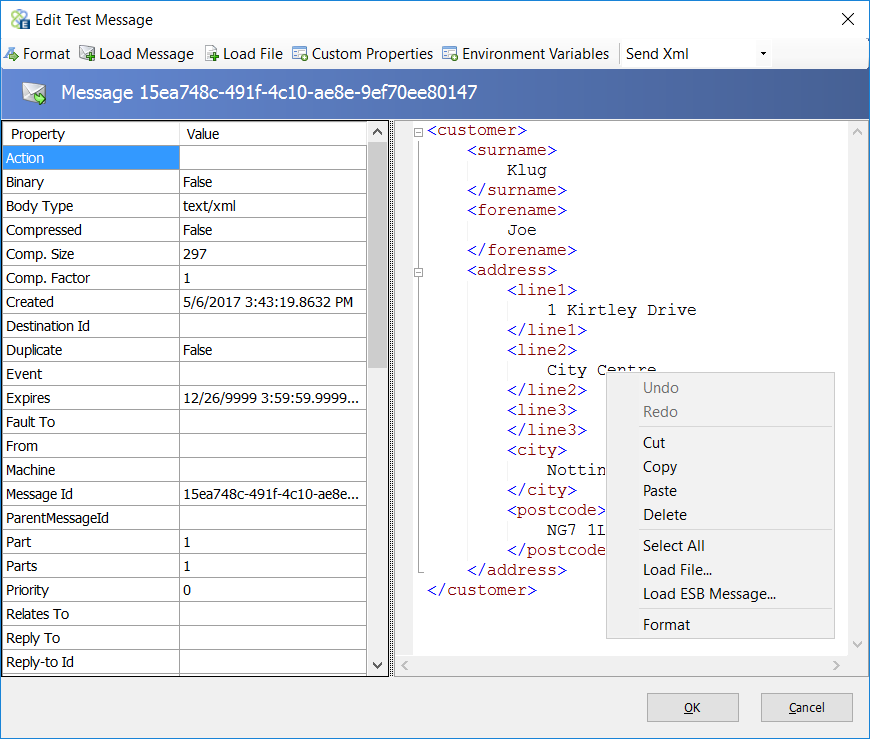
The Edit Test Message developers provides the following features
| Feature | Description |
| Format | Formats the XML data displayed in the Edit Test Message dialog. |
| Load File | Clicking the Load File Toolbar button will prompt the user to select an external file to load as binary. |
| Load Message | Clicking the Load Message Toolbar button will prompt the user to select a previously saved ESB Message in the format of *.esbmsg. An ESB Message can be saved in the *.esbmsg format from the Failed Messages or the Message History report. This load the ESB Message properties as well as the data payload for the test. |
| Custom Properties | Clicking the Custom Properties Toolbar button will launch a dialog box allowing the user to add custom message properties. These will be added as part of ESB Message sent to the Business Process for the test. This means that any Process Step configured to use custom ESB Message properties, will work as expected during the test. |
| Environment Variables | Clicking the Environment Variables Toolbar button will launch a dialog box allowing the user select (and edit), the set of Environment Variables associated with a specific Deployment Group. This means that any Process Step configured to use Environment Variables, will work as expected during the test against the selected Deployment Groups Environment Variables. |
| Modify ESB Message Header | All ESB Message Header properties are displayed in the left hand pane of the Edit Test Message dialog. These can be edited before the message is submitted for testing. All properties except those beginning with HTTP. Can be edited and used during the test. |
Pressing the OK button on the Edit Test Message form will start the testing process, sending all the data entered into the Business Process for execution and closing the form. During testing, the execution of each Process Step in the Business Process is visible and highlighted within a green frame (Figure 60). Process Steps will output trace information (i.e. Verbose/Debug, Informational, Warnings or Errors) to the Trace Window (Figure 61) during execution.
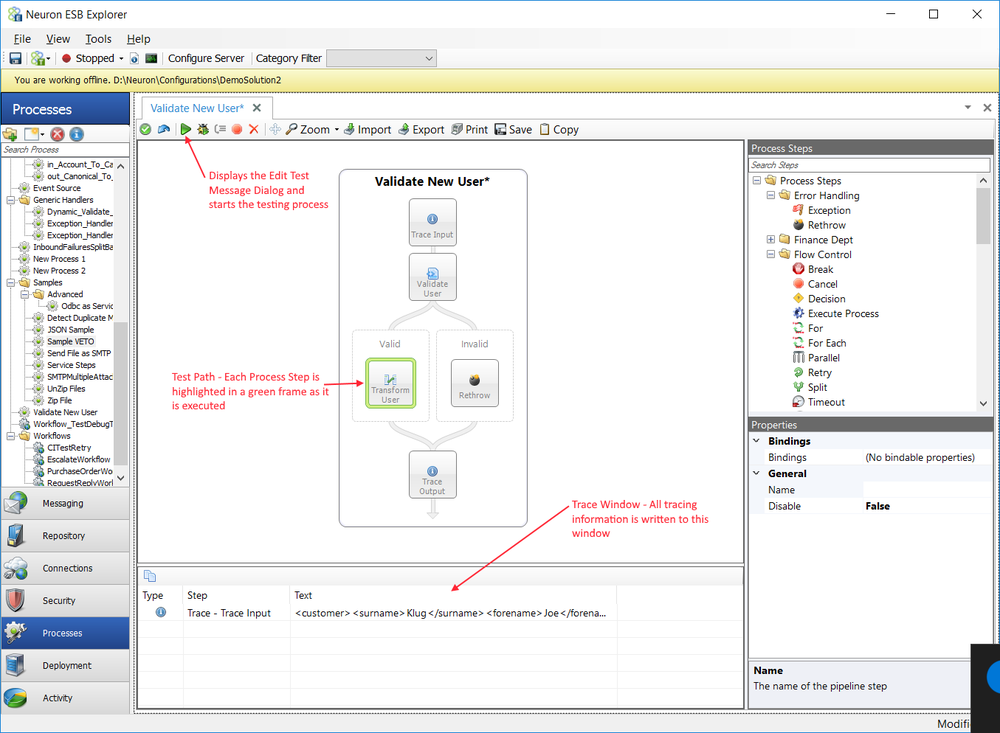
Once the testing process has started, it can be aborted by clicking the Stop Toolbar button. This will abort the test process. Developers cannot stop on a specific Process Step, inspect the context and then restart on the next. The .Net Debugging process provides that functionality.
A developer can use a Code Process Step to load custom information that the Edit Test Message does not support. For example, if the HTTP Method needed to be set for design time testing, this could be done in a C# Process Step using the following sample below:
if (context.Runtime.DesignMode)
context.Data.Http.Method = "GET";
In the sample above, the DesignMode returns True if the Business Process is being tested in the Business Process Designer. This ensure the code block setting the Method is not executed during normal runtime.
Trace Window
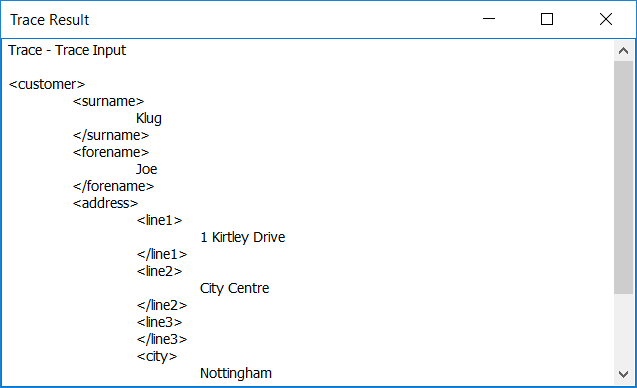
The Trace Window is always visible at the bottom of the Business Process Designer and can be resized (Figure 61). This will display all trace output generated by either the Trace Process Step, or by using Trace* methods from the IPipelineInstance interface exposed on the pipeline context object (i.e. context.Instance.Trace*). Additionally, all exception and abort information as well as any debug or informational messages generated by either the Business Process, its Process Steps, or the Rethrow process step will be displayed in this window. The Trace Window is only written to during test execution of the process. The contents of the Trace Window can be copied to the Windows clipboard by clicking the copy icon located directly above the Type column of the data grid or, it can be displayed in the Trace Result Windows by selecting the Display context menu (Figure 62).

Tracing APIs
The Business Process Tracing APIs can be used during development to add custom trace information to Business Processes. These APIs will write to the Trace Window during testing. However, they will write to the appropriate Neuron ESB Log files at runtime. For example, if a Business Process ran during the receipt of a message from a Client Connector at runtime, the Trace APIs would write the trace output directly the Client Connectors respective log file.
The Trace APIs are defined on the IPipelineInstance interface exposed on the pipeline context object as shown below:
public interface IPipelineInstance
{
	void TraceError(string message);
	void TraceInformation(string message);
	void TraceWarning(string message);
	/// <summary>
	/// Boolean flag indicating whether Verbose level logging is enabled
	/// </summary>
	bool IsDebugEnabled { get; }
	/// <summary>
	/// Boolean flag indicating whether error level logging is enabled
	/// </summary>
	bool IsErrorEnabled { get;}
	/// <summary>
	/// Boolean flag indicating whether warning level logging is enabled
	/// </summary>
	bool IsWarningEnabled { get; }
	/// <summary>
	/// Boolean flag indicating whether info level logging is enabled
	/// </summary>
	bool IsInfoEnabled { get; }
}
Trace APIs can be used directly within any .NET Language Code Editor enabled Process Steps. Their output is controlled by current Trace Level set. The sample below demonstrates using the APIs in a C# Process Step:
if(context.Instance.IsDebugEnabled)
	context.Instance.TraceInformation(
		"only run this statement if 'Verbose' logging is enabled");
if(context.Instance.IsInfoEnabled)
	context.Instance.TraceInformation(
		"only run this statement if 'Info' logging is enabled");
if(context.Instance.IsWarningEnabled)
	context.Instance.TraceWarning(
		"only run this statement if 'Warning' logging is enabled");
if(context.Instance.IsErrorEnabled)
	context.Instance.TraceError(
		"only run this statement if 'Errors' logging is enabled");
Since the pipeline context as well as the current ESB Message is accessible, any header property, custom property or body of the ESB Message can be accessed either at run time or during design time testing by using the Trace APIs in any .NET Language Code Editor enabled Process Step.
The tracing level used during testing is located in the NeuronExplorer.exe.config file. The tracing level can be edited directly in the System.Diagnostics\switches section in the NeuronExplorer.exe.config file as shown below. The default Tracing level is Info.
<configuration>
<system.diagnostics>
<switches>
<!-- This switch controls ESB trace messages. -->
<!-- Value Meaning -->
<!-- ===== ======= -->
<!-- 0 No tracing -->
<!-- 1 Trace errors -->
<!-- 2 Trace errors + warnings -->
<!-- 3 Trace errors + warnings + info -->
<!-- 4 Trace errors + warnings + info + verbose -->
<add name="esbTraceSwitch" value="3"/>
</switches>
</system.diagnostics>
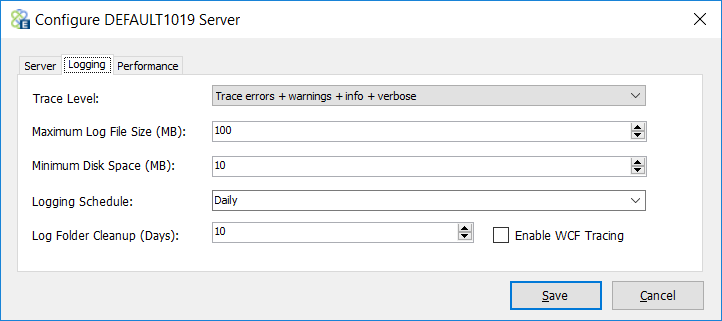
At runtime, the trace level settings will be located within the esbservice.exe.config and the esbhost.exe.config files. Either those trace levels are modified by using the Configure Server dialog launched from the Server management screen or Toolbar of the Neuron ESB Explorer as displayed in Figure 63.
Testing live Process Steps
There are two Process Steps that require that the Neuron ESB solution which contains the Business Process be actively running on the local machine. That is because they need to be able to communicate with internal Neuron ESB services to function. The Neuron ESB Explorer can be opened in offline mode for this to work. These Process steps are:
- Audit
- Publish
When submitting a message to test, a valid SourceId (i.e. the name of a Party) and Topic must be provided in the Edit Test Message dialog (Figure 64). These are used to create a connection to the live Neuron ESB runtime service hosting the solution:

.NET Debugging
The .NET Debugging process is initiated almost exactly like the Testing Process, except that the Debug Toolbar button is pressed rather than the Test Toolbar button. Both will launch the Edit Test Message dialog. Everything that can be done during the Test Process (using Trace APIs, etc.), can be done during the debugging process. What the .NET Debugging process provides over the regular Testing process is the ability to set Breakpoints on Process Steps or within Code Process Steps. It provides a Watch Window and allows developers to view context and values during the debugging process.
Breakpoints

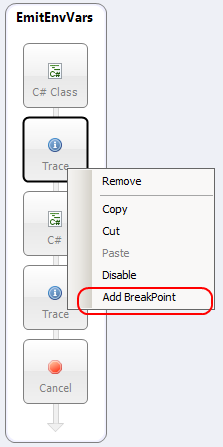
Breakpoints can be set on Process Steps as well as within any code editor belonging to a C#, C# Class and VB.NET Process Step. Within a Business Process, Breakpoints can be set on any Process Step by selecting
Add BreakPoint from the context menu. Once a breakpoint is added, the Process Step will change to a reddish brown color. To retain all Breakpoints between opening and closing of the Business Process, the Process must be saved.
Breakpoints are set within a VB.NET, C# or C# Class Code Editor by clicking to the left of the line of code that the debugger should stop on. A red dot will appear to the left of the line of code (Breakpoint Indicator Margin) and the line of code will be highlighted in red.
To clear all breakpoints that may exist within a C# Process Steps or on any Process Steps, click the Clear All Breakpoints Toolbar button on the Business Process Toolbar
Step by Step Debugging
Once a Breakpoint is set and the debugging process has started (by clicking the Debug Toolbar button), the green frame will move to the first Process Step that have a Breakpoint. Users can continue to the next Breakpoint by clicking the Step Over Toolbar button. Once the green frame moves to a Code Process Step (whether or not it has a Process Step level Breakpoint set on it) that has Breakpoints set within its Code Editor, the debugger will automatically open the Code Editor and stop on the line of code that has the Breakpoint. The line stopped on will be highlighted in yellow and the debugging buttons on the toolbar of the Code Editor will appear (Figure 65).
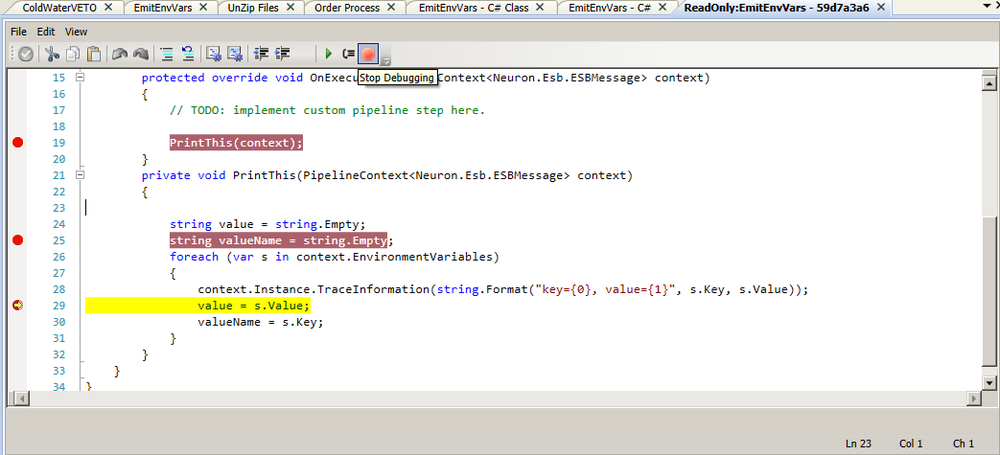
Once on a Breakpoint, a developer can press F5 (continue), F10 (step over) or F11 (step into) keys to walk through each line of code in the Code Editor. The Continue and Step Over Toolbar buttons on the Code Editor Toolbar can be used in lieu of pressing F5 or F10. The debugger can also be stopped by clicking the Stop toolbar button (F1 key). When a developer is positioned on the last line and F5 (or the continue toolbar button) is pressed, the debugger will move to the next Process Step that has a Breakpoint set on it.
Exception Reporting
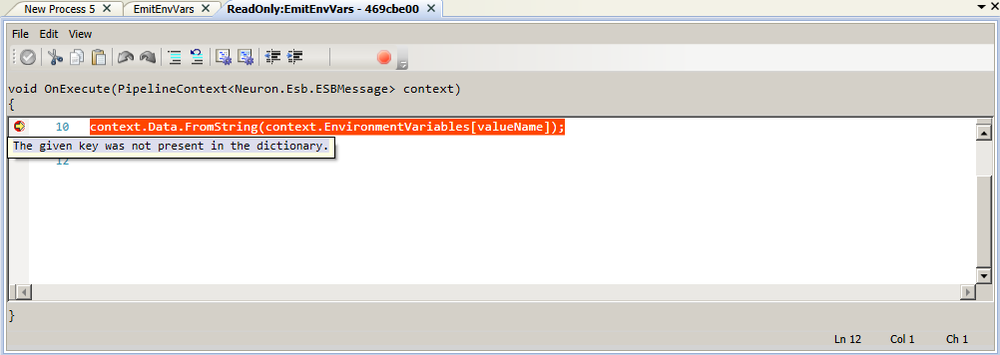
If an unhandled exception occurs, the line will immediately be highlighted in orange. By moving the mouse cursor over the Breakpoint Indicator Margin to the left of the line of code, a tooltip will appear with the error message. If an unhandled exception occurs on a Process Step, the debugger will stop on that Step and highlight it in red (Figure 66). The exception information will be written to the Trace Window.

Quick Watch Window
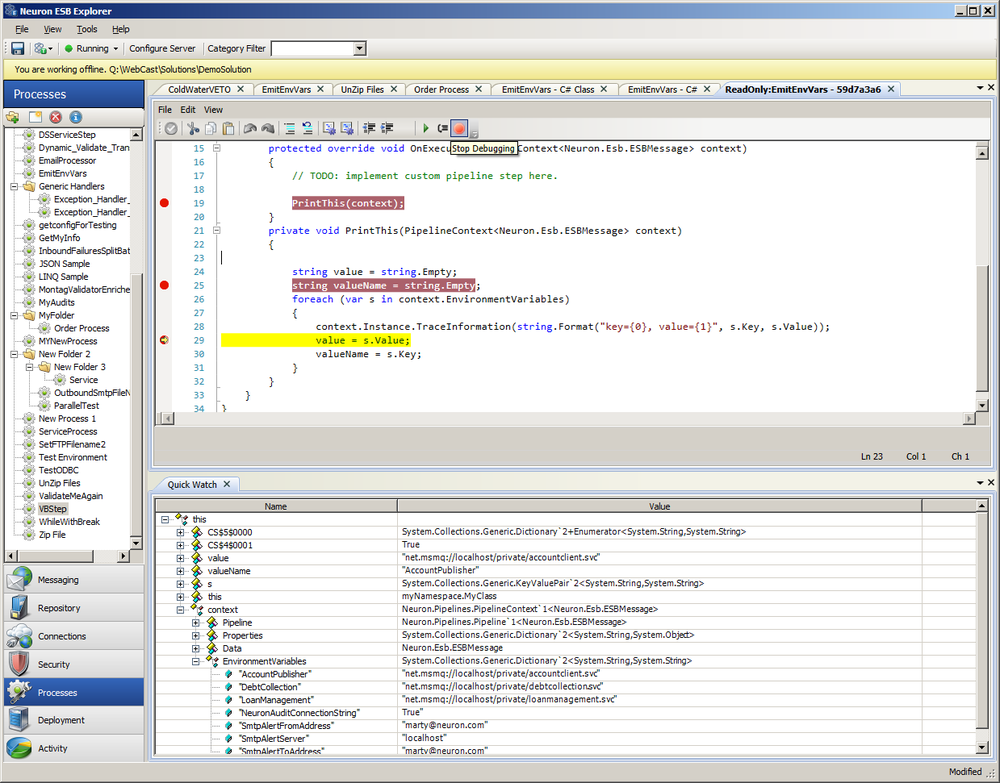
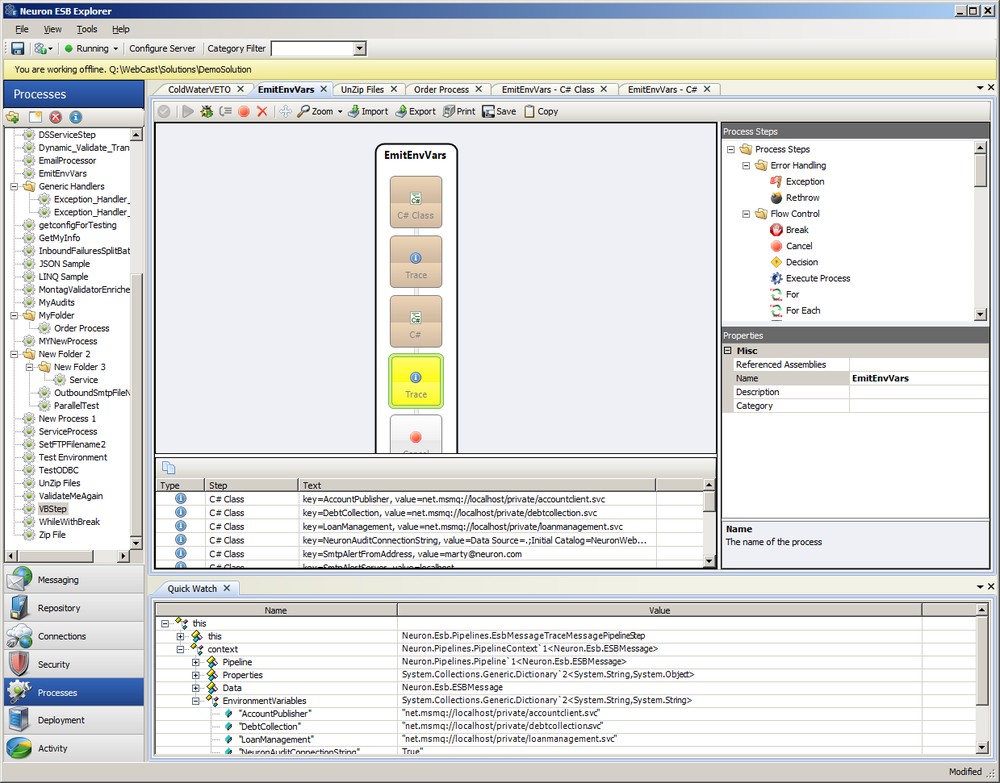
The .NET Debugging Quick Watch window (Figure 67 and Figure 68) provides the ability for developers to view local variable information (much like Microsoft Visual Studio Auto window). If the .NET debugging process is stopped on a Breakpoint, the state of the ESB Message and its header properties, custom variables, Environment Variables and various context properties like context.Properties, context.State, etc. can be examined. The Quick Watch Window is read-only and becomes visible when the debugger stops on the first Breakpoint. When viewing the data payload, nothing larger than 99 characters will be viewable.
Unit Testing
Testing custom process steps is relatively straight-forward. For this section on testing custom process steps, the NUnit Framework will be utilized. NUnit is easily integrated into Visual Studio using the Nuget.org package manager and is a popular testing framework for .NET C#.
Setting up Visual Studio
The most convenient place to put the Visual Studio test project is in the custom process step’s solution.
Creating a new VS Project
- Create a new C# class library project from Visual Studio’s File menu by clicking on File -> New -> Project.
- Choose “Visual C#” from the left-hand menu, then choose the “Class Library” template. Enter any information that is desired into the project’s properties on the bottom of the new project screen. Click “Ok”.
- Make sure the project’s target framework is set to the same as the process step being tested (found in the project’s properties).
Reference Required DLLs
- Required references, such as the custom process’s dll, must be added to the project that was created. In the Solution Explorer pane, add a reference in the project to the desired custom process step dll to be tested.
- Install the NUnit Framework, NUnit Console Runner, and the Visual Studio Test Adapter to the project through the Nuget Package Manager by searching for “NUnit”, “NUnit.console” and ” NUnit 3 Test Adapter for Visual studio” or run the following from the Nuget Package Manager Console:
- Install-Package NUnit
- Install-Package NUnit.ConsoleRunner -Version 3.6.1
- Install-Package NUnit3TestAdapter -Version 3.7.0
- There are two ways to add the required Neuron ESB dlls to the project:
- Option 1: Users can download and install the Neuron ESB API from nuget.org by using the Nuget Package Manager in Visual Studio and searching for “Neuron ESB SDK”, or by running “Install-Package NeuronEsb.ClientApi” from the Nuget Package Manager Console
- Option 2: If Neuron ESB is installed on the system, users can reference the following DLLs from the installed instance’s folder (usually at “C:\Program Files\Neudesic\ Neuron ESB v3\DEFAULT”):
- Neuron.dll
- Neuron.Esb.dll
- Neuron.Esb.OAuth.dll
- Neuron.Pipelines.dll
- Neuron.Scripting.dll
- Newtonsoft.Json.dll
- RabbitMQ.Client.dll
Option 2 is recommended since that will ensure that the API version will match the version of Neuron ESB being tested against.
- Most likely, the only namespaces that will be used (i.e. “using”
statements to add) to test are:
- Neuron.Esb.Administration
- Neuron.Esb
- Neuron.Esb.Pipelines
- Neuron.Pipelines
- NUnit.Framework
Writing the Unit Test
The first step is to decorate the test class with the [TestFixture] attribute.
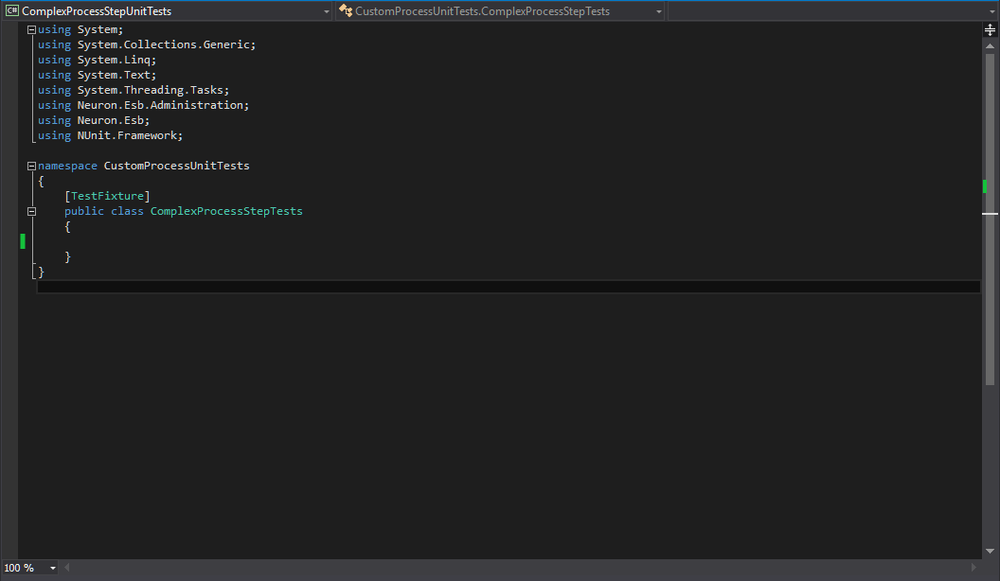
Next, create a method for each test case that needs to be validated against. Decorate each method with the [Test] attribute.

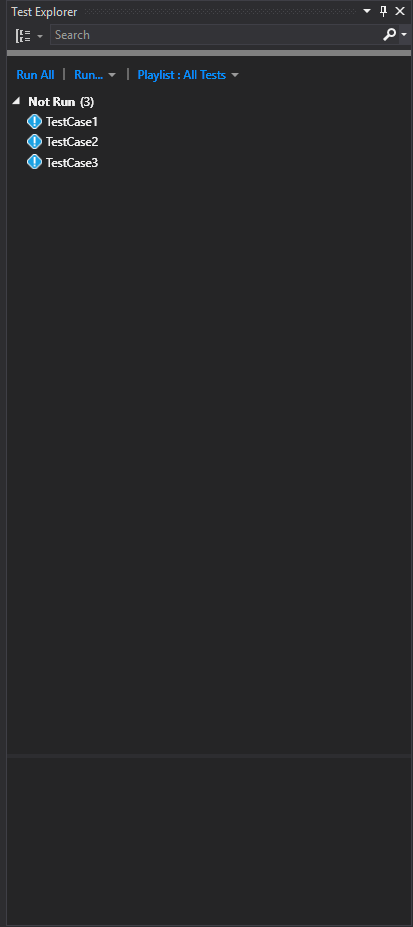
At this point, the solution can be built and the individual tests should appear in the “Test Explorer” window (accessed through Test -> Windows -> Test Explorer) if everything was installed correctly.
To execute a custom process step, the following objects are needed:
- PipelineContext<ESBMessage> contains the needed information for a pipeline (another name for a business process) to run.
- Pipeline<ESBMessage> – this is the object that contains the process step that will be tested. Multiple process steps can be added to this object.
- PipelineRuntime this will be the runtime for the pipeline from which the pipeline instance object will be created. The PipelineRuntime.DesignMode property should be set to “true” for unit testing.
- PipelineInstance<ESBMessage> – this will be an instance of the Pipeline. This is created through the PipelineRuntime.CreateInstance<ESBMessage>() method.
- ESBMessage this is the ESBMessage object that will be used to test the custom process step.
- ESBConfiguration this is needed if the custom process step needs something from a Neuron ESB Configuration, such as credentials, environment variables, etc.
- The Custom Process Step to be tested in this document, the “Complex Custom Process Step” sample from the Neuron Samples is being tested. This can be found in Neuron Explorer under View -> Samples The project from the VS solution can be copied, and then added to the unit test solution.
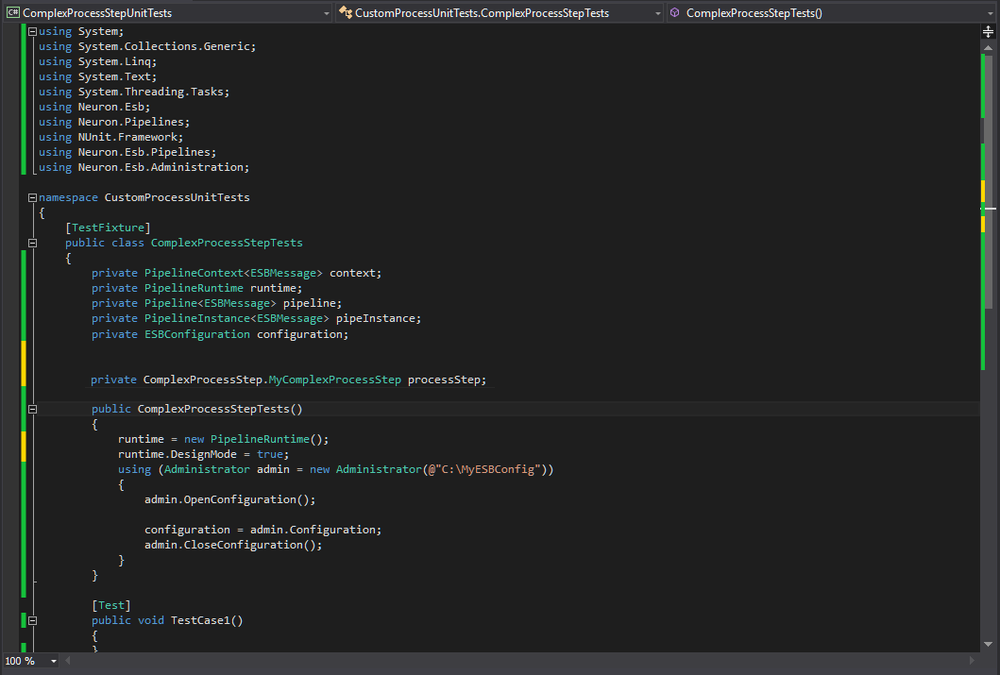
Since the same PipelineRuntime object and ESBConfiguration will be used for all the tests, they can be instantiated in the constructor. The test class should look something like the following:
Now to create the de-constructor, test setup and teardown, and test case logic. Consider the following code screenshot:
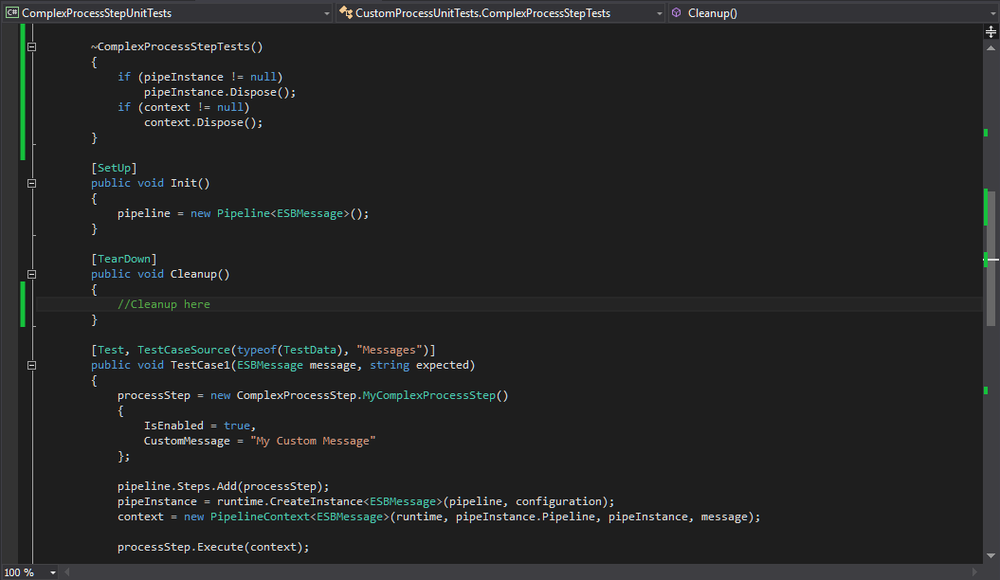
First, a method decorated with the [SetUp] attribute should be created. Since a new Pipeline<ESBMessage> object should be used for each test, the pipeline object should be “reset” here. The method with the [SetUp] attribute will be invoked before each test method is run. Similarly, there should be a method decorated with the [TearDown] attribute to clean up after each test is run. In the de-constructor, the pipeInstance and context objects are disposed, if not null. Notice that the attribute [TestCaseSource(typeof(TestData), “Messages”)] has been added to the test method’s attributes. This allows NUnit to run the test method with different parameters. The TestData class contains an object array called “Messages”. For testing custom processes, different ESBMessage objects can be passed in along with the expected result. Here, since ESBMessage.Text is being tested against, the expected result will be a string.

The TestData class referenced in the [TestCaseSource] attribute
The process step to be tested should be instantiated in the test method because different process configurations (i.e. different custom process step property values) would probably be used for each test case. The process step object should be added to the pipeline object’s “Steps” collection. Using the pipeline runtime object, a pipeline and configuration can be passed into the runtime’s “CreateInstance” method to create a pipeline instance object.
Now, the pipeline context object can be created by passing in the runtime, pipeline, pipeline instance, and ESBMessage objects to the PipelineContext<ESBMessage> constructor. From there, the process step can be executed on the context by calling the process steps “Execute” method with the context object as the parameter.
Using NUnit Framework’s “Assert” class, the processed context.Data.Text (context.Data is the resulting ESBMessage) can be tested against the expected value. Of course, this example is a simple test, but the tests that can be created using the Neuron ESB Business API and NUnit are only limited to the capability of the two.
Neuron ESB Process Steps
Testing the built-in process steps provided with Neuron ESB is accomplished the same way as testing a custom process step. However, some of the provided steps need a configuration selector delegate. This can be determined by checking if the DesignModeEsbConfigSelector property exists in the process step’s class. For example, the Audit process step uses the DesignModeEsbConfigSelector. To initialize it, the following code could be used:
EsbMessageAuditPipelineStep.DesignModeEsbConfigSelector = new EsbConfigSelectorDelegate(() => { return configuration; });
The “configuration” being returned by the delegate above is an ESBConfiguration object. A given Neuron ESB configuration can obtained by implementing the following code:
using (Administrator admin = new Administrator(@"C:\MyESBConfig"))
{
admin.OpenConfiguration();
configuration = admin.Configuration;
admin.CloseConfiguration();
}
Entire Business Process
Mostly, the construction of a test for an entire business process is the same as a process step. However, there are some differences. Consider the following code screenshot:
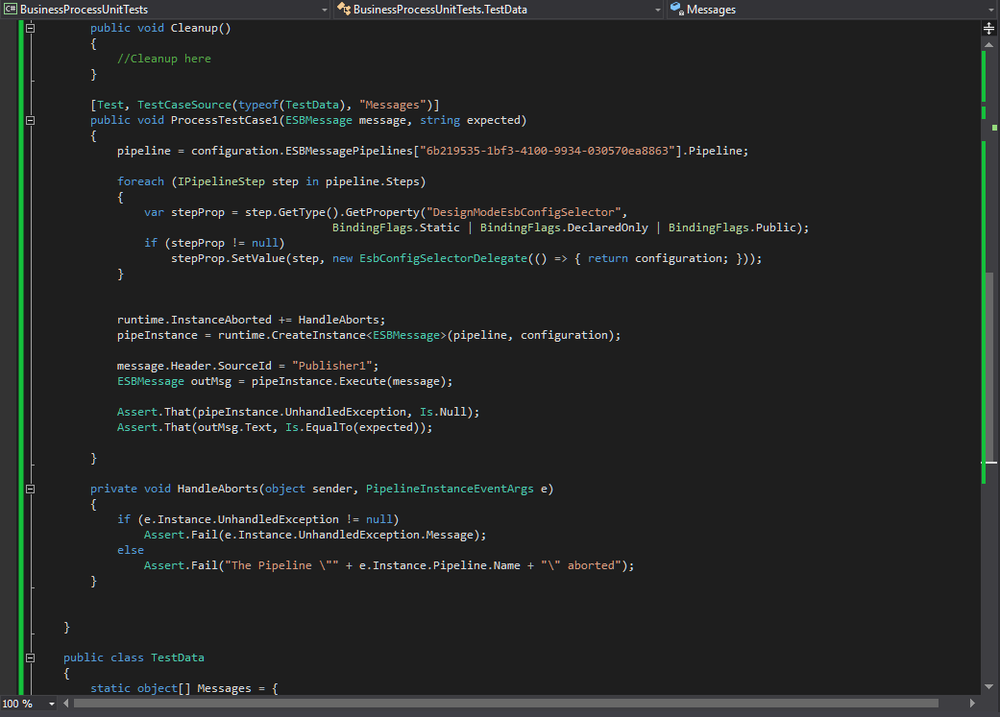
Notice that the pipeline object is being set by retrieving the pipeline definition from the configuration and getting its Pipeline property. In order to accomplish that, the GUID from the “Id” element in the process’s definition xml file is needed. The process definition xml file is located in the Neuron configuration folder’s “Processes” sub directory (e.g. “C:\MyESBConfig\Processes”).
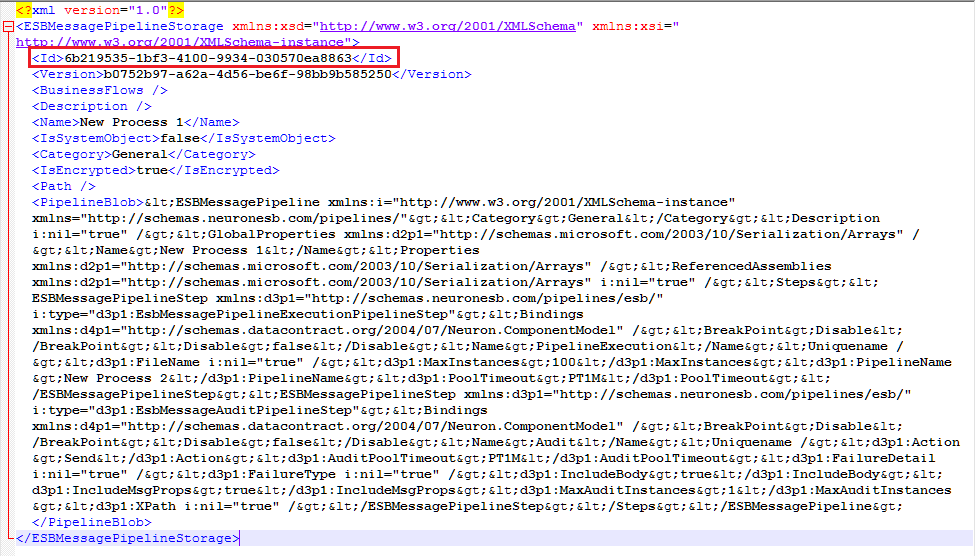
XML file for a process named “New Process 1”
Next, the “foreach” loop initializes the “DesignModeEsbConfigSelector” on any step in the process that uses it. Using reflection, the presence of the “DesignModeEsbConfigSelector” can be detected. Also note that the System.Reflection namespace has been added to the using statements. In order to handle if a pipeline aborts, a handler method should be added to the PipelineRuntime.InstanceAborted event handler. In addition, the ESBMessage’s SourceId header property should be set to a valid Party from the configuration selected. This is for any “Audit” steps in the pipeline as a valid SourceId and Topic are needed (Topic is set in the TestData class’s Messages object when instantiating the test ESBMessages). Furthermore, the Audit step requires that the ESB Service be running since it uses the Audit Service.
One more step is required for the Audit step to execute properly when testing. The ESBService.exe and ESBService.exe.config files must be copied to the directory where the tests will be run from (e.g. “<VS Project Path>\bin\Debug”). Now notice that instead of calling the pipeline step’s “Execute” method, the pipeline instance’s “Execute” method is called. This method returns the resulting ESBMessage. The PipelineInstance.UnhandledException should be checked for any non-null value as that means an exception occurred during the execution of the pipeline.
Running the Unit Tests
The unit tests can be run in Visual Studio in the Test Explorer window. This is convenient when developing/modifying the custom process step. The “NUnit 3 Test Adapter for Visual Studio” package installed earlier is what allows this capability. The tests can also be configured to run when the custom process step’s project is built in Visual Studio. To do this, set the unit test project’s build dependencies to depend on the custom process step project. This will make sure the custom process step is built before the unit test. Then add the following line to the post-build event (after modifying it to fit the test machine):
“<Path to VS Project>\packages Unit.ConsoleRunner.3.6.1\tools\nunit3-console.exe” “<Path to Unit Test dll>”
Using the preceding method of running the tests, in the Error List window of Visual Studio, if there are any failed tests, an error will be displayed with a POSITIVE exit code from NUnit. The positive number is the number of failed tests. The test summary can be viewed in the Output window of Visual Studio. When no tests fail, a test summary similar to the following will be displayed in the Output window:

For build server integration, please see the target build server’s documentation. For example, the TeamCity build server from JetBrains is supported natively by NUnit and instructions can be found at: https://confluence.jetbrains.com/display/TCD10/NUnit+for+MSBuild
Source Code
Process Step Unit Test
using System;
using System.Collections.Generic;
using System.Linq;
using System.Text;
using System.Threading.Tasks;
using Neuron.Esb;
using Neuron.Pipelines;
using NUnit.Framework;
using Neuron.Esb.Pipelines;
using Neuron.Esb.Administration;
namespace CustomProcessUnitTests
{
	[TestFixture]
	public class ComplexProcessStepTests
	{
		private PipelineContext<ESBMessage> context;
		private PipelineRuntime runtime;
		private Pipeline<ESBMessage> pipeline;
		private PipelineInstance<ESBMessage> pipeInstance;
		private ESBConfiguration configuration;
		private ComplexProcessStep.MyComplexProcessStep processStep;
		public ComplexProcessStepTests()
		{
			runtime = new PipelineRuntime();
			runtime.DesignMode = true;
			using (Administrator admin = new Administrator(@"C:\MyESBConfig"))
			{
				admin.OpenConfiguration();
				configuration = admin.Configuration;
				admin.CloseConfiguration();
			}
		}
		~ComplexProcessStepTests()
		{
			if (pipeInstance != null)
				pipeInstance.Dispose();
			if (context != null)
				context.Dispose();
		}
		[SetUp]
		public void Init()
		{
			pipeline = new Pipeline<ESBMessage>();
		}
		[TearDown]
		public void Cleanup()
		{
			//Cleanup here
		}
		[Test, TestCaseSource(typeof(TestData), "Messages")]
		public void TestCase1(ESBMessage message, string expected)
		{
			processStep = new ComplexProcessStep.MyComplexProcessStep()
			{
				IsEnabled = true,
				CustomMessage = "My Custom Message"
			};
			pipeline.Steps.Add(processStep);
			pipeInstance = runtime.CreateInstance<ESBMessage>(pipeline,
				configuration);
			context = new PipelineContext<ESBMessage>(runtime, pipeInstance.Pipeline,
				pipeInstance, message);
			processStep.Execute(context);
			Assert.That(context.Data.Text, Is.EqualTo(expected));
		}
		[Test]
		public void TestCase2()
		{
		}
		[Test]
		public void TestCase3()
		{
		}
		}
		public class TestData
		{
		static object[] Messages = {
				new object[] { new ESBMessage("Topic1", "Test Message1"),
				 "Expected Result1"},
				new object[] { new ESBMessage("Topic1", "Test Message2"),
				 " Expected Result2"},
				new object[] { new ESBMessage("Topic1", "Test Message3"),
				 " Expected Result3"}
			};
		}
Complete Process Test
using System;
using System.Collections.Generic;
using System.Linq;
using System.Text;
using System.Threading.Tasks;
using Neuron.Esb;
using Neuron.Pipelines;
using NUnit.Framework;
using Neuron.Esb.Pipelines;
using Neuron.Esb.Administration;
using System.Reflection;
namespace BusinessProcessUnitTests
{
	[TestFixture]
	public class BusinessProcessTests
	{
		private PipelineContext<ESBMessage> context;
		private PipelineRuntime runtime;
		private Pipeline<ESBMessage> pipeline;
		private PipelineInstance<ESBMessage> pipeInstance;
		private ESBConfiguration configuration;
		public BusinessProcessTests()
		{
			runtime = new PipelineRuntime();
			runtime.DesignMode = true;
			using (Administrator admin = new Administrator(@"C:\MyESBConfig"))
			{
				admin.OpenConfiguration();
				configuration = admin.Configuration;
				admin.CloseConfiguration();
			}
		}
		~BusinessProcessTests()
		{
			if (pipeInstance != null)
				pipeInstance.Dispose();
			if (context != null)
				context.Dispose();
		}
		[SetUp]
		public void Init()
		{
			pipeline = new Pipeline<ESBMessage>();
		}
		[TearDown]
		public void Cleanup()
		{
			//Cleanup here
		}
		[Test, TestCaseSource(typeof(TestData), "Messages")]
		public void ProcessTestCase1(ESBMessage message, string expected)
		{
			pipeline = configuration.ESBMessagePipelines["6b219535-1bf3-4100-9934-030570ea8863"].Pipeline;
			foreach (IPipelineStep step in pipeline.Steps)
			{
				var stepProp = step.GetType().GetProperty("DesignModeEsbConfigSelector",
				BindingFlags.Static | BindingFlags.DeclaredOnly | BindingFlags.Public);
				if (stepProp != null)
					stepProp.SetValue(step, new EsbConfigSelectorDelegate(() => {
						return configuration; }));
			}
			runtime.InstanceAborted += HandleAborts;
			pipeInstance = runtime.CreateInstance<ESBMessage>(pipeline,
				configuration);
			message.Header.SourceId = "Publisher1";
			ESBMessage outMsg = pipeInstance.Execute(message);
			Assert.That(pipeInstance.UnhandledException, Is.Null);
			Assert.That(outMsg.Text, Is.EqualTo(expected));
		}
		private void HandleAborts(object sender, PipelineInstanceEventArgs e)
		{
			if (e.Instance.UnhandledException != null)
				Assert.Fail(e.Instance.UnhandledException.Message);
			else
				Assert.Fail("The Pipeline \"" + e.Instance.Pipeline.Name
				+ "\" aborted");
		}
		public class TestData
		{
			static object[] Messages = {
			new object[] { new ESBMessage("Topic1", "Test Message1"),
			 "Expected Result1"},
			new object[] { new ESBMessage("Topic1", "Test Message2"),
			 "Expected Result2"},
			new object[] { new ESBMessage("Topic1", "Test Message3"),
			 "Expected Result3"}
			};
		}
	}
}