Reporting
Message Tracking
Neuron applications can audit messages from Business Processes. The captured messages are shown here. This includes messages audited for tracking as well as messages audited when failures occur. As a good practice, application developers should have provisioned auditing of the failed messages. Using the pages below you can republish the failed messages when error conditions are resolved. You can also view captured messages to examine all different properties, headers, body and other metadata associated with the messages. The message tracing page shows the exact path followed by the message through the Neuron application.
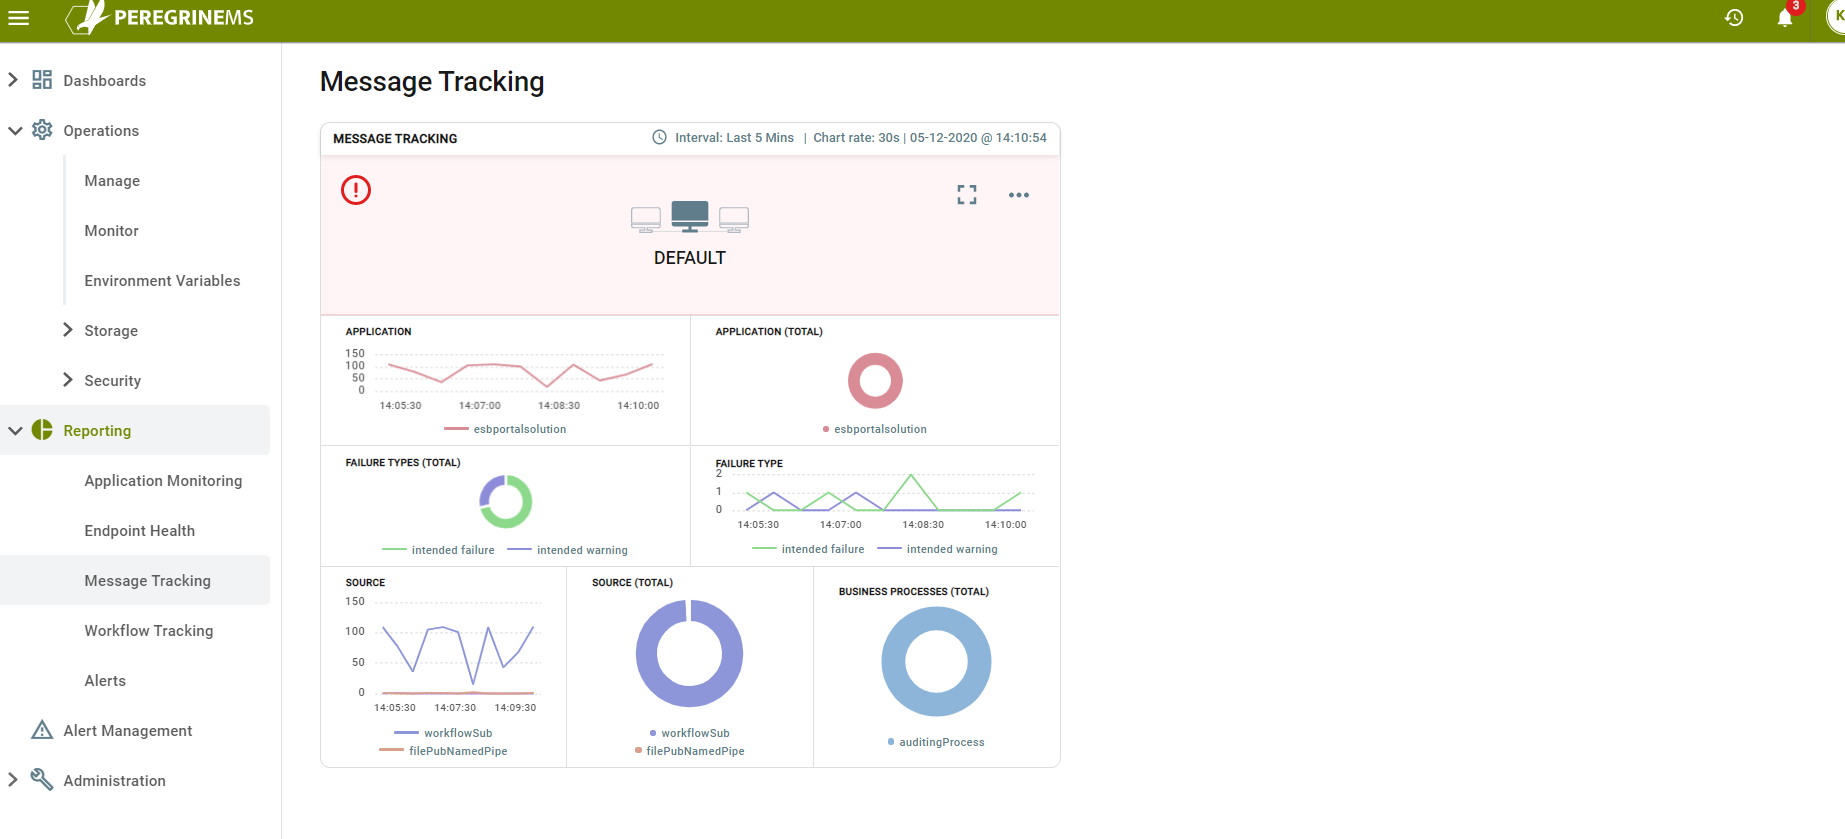
The card view of the Message Tracking contains the following parts.
First row shows the selected Environment and Instance.
In the second row, a line chart shows number of messages audited on a sliding time scale. Next to this a pie chart shows the breakdown of audited messages by application (if there are multiple applications running in an environment).
Third row shows the breakdown on failed messages by Failure Type on a pie chart and next to it count of messages by failure type on a line chart against a sliding time scale.
The last row shows the message counts by source (endpoint type) on a sliding time scale. Next to it you can see break down of message counts by source and business process respectively.
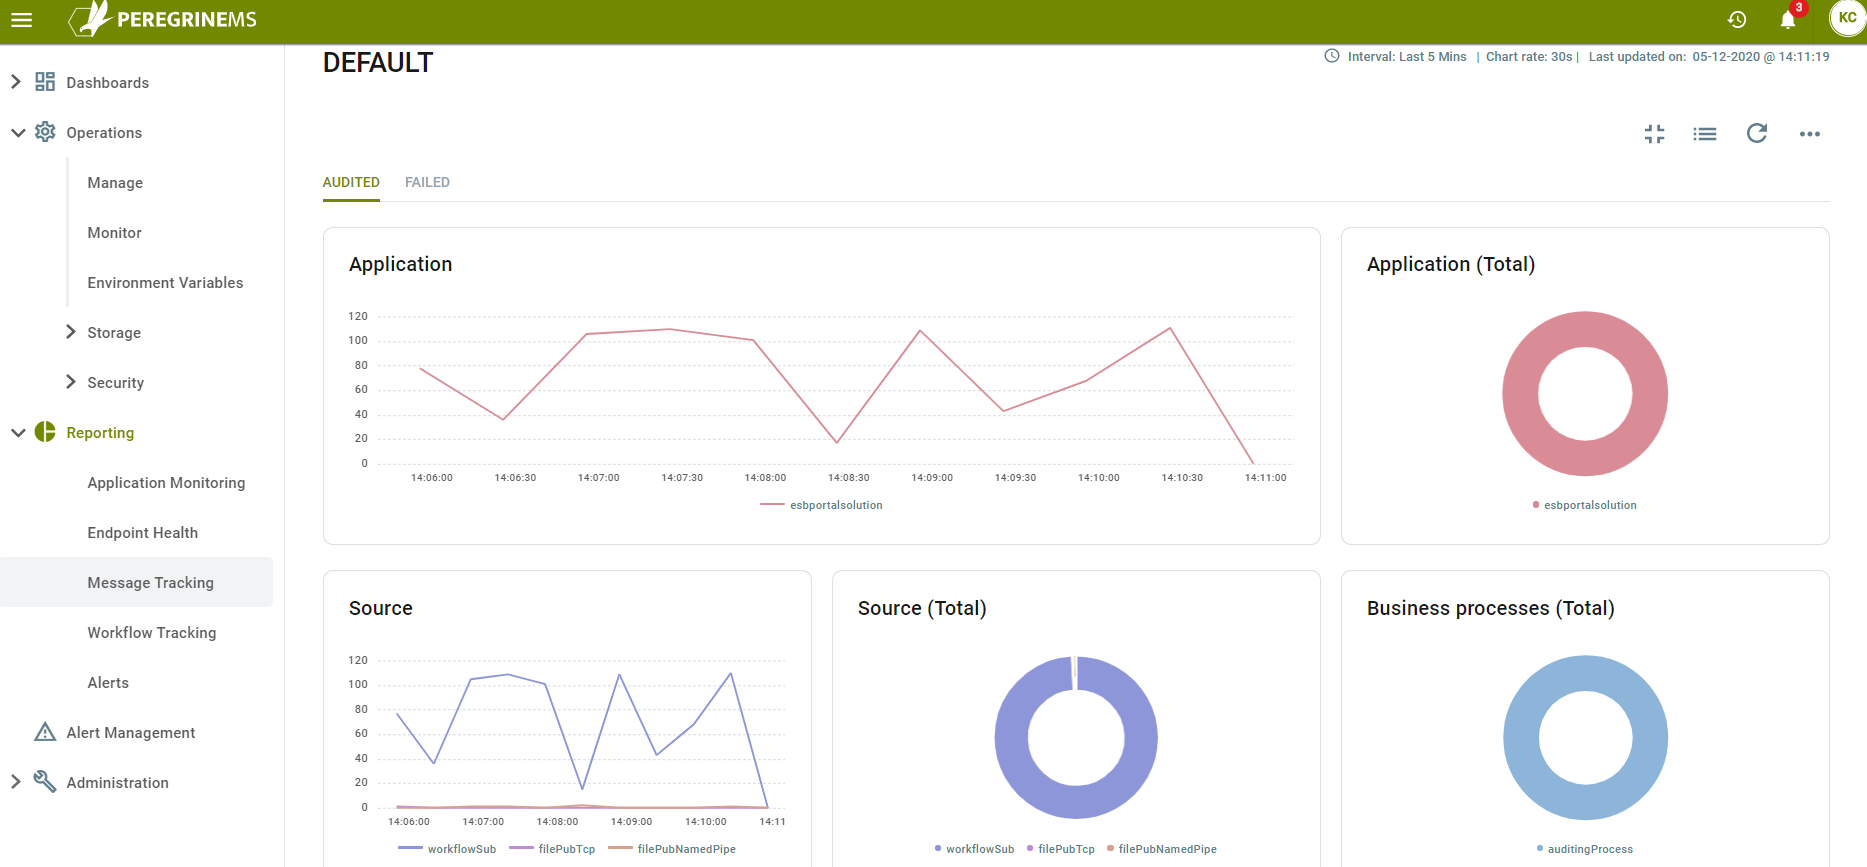
The detailed view of Message tracking shows the same widgets as the card view, but they are expanded, and they can be viewed for all audited messages or failed messages by selecting the corresponding tab on top.
You can also toggle to a list view of messages for viewing details on specific message or to republish a message. You can filter the messages by application, and you can show/hide certain columns to view properties that are most relevant for you. You can select to view and sort on Transaction Id to group and view messages that are part of the same flow.
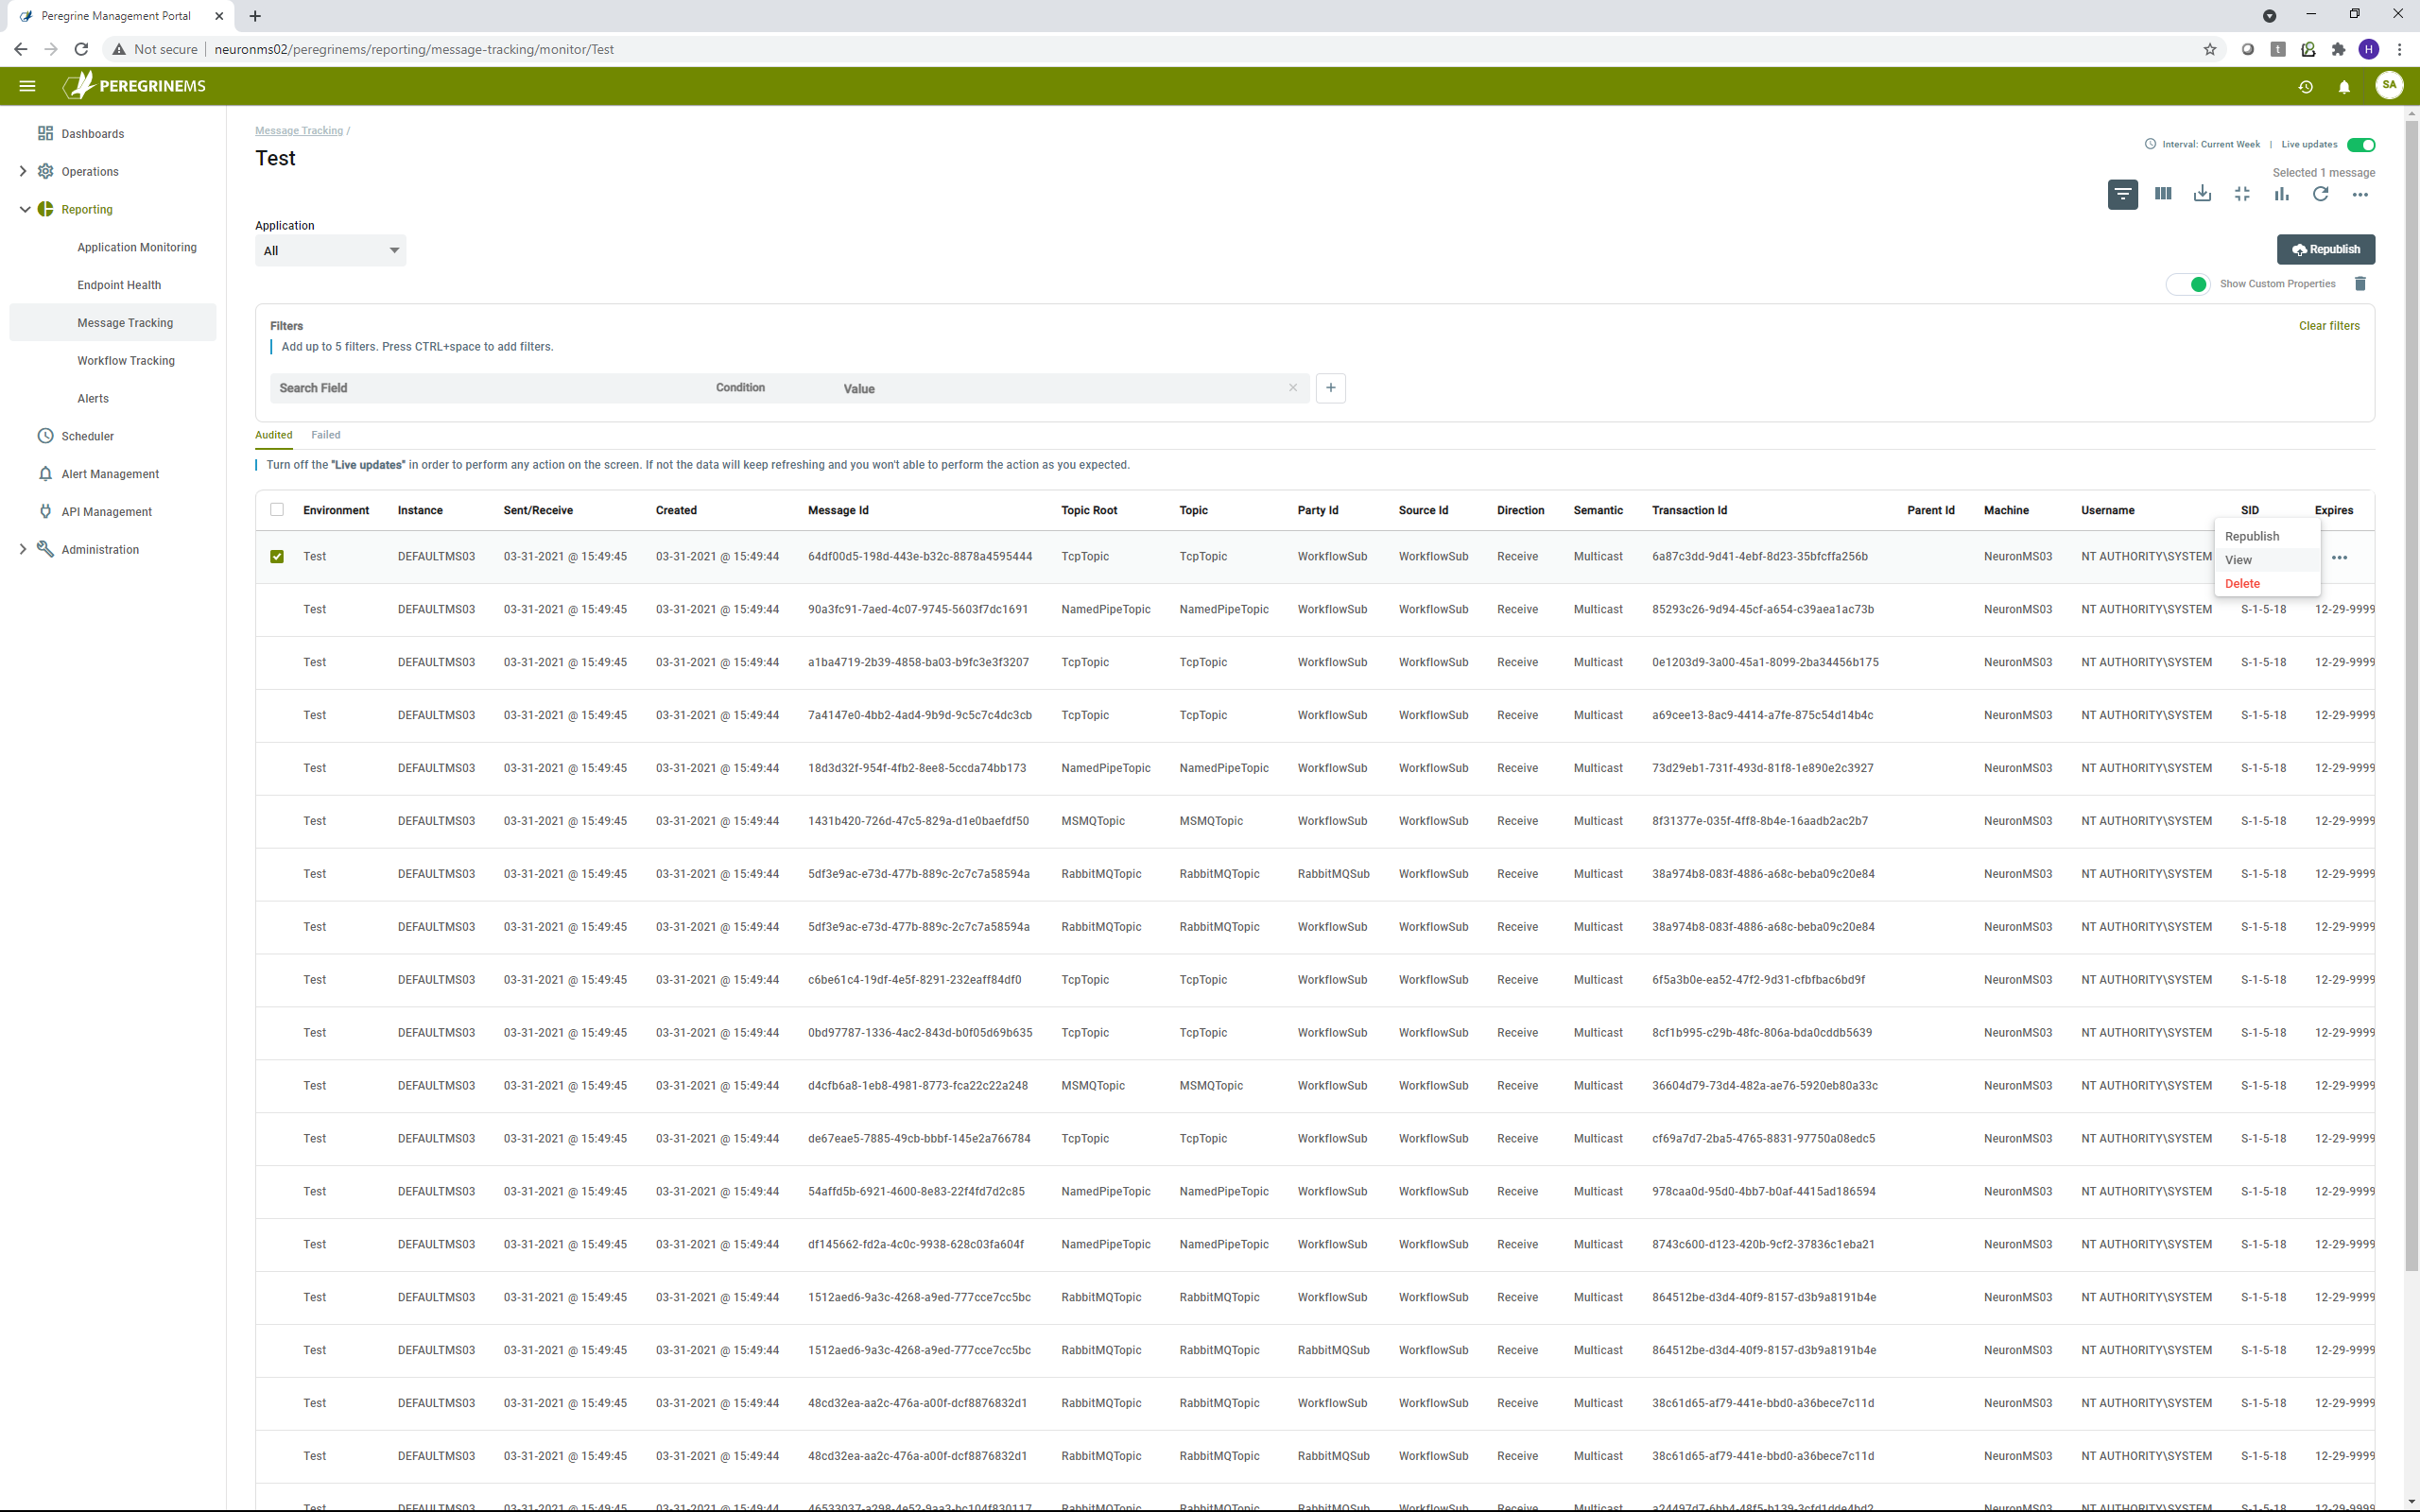
You can download messages using the download button on the top. You can delete selected messages using the delete button. Use the Republish button after selecting the messages to republish them. Toggling the show/hide custom properties, allows you to view or hide custom properties for audited messages in the grid below
The list of messages has following columns. You can change what columns to view in the grid using the accordion button for add/remove columns.
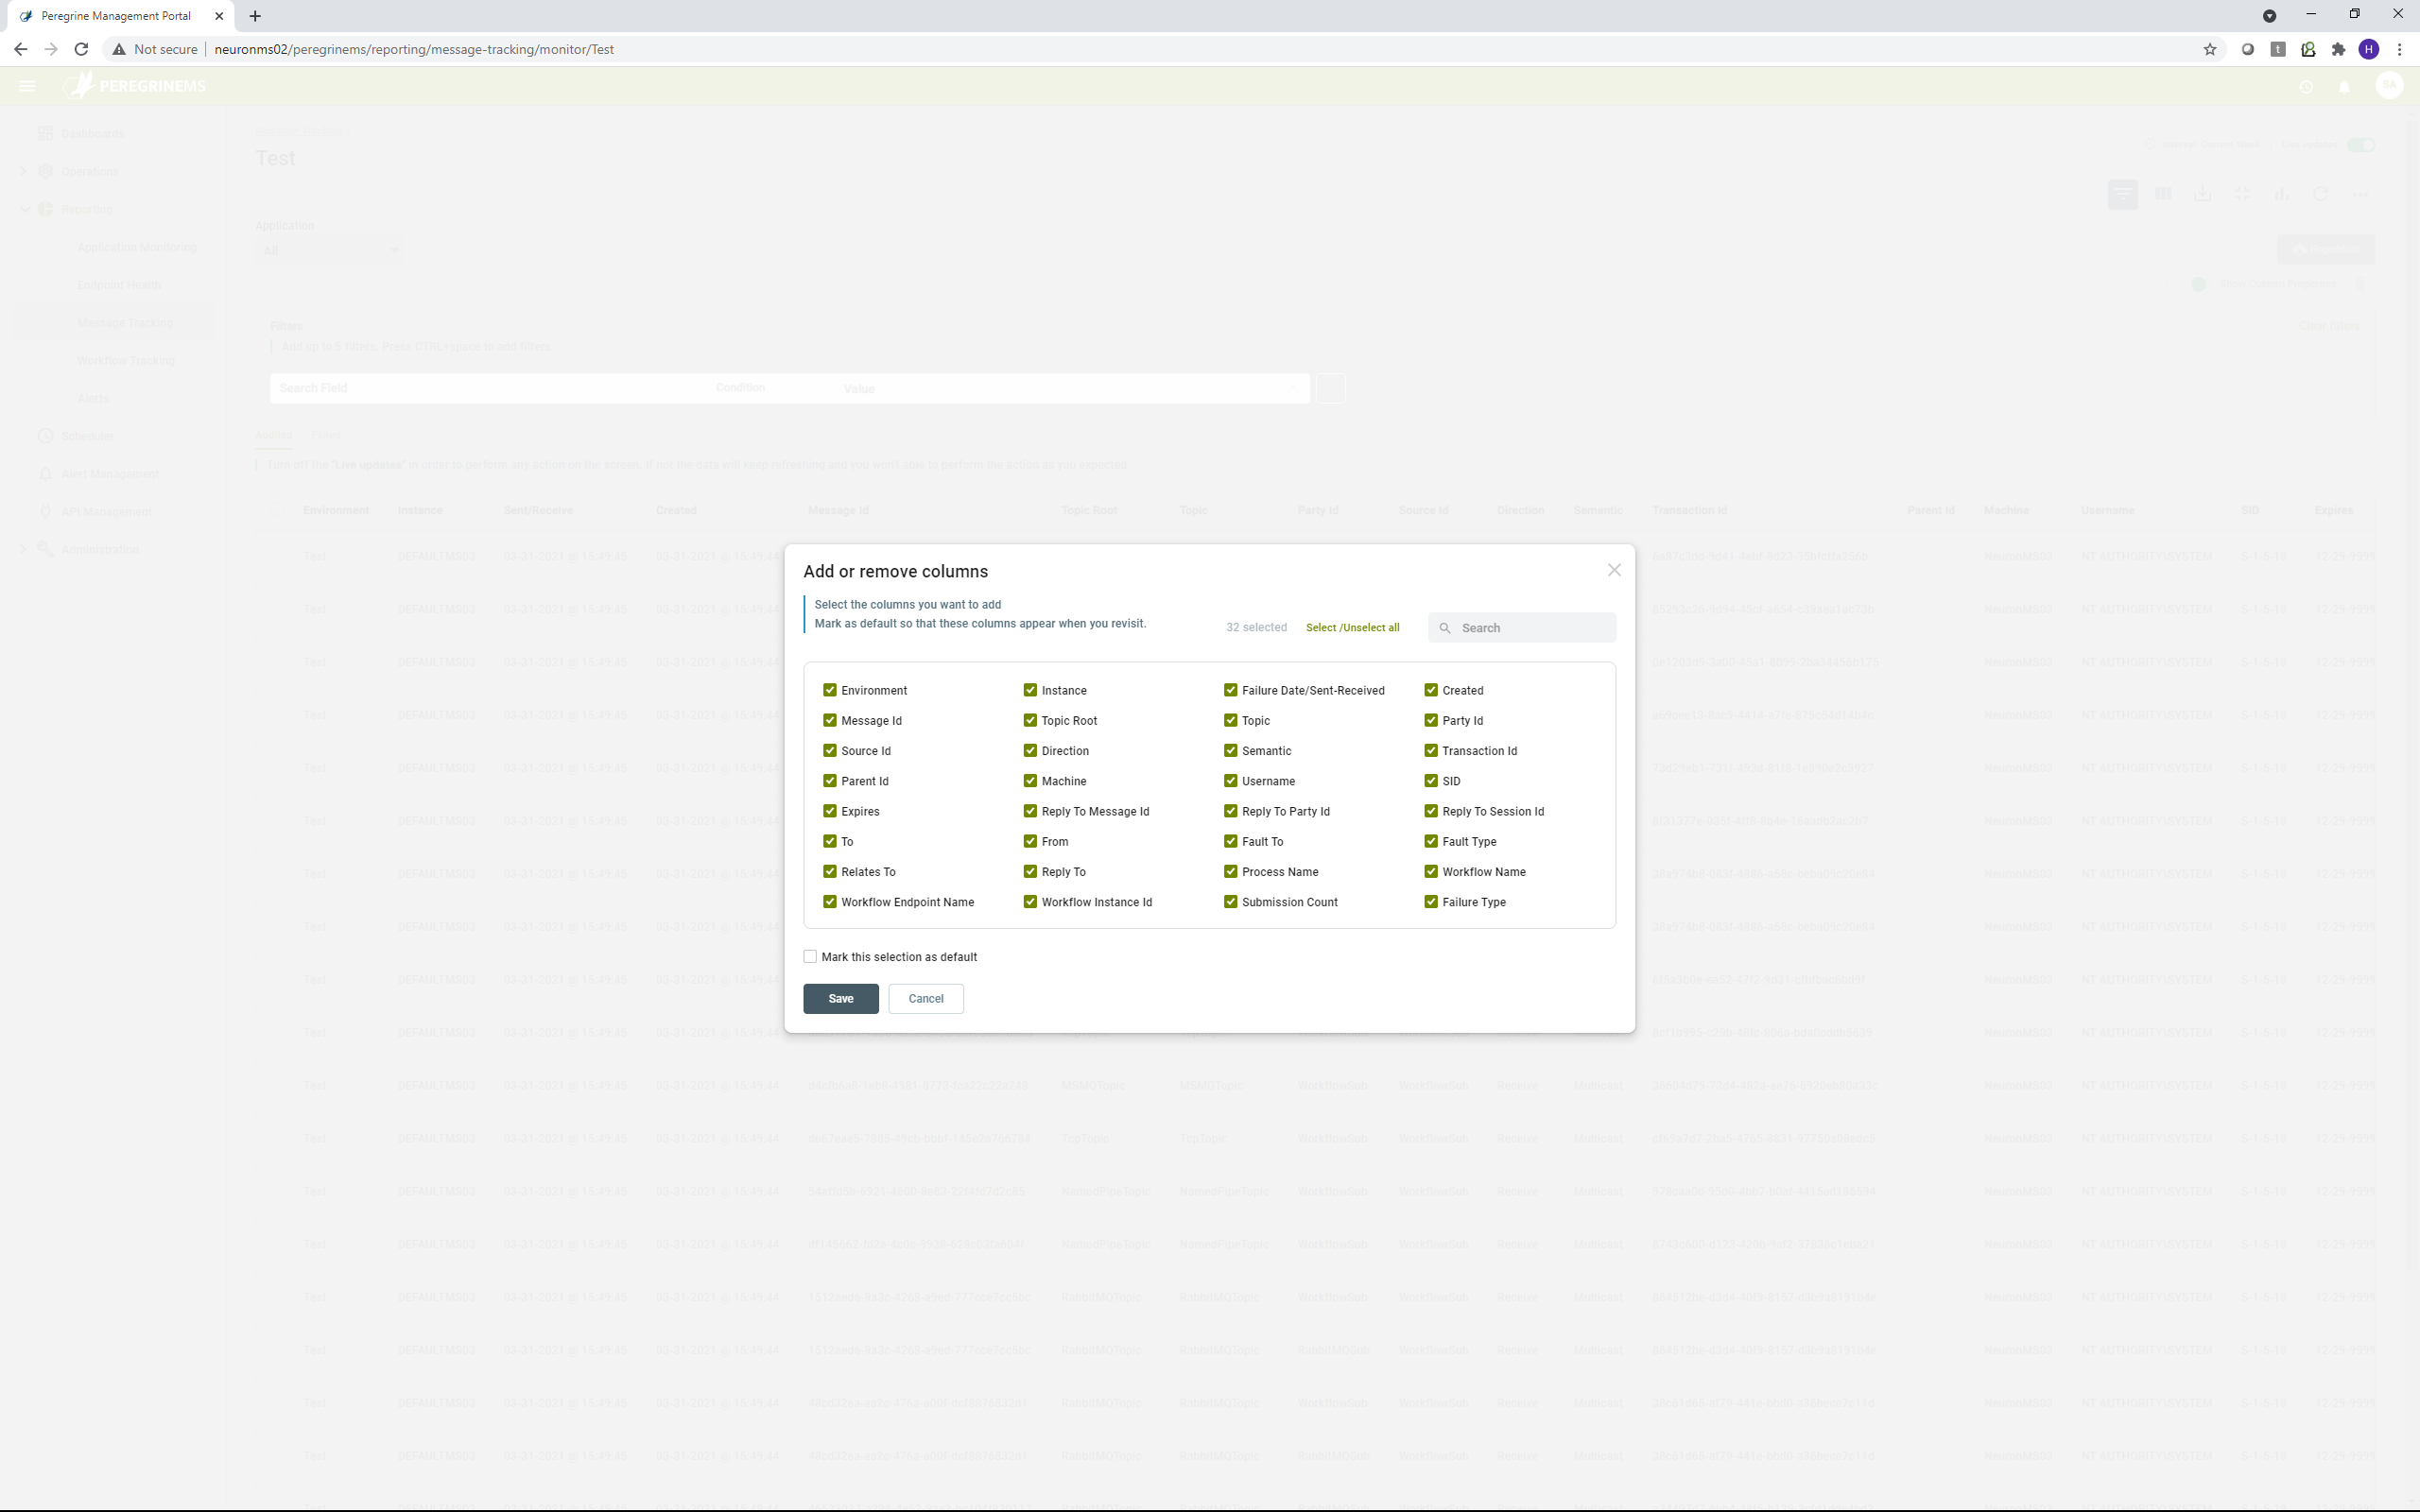
For definition of the message tracking columns, refer to the Neuron ESB documentation.
Using the Filter icon on top of the Message List grid, you can filter the messages by adding up to five conditions to search on combination of various fields and their values.
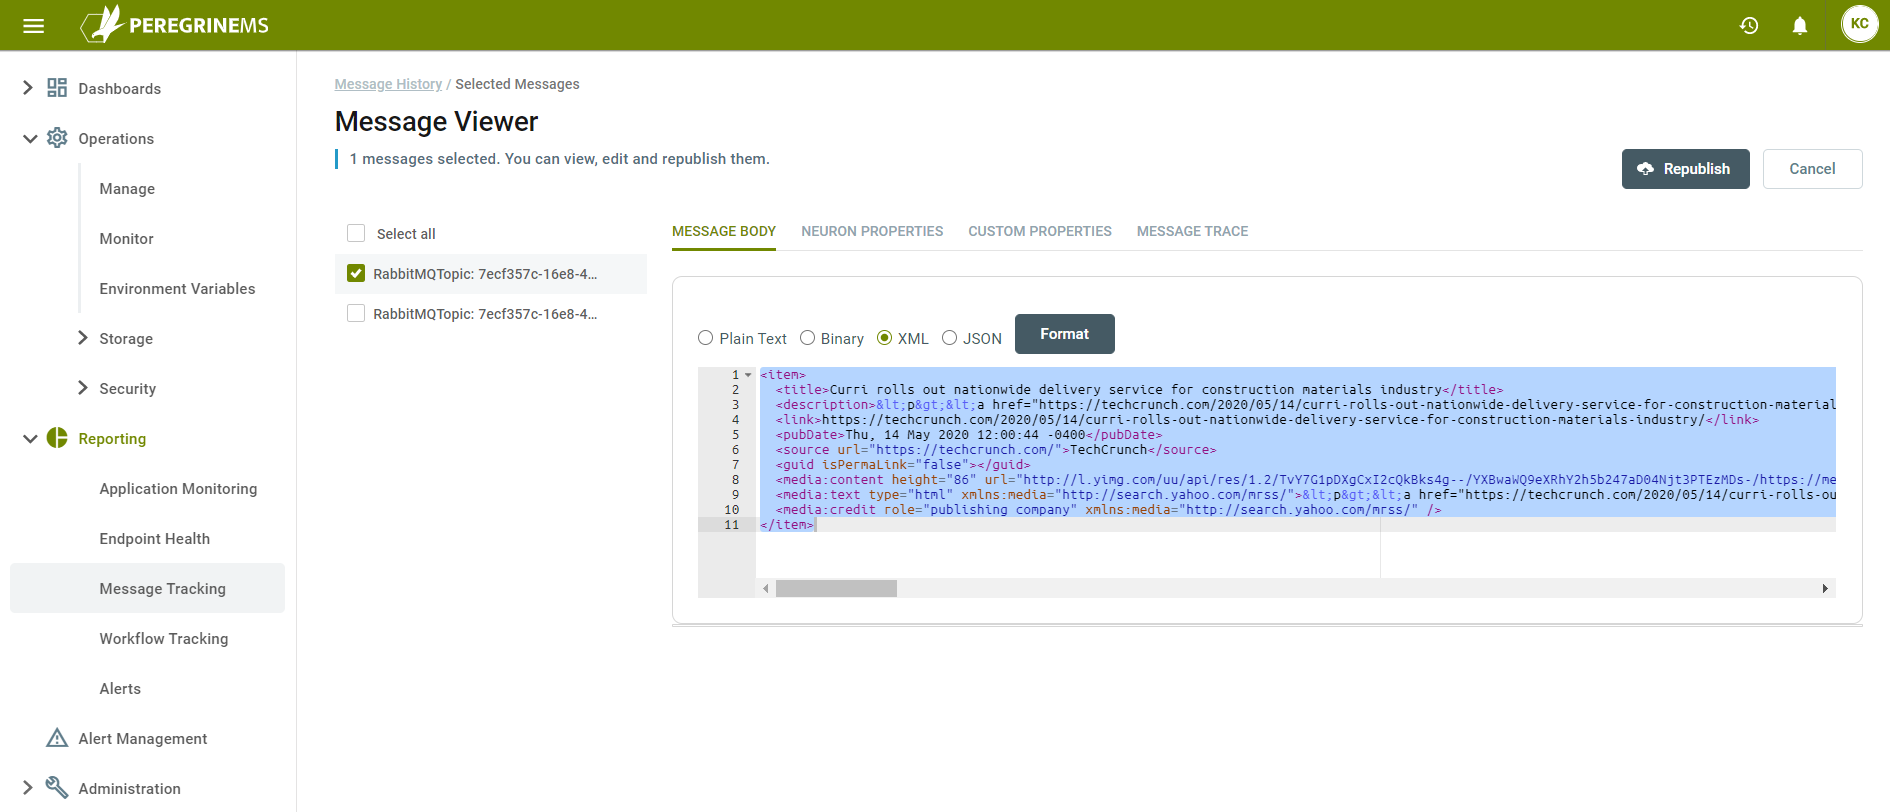
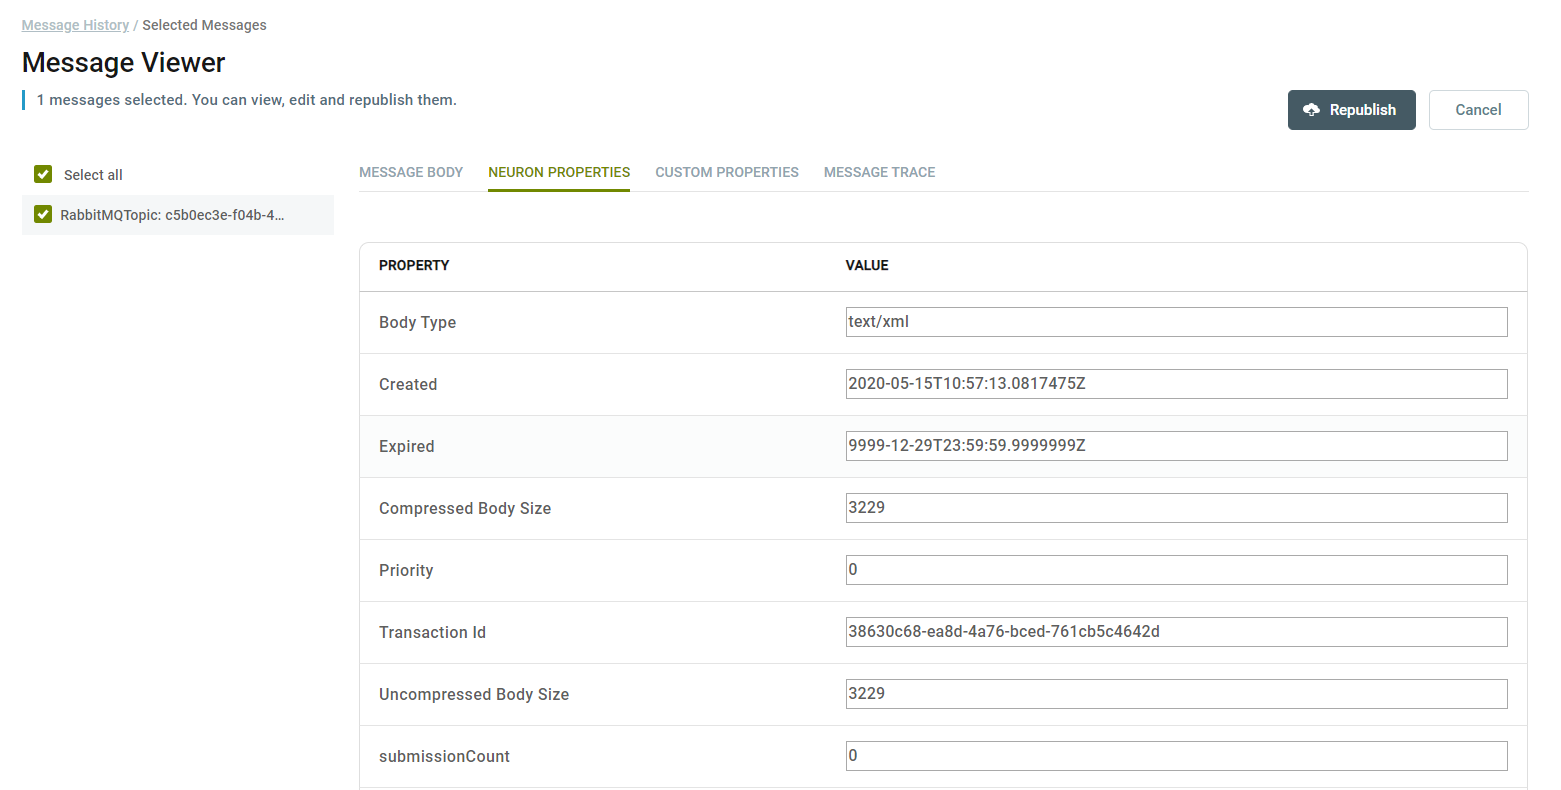
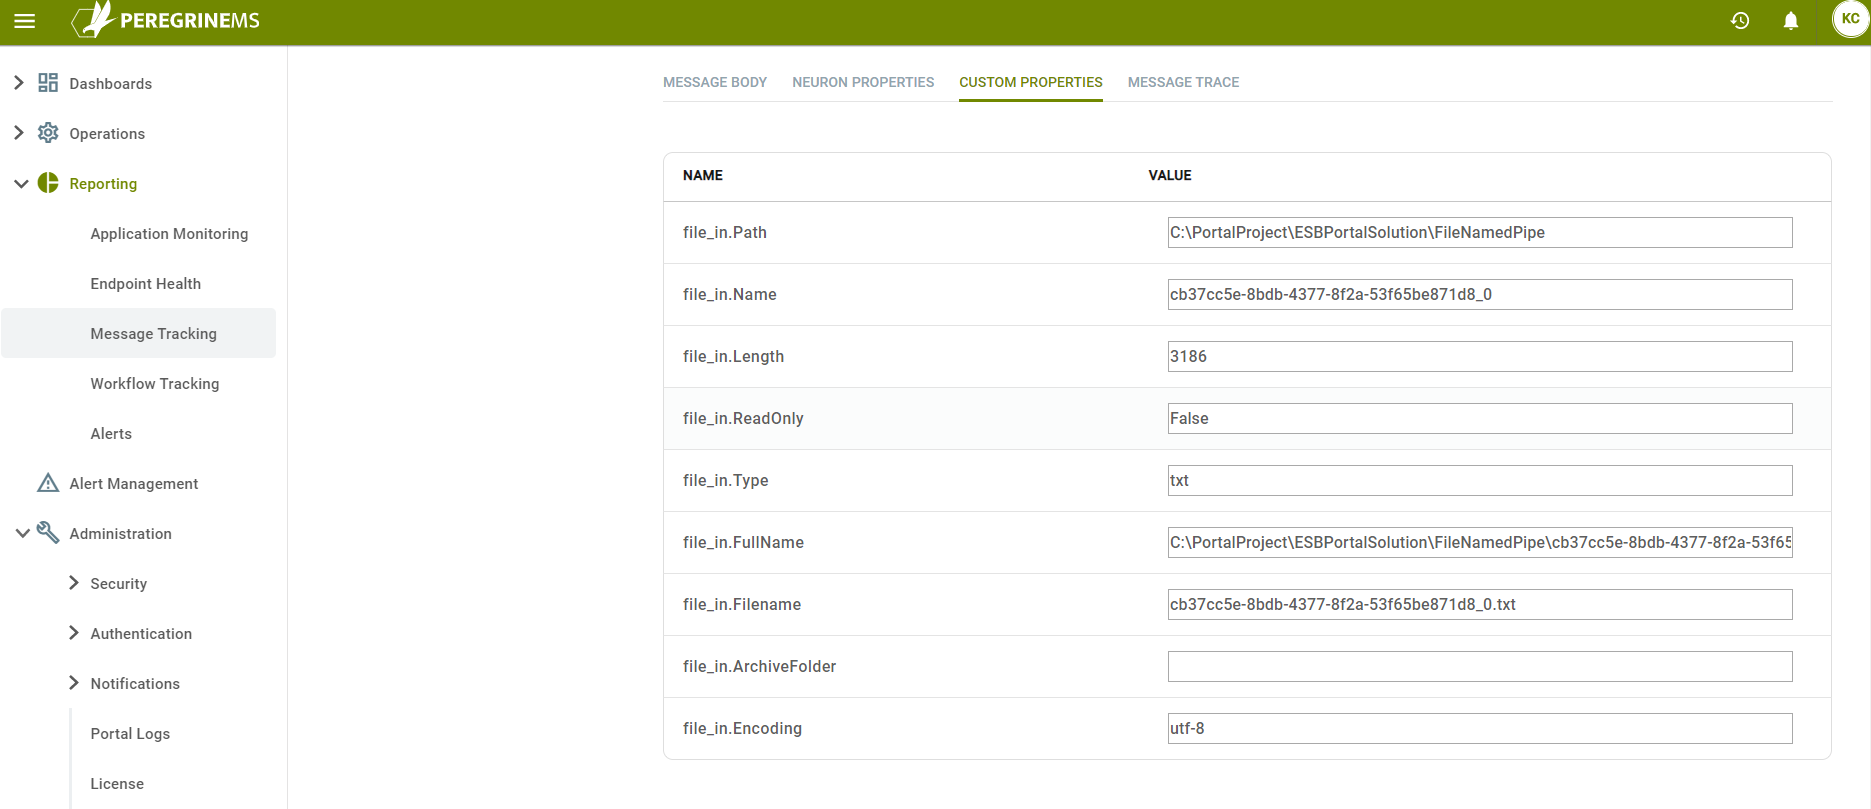
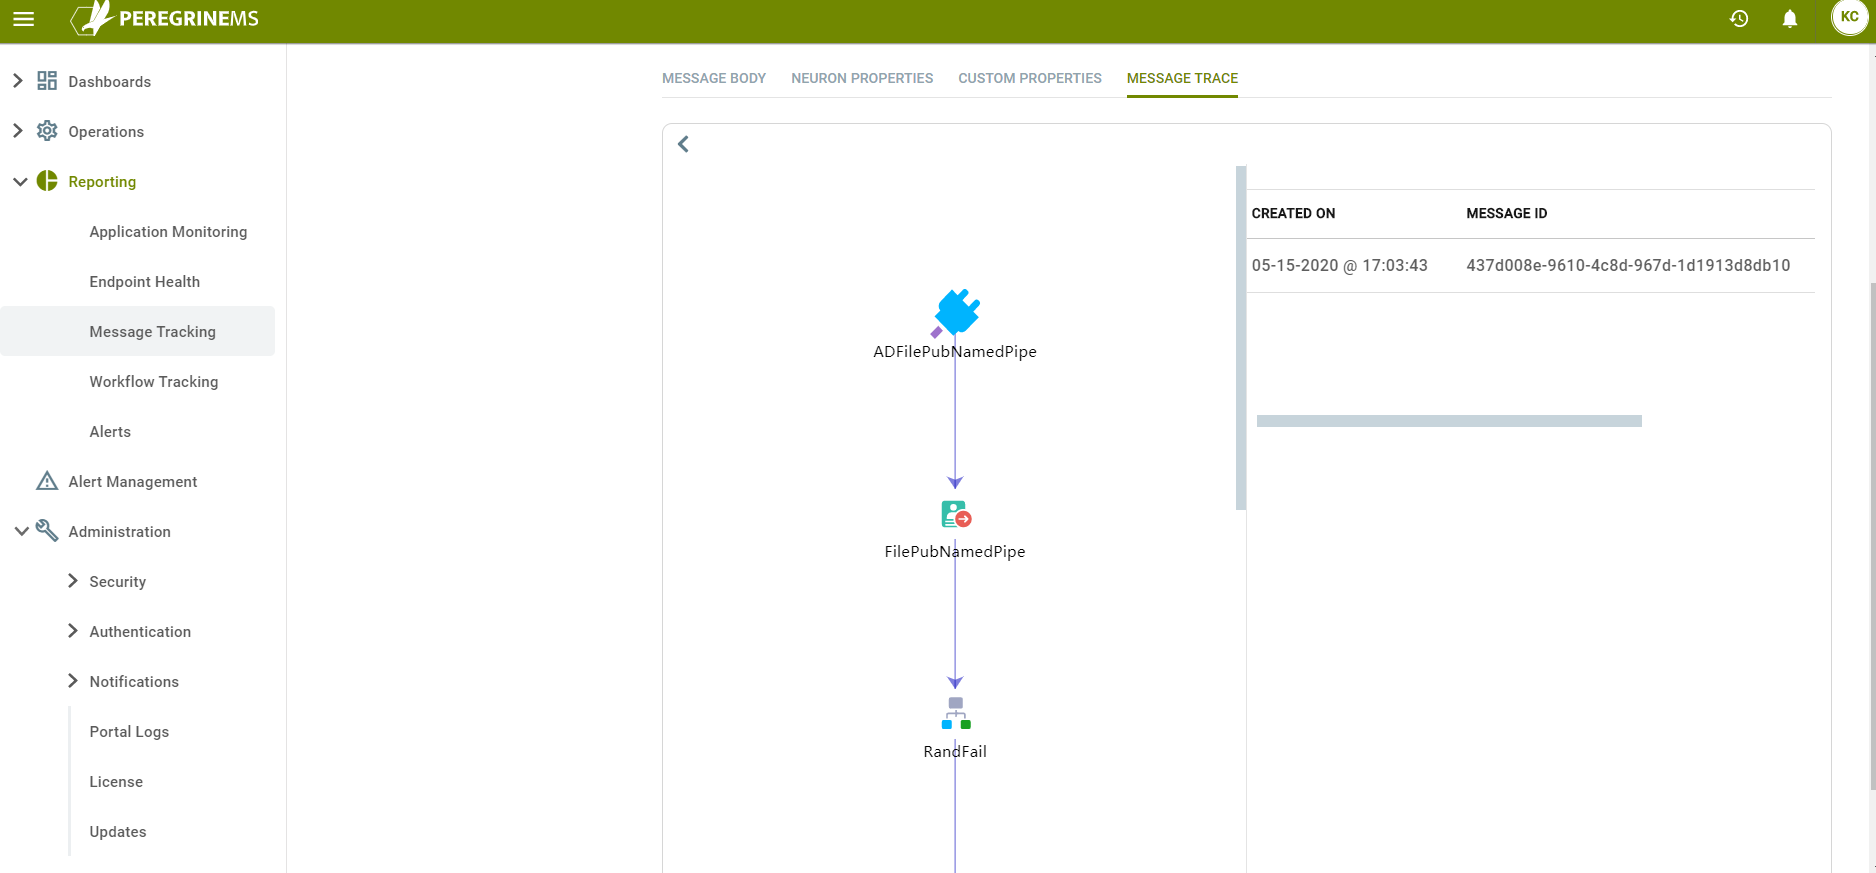
Selecting the context menu on a message row and clicking view, brings up message viewer. The message viewer shows all details of the message such as Message Body, Neuron Properties, Custom Properties and Message Trace.
Workflow Tracking
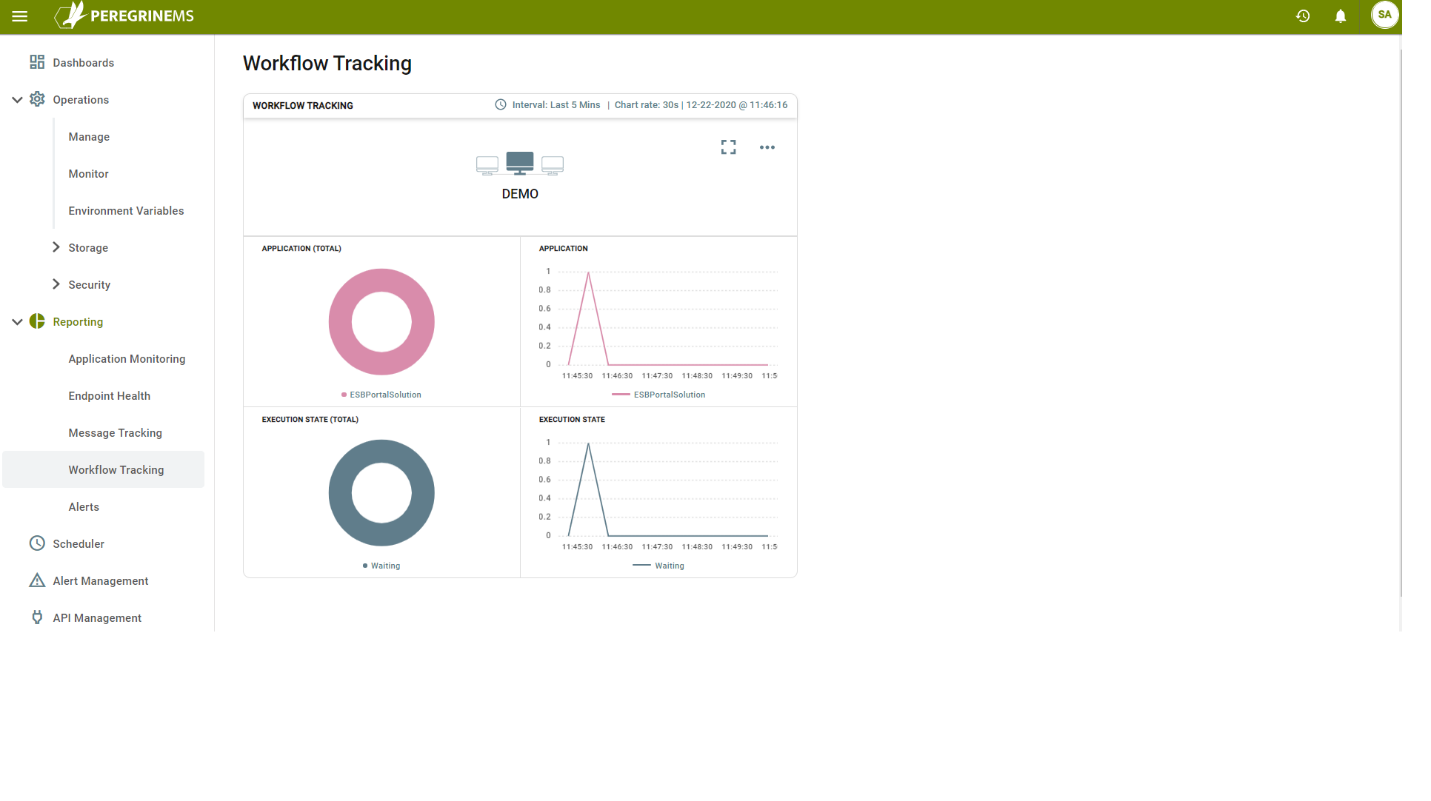
Using workflow tracking, you can view the rate and status of workflows by application and execution state. You can quickly identity if there are too many workflows in the waiting state. You can also track progress of the individual workflows through various activities. Following screen shows the card view of Workflow Tracking. On this view, it shows the name of environment in the top row. Second row shows number of workflows by application in a pie chart and a line chart against a sliding time scale. The third row shows workflows by execution state in a pie chart and a line chart against a sliding time scale.
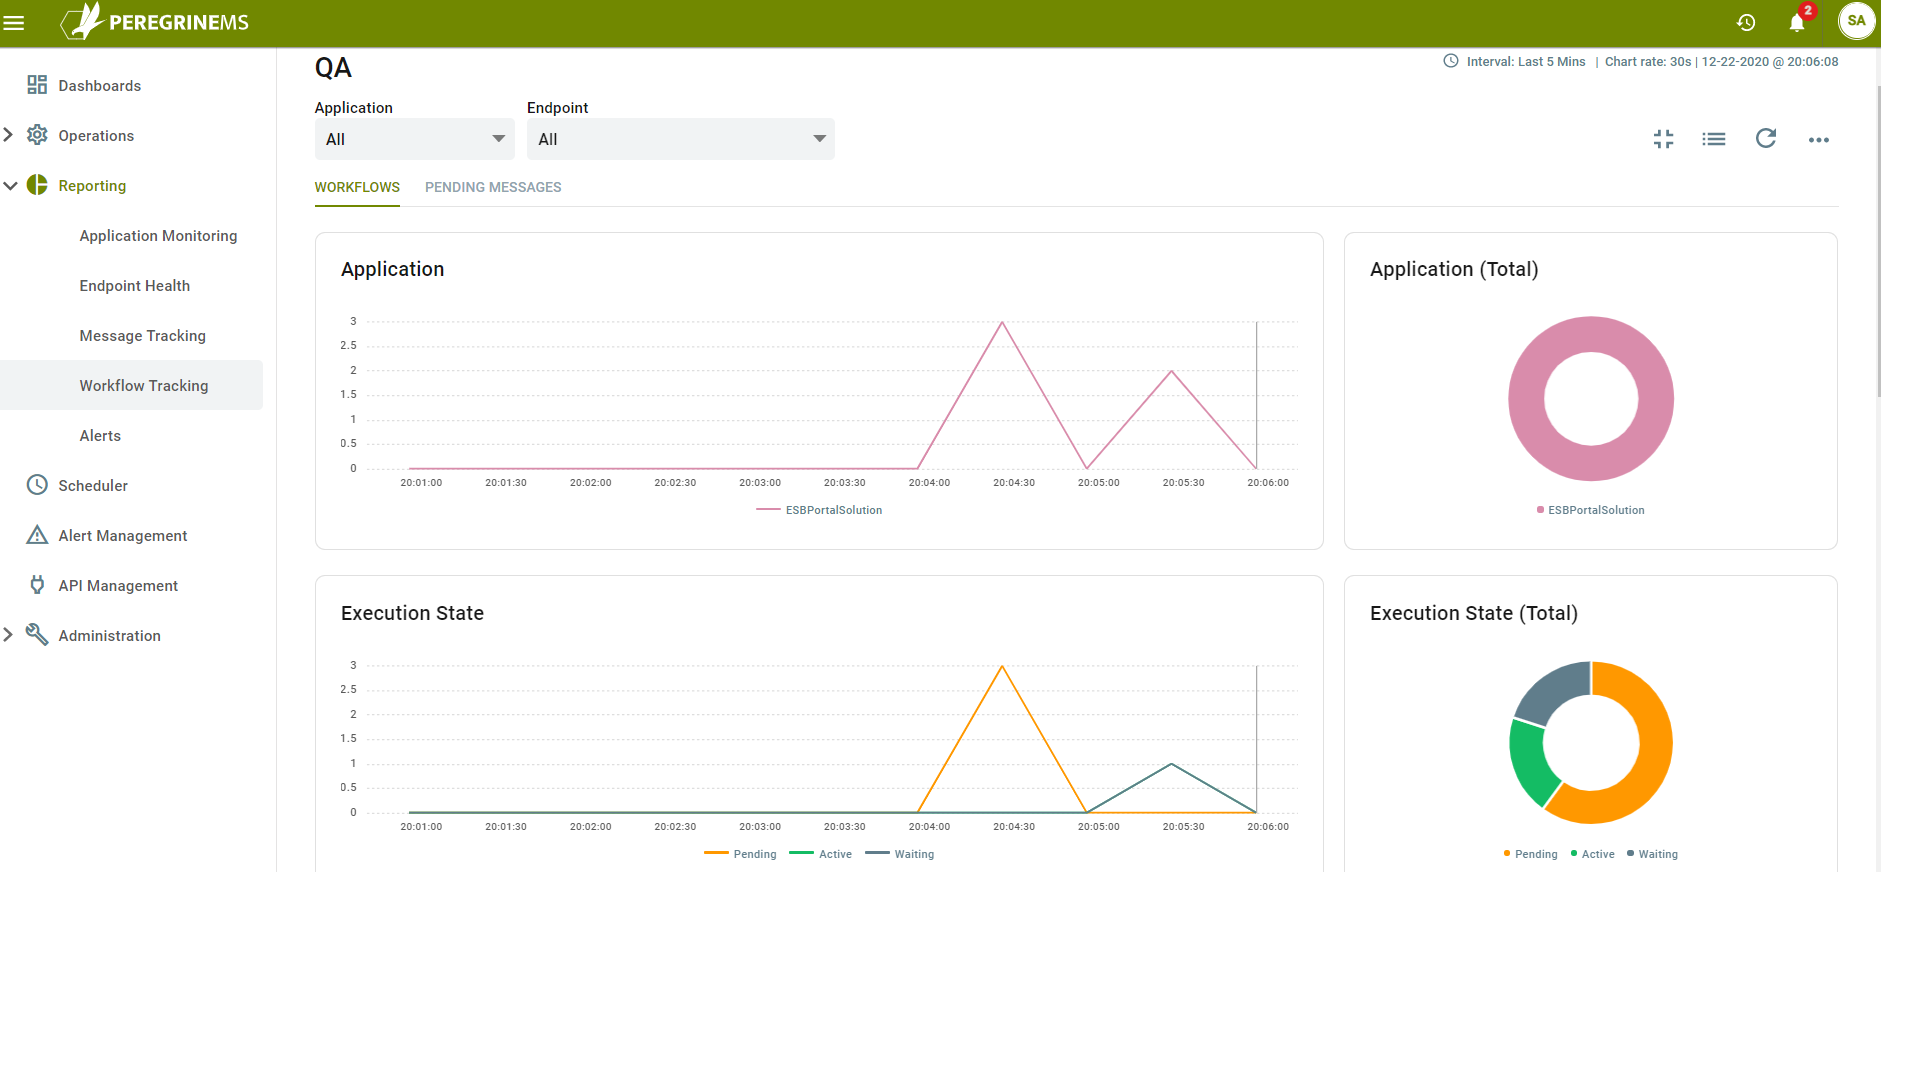
When you expand to detail page, the same information as summary page is seen in the top two rows with bigger size. This page has Filters to view information by Application and Endpoint combination.
There are two tabs under the filter drop-down boxes for Workflows and Pending Messages. Pending Messages happen under load when workflow engine is too busy to intake and start more workflows. These messages are queued up in Pending state, but they are always assured to be stored so that there is no data loss.
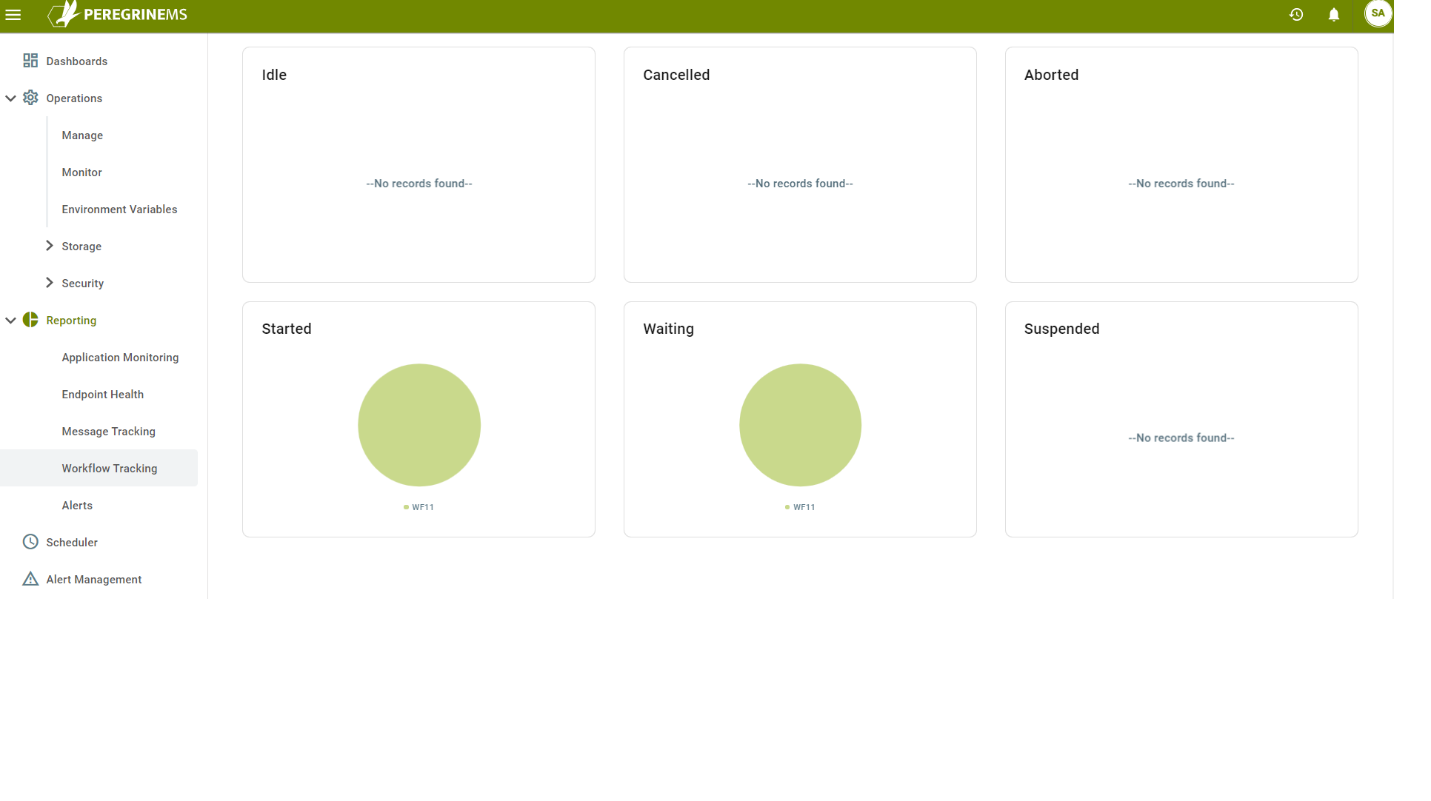
The following view shows pie charts of workflows in different states by workflow endpoint.
Workflow Execution States
Workflow execution views by execution states provide a good overall view of all the workflows. Following is a guide to workflow execution states.
Completed – Workflows that have completed all the activities and finished normally without issues
Pending – Workflows that are pending to be picked up the Workflow Endpoint Host. Can happen under load
Idle – Workflows that are running but idle because of a delay or listen activity
Waiting – Workflows that are waiting for a long running correlation activity
Started – Workflows that are currently executing
Cancelled – Workflows cancelled by user
Aborted – Workflows that failed and aborted
Terminated – Workflows terminated due to endpoint host failure or other system error
Suspended – Workflows that were suspended by the workflow process try – catch operation to be retried manually later.
When this page is switched to list view, the workflow records are listed in a grid view. This grid shows the following columns.
Started – Date/Time when the workflow got started
Machine – The machine one which the workflow is executing
Instance – The Neuron ESB instance under which the workflow is executing
Application – The Neuron ESB solution that contains this workflow
Workflow – Name of the Workflow
Workflow definition – A link to drill down into Workflow. Please see the sections after this one.
States – Workflow states for the workflow.
Topic – The topic that initiated the workflow
Subscriber – The subscriber that is hosting the workflow
Completed – Date/Time when workflow got completed
Using this grid view, you can click on a link in the workflow definition column to launch a workflow definition viewer tool. This tool is downloaded onto the browser’s computer because it is a Windows Native only tool, but it provides a rich UI to be able to analyze the workflow definition and issues without having to open Neuron Explorer and the solution.
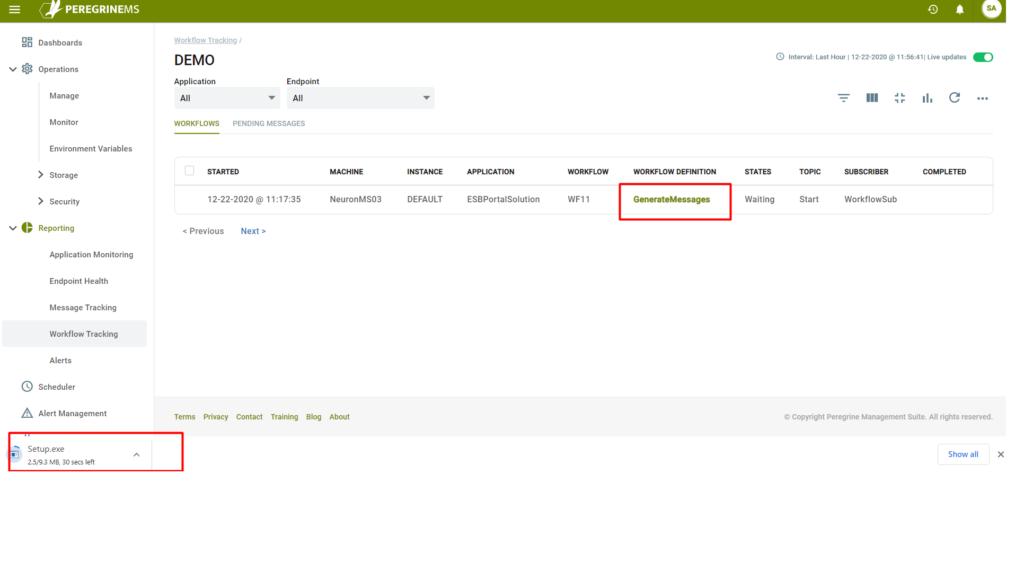
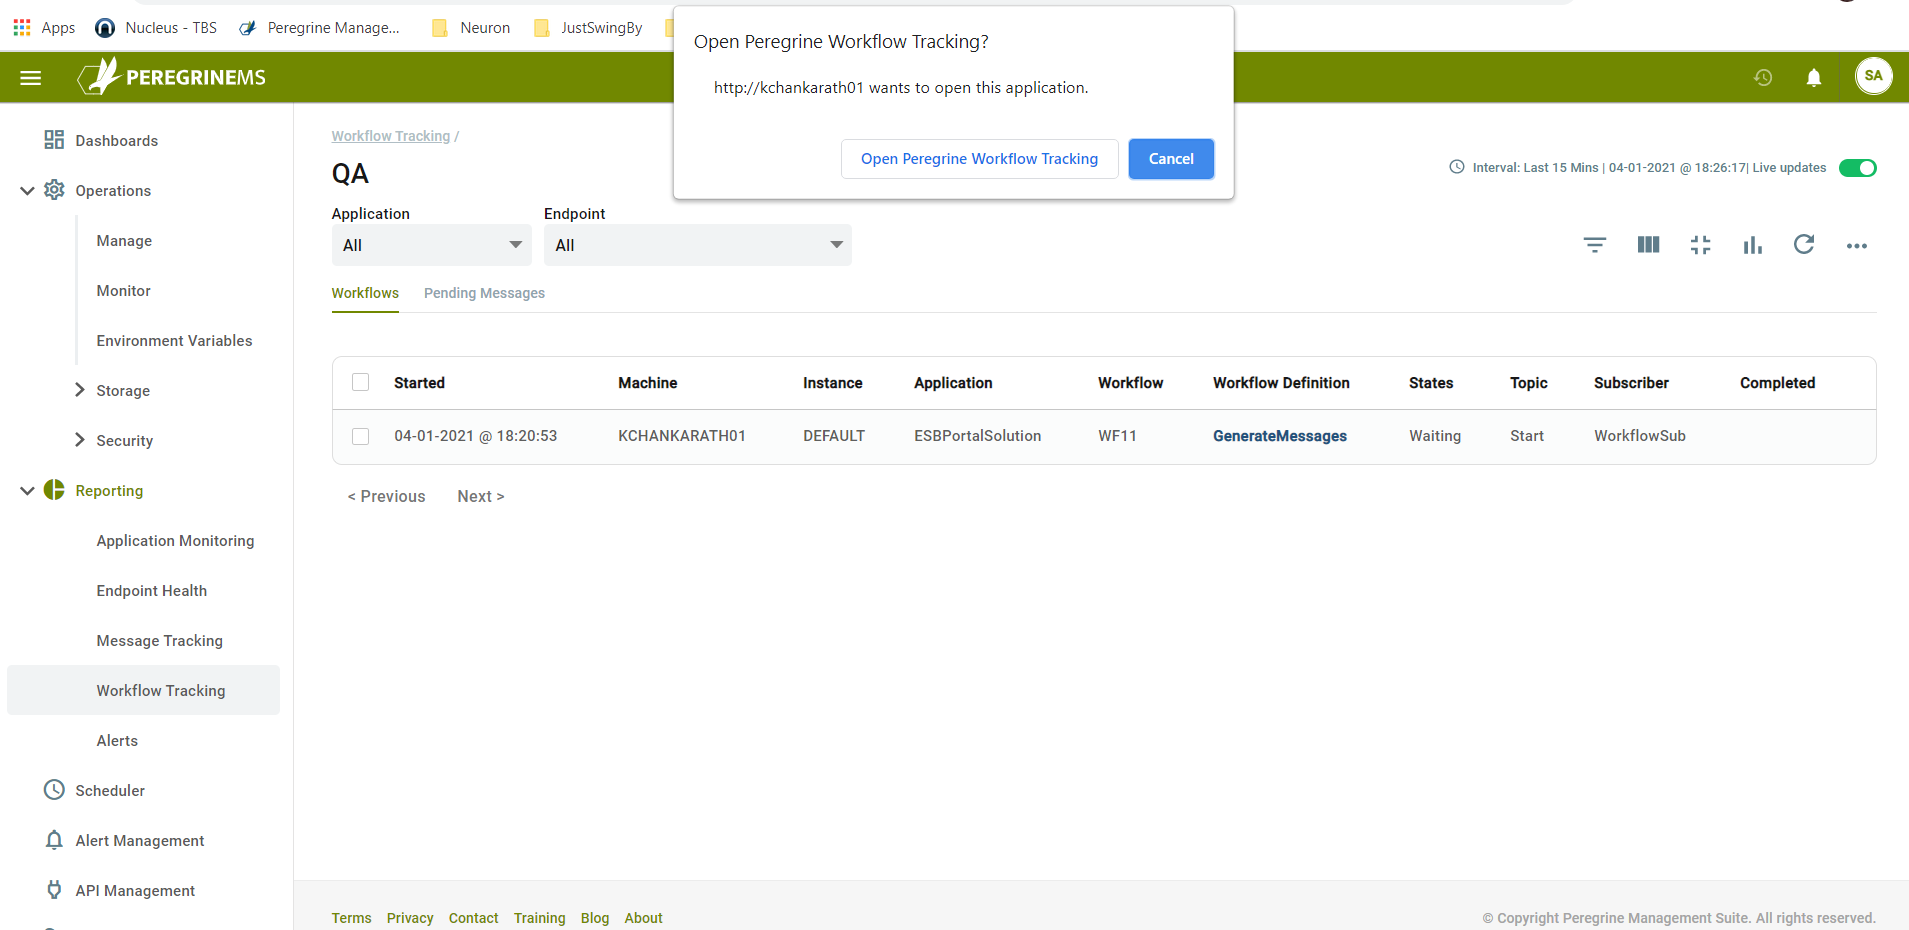
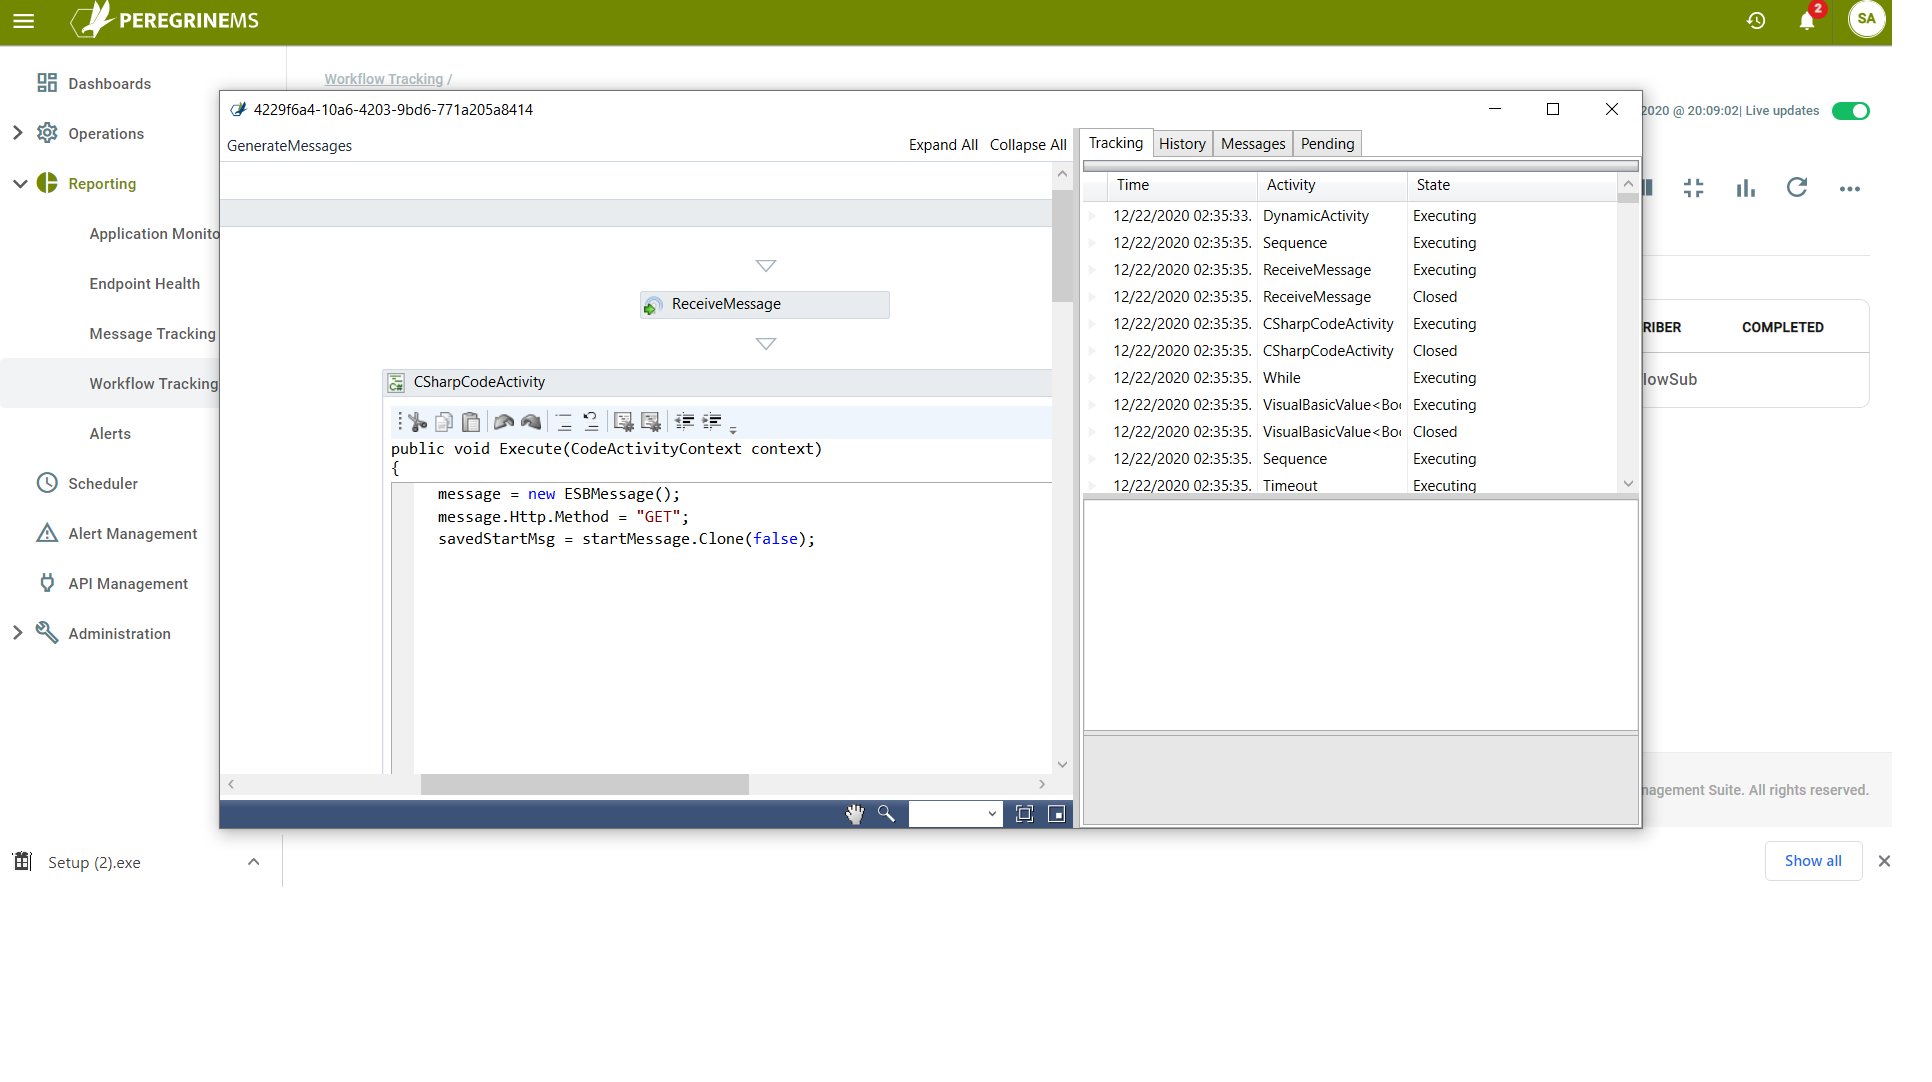
Once the tool is setup, clicking on the workflow definition link you can see the screens shown below.
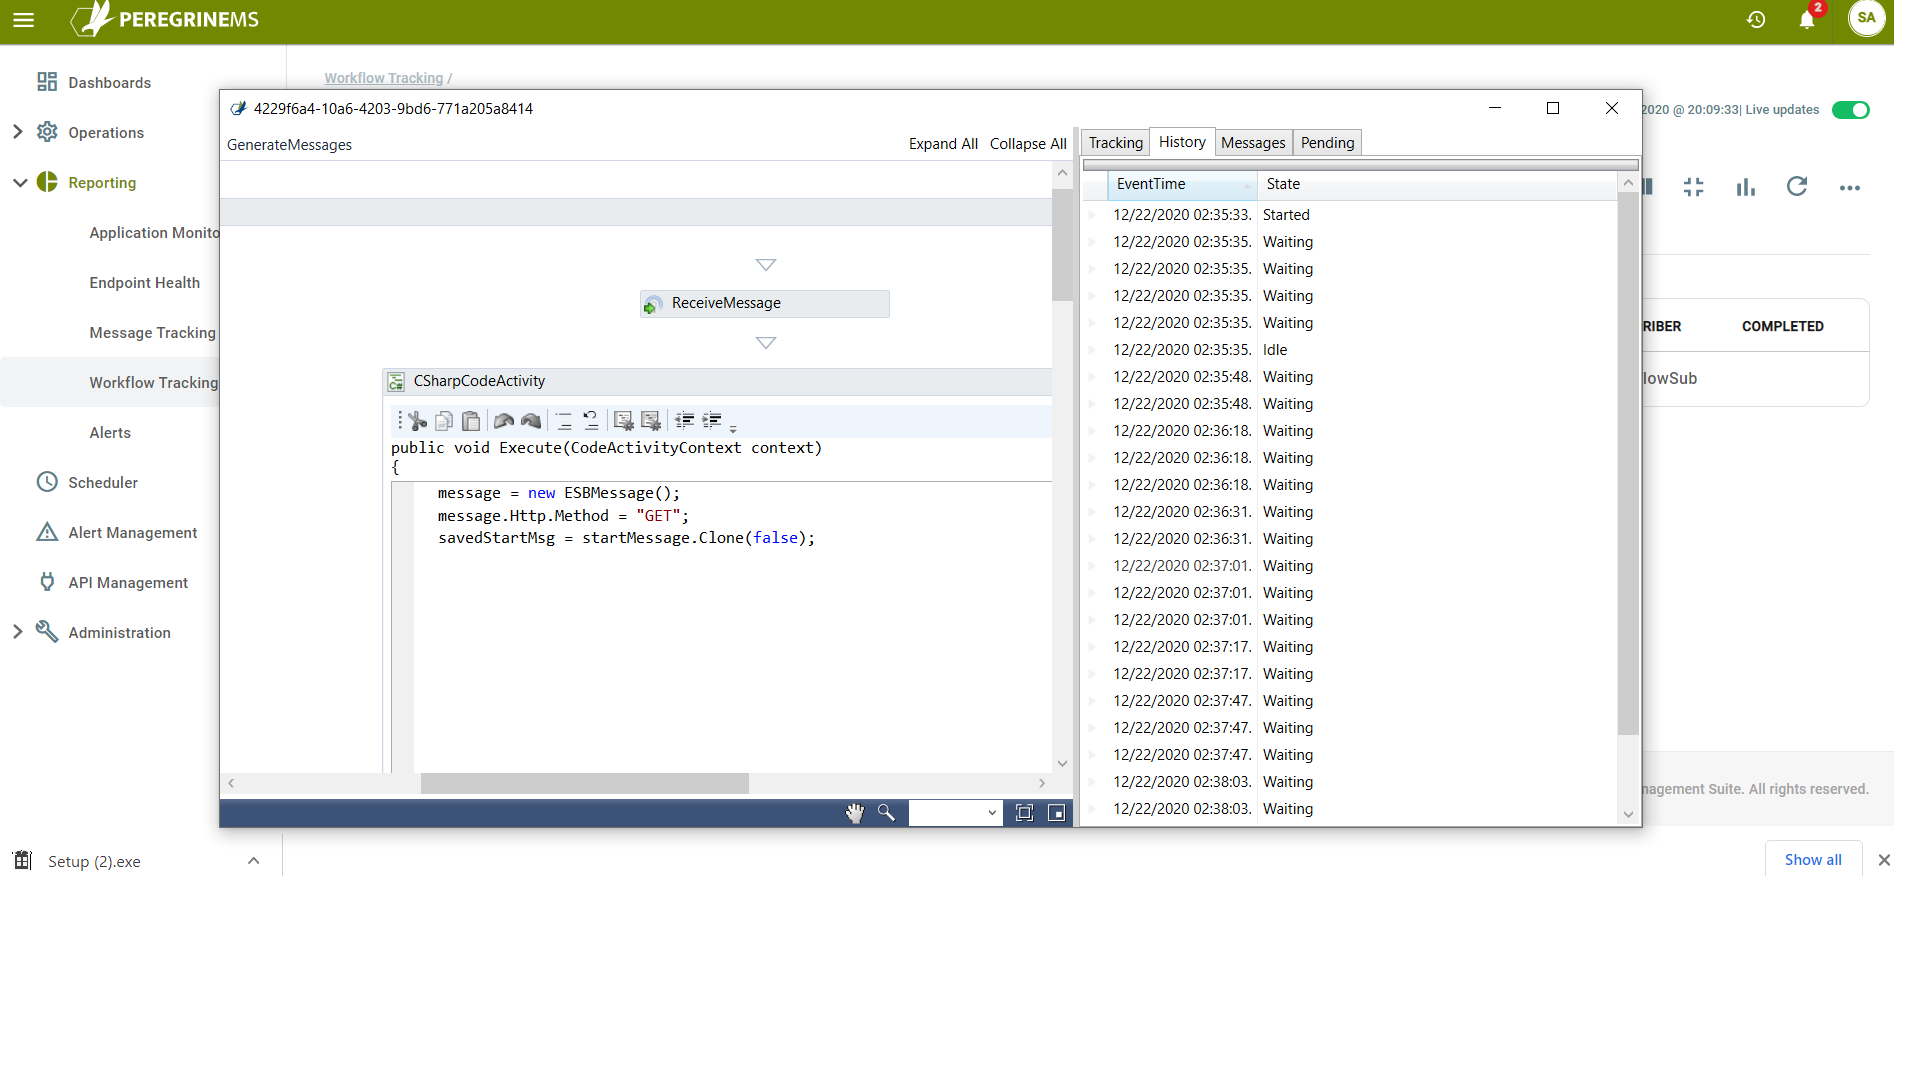
On all screens in the left-hand pane, you can see the workflow definition with all the steps in the workflow. On the first tab in the right-hand pane, you can see the workflow tracking records showing date/time
On the second tab, you can see the execution history of the selected workflow activity with Event date/time and state.
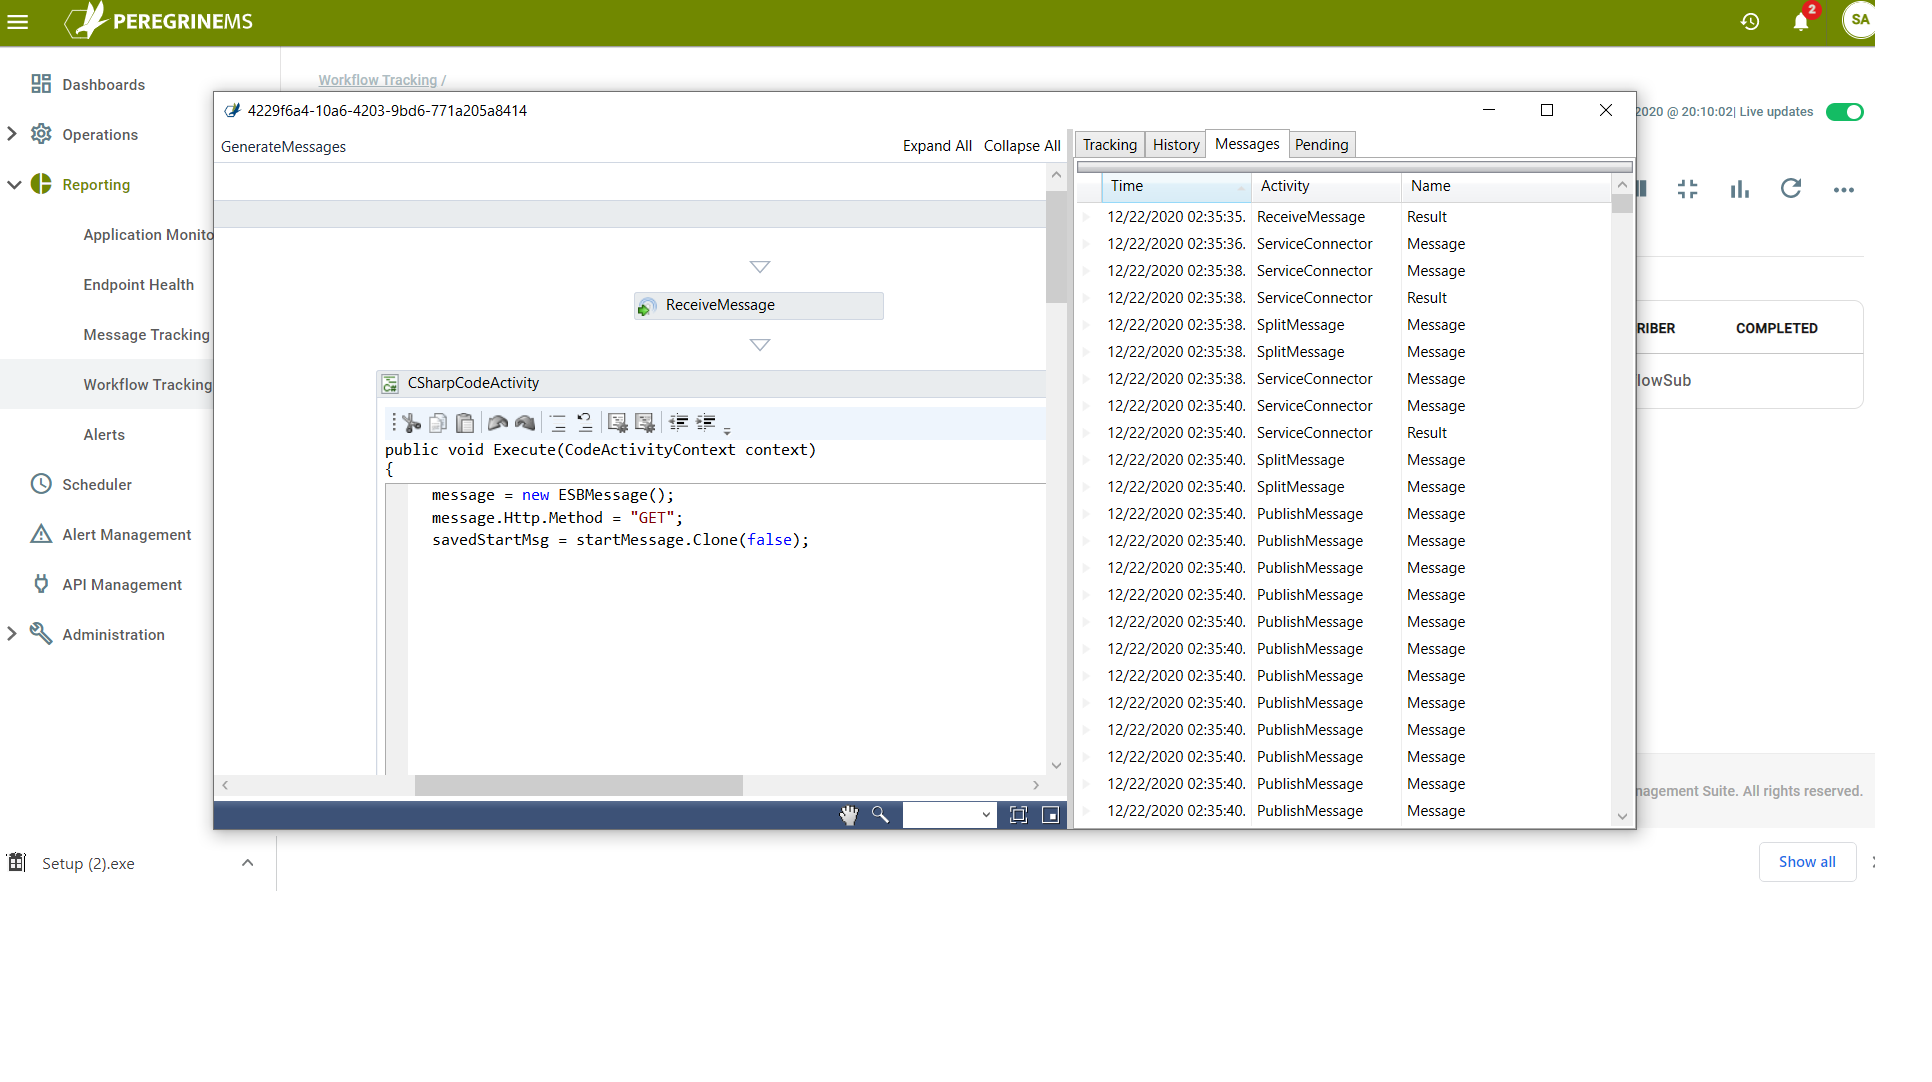
The following page shows the messages processed or generated by workflow activities along with activity name, Name of the message and date/time. Double clicking one of the messages brings up the next screen that is a workflow message viewer. The last tab on the workflow tracking is the Pending tab. This tab is like Messages tab and allows you to view the messages pending to be processed in detail with the same message viewer tool.
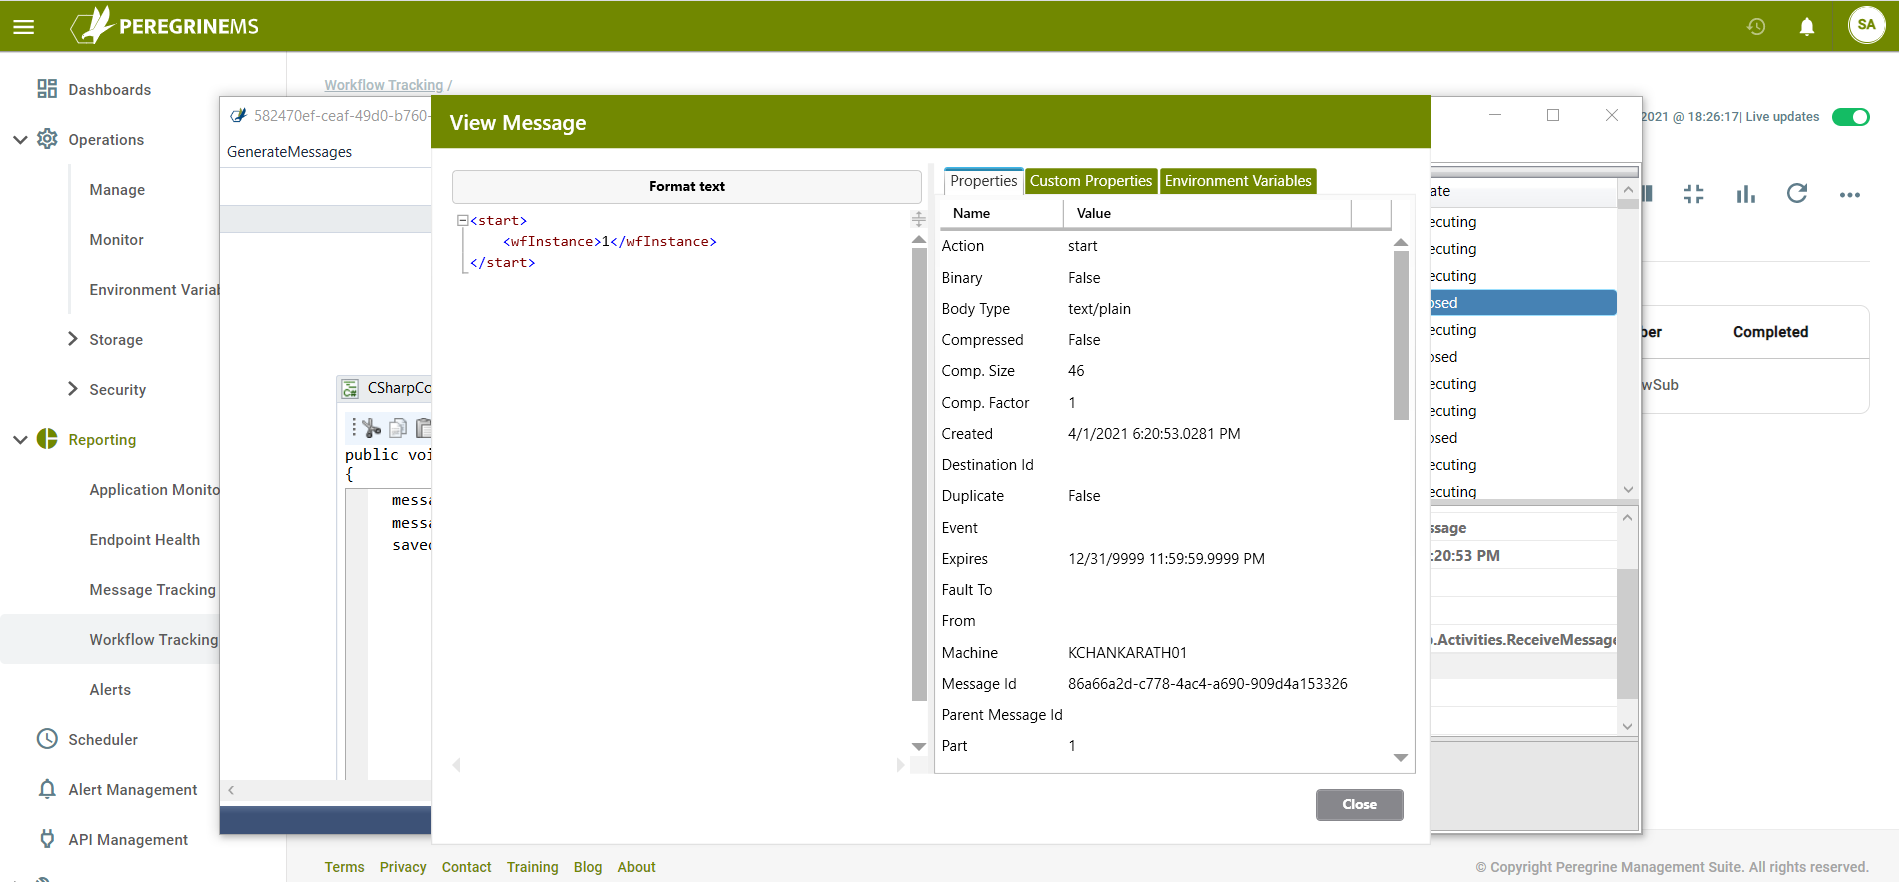
The following workflow message viewer shows the actual message text on the left-hand pane and the Neuron ESB message properties, custom properties and Environment Variables in different tabs.
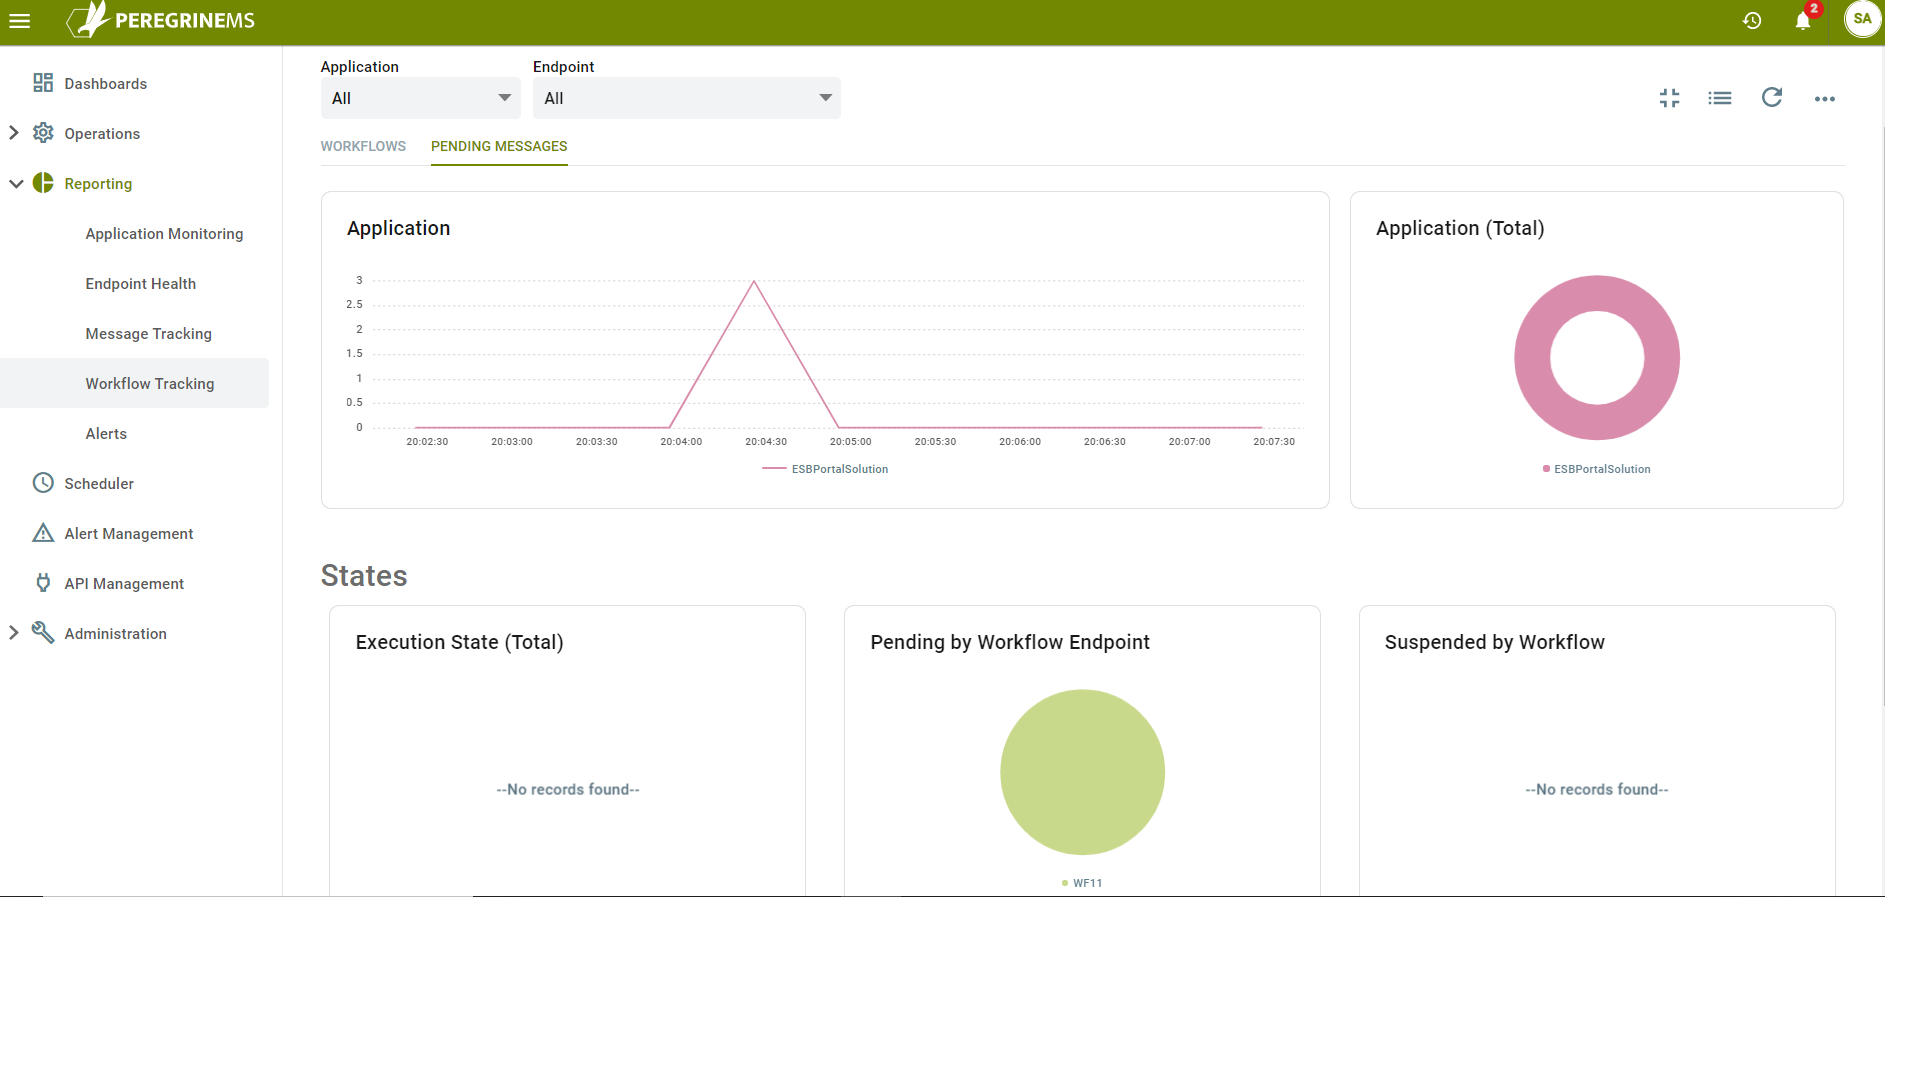
The following page shows pending messages by Application in line chart on a sliding time scale and pie chart. It also shows breakdown of all workflows by Execution State, Pending messages by workflow endpoints and Suspended instances by Workflow in different pie charts in the second row. Pending messages will show when there is a singleton type of workflow that is processing messages one at a time and each message processing cycle takes longer than the rate at which messages come in.
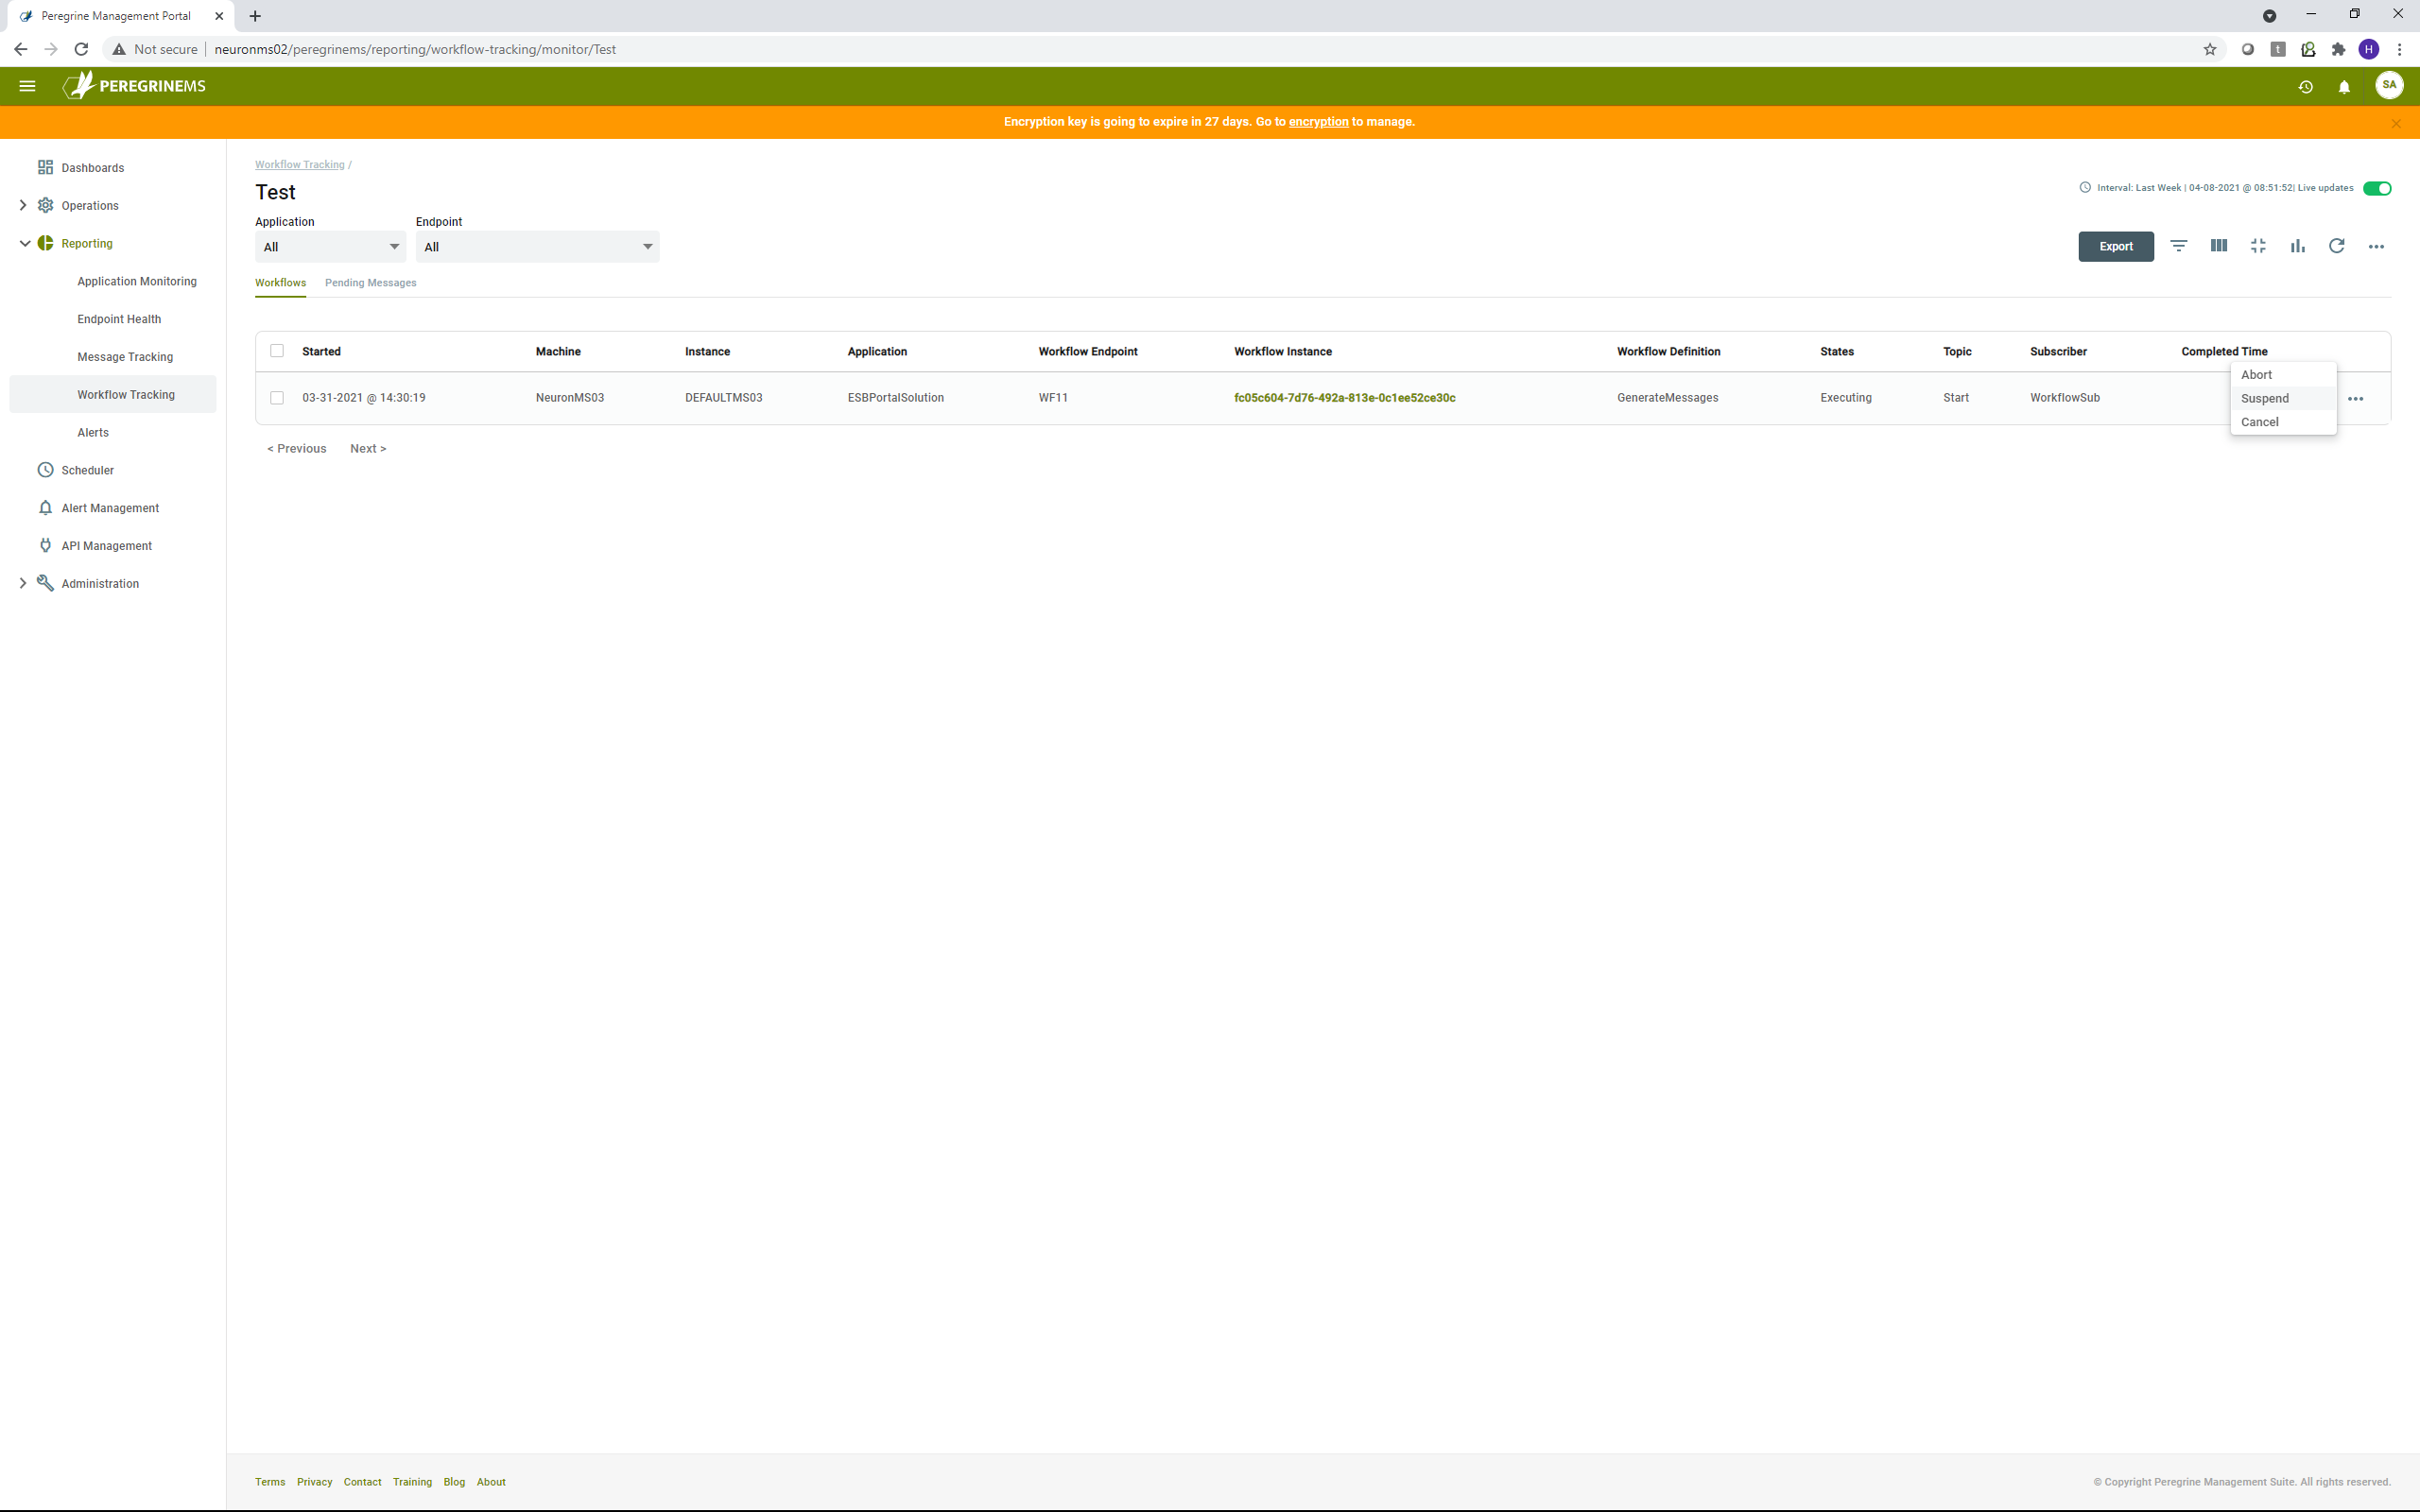
Workflow operations
Using the list view of workflows, you can also cancel, suspend or resume workflows depending upon their status. These options are available on the context menu for each record as shown below. You can select one or more workflows to apply the same command to all of them.
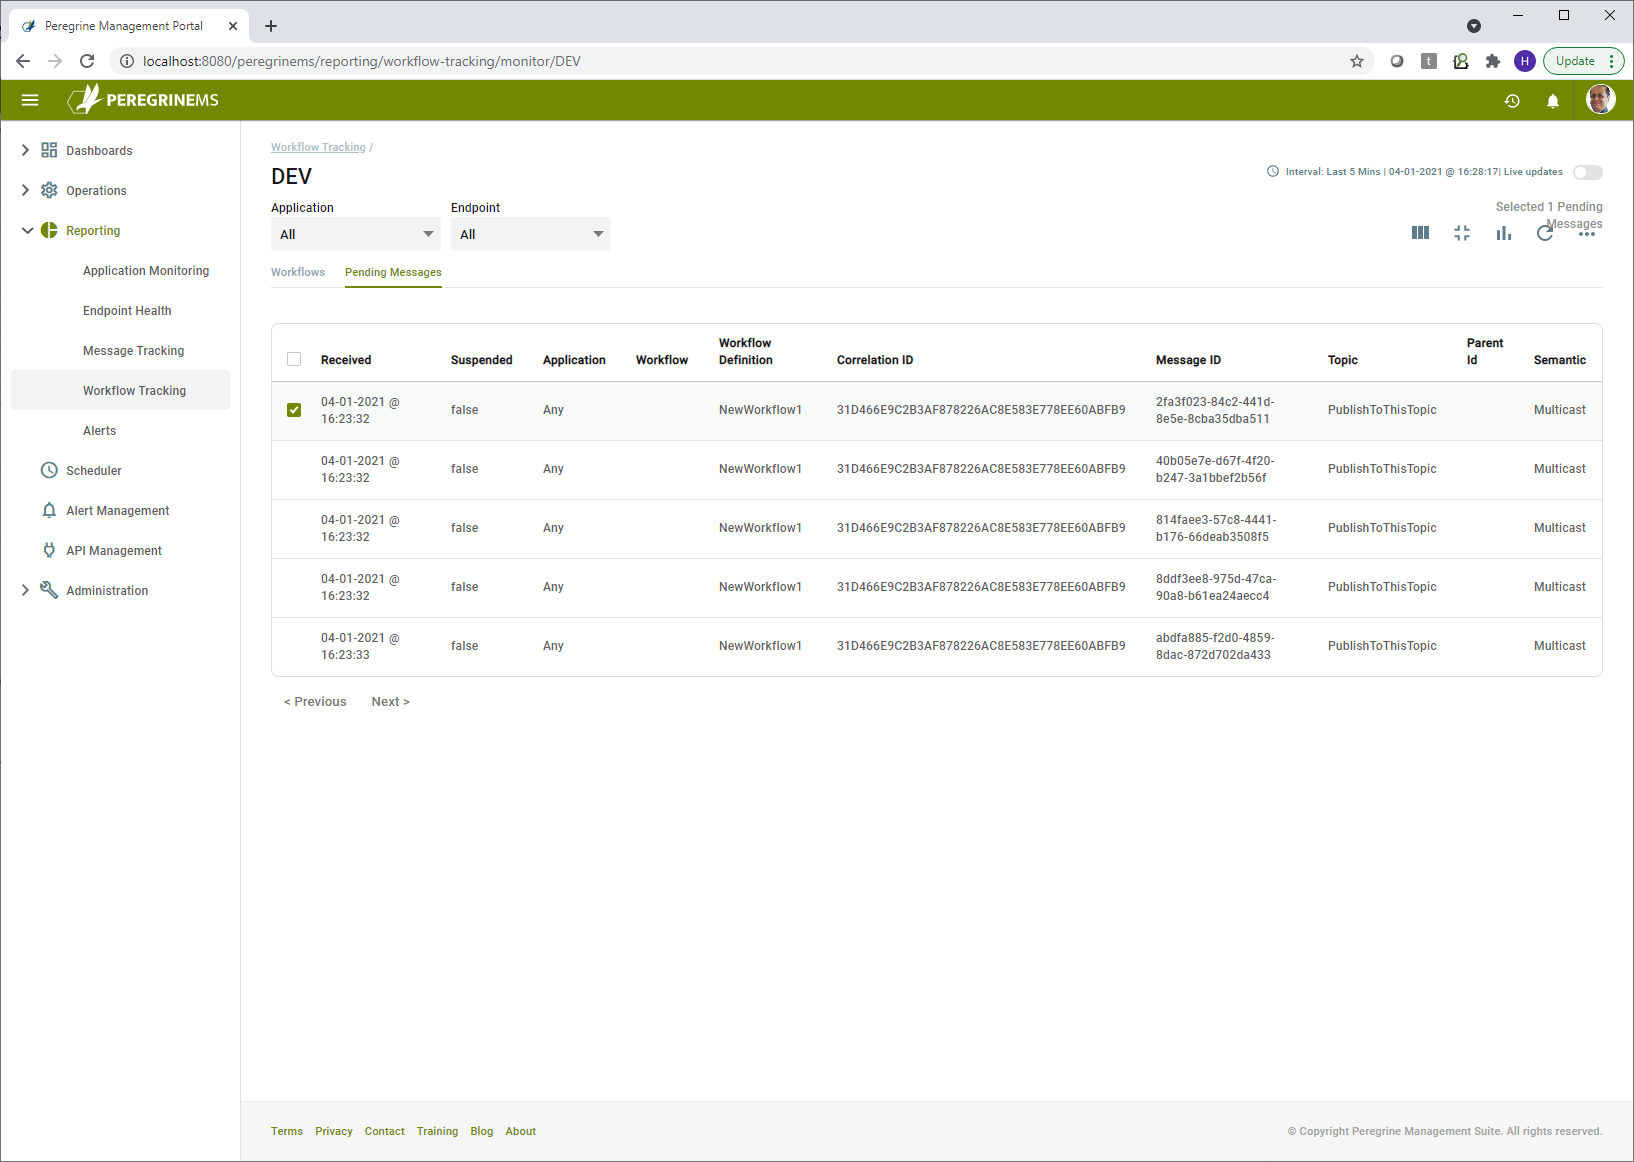
Pending Messages List View
This view shows the messages that are pending to be processed. Pending messages can occur in a correlated receive workflow where a single workflow instance is aggregating the messages with some type of process delay. This view shows the following columns.
Received – Date/time when the message was received by Neuron ESB
Suspended – Whether or not the pending message is suspended
Application – Name of the application that generated message
Workflow – Name of the workflow endpoint
Correlation ID – Same Unique ID assigned to all the correlated messages that share a value defined for the correlation set
Message ID – Distinct Unique ID assigned to each message
Topic – Name of the Topic on which the message was published
Parent ID – ID of the Parent Process if any that published the message
Semantic – Direction Semantic of the message (e.g. Request/Multicast or Datagram)
Alerts/Notifications
Alert rules can be setup which search logs for the specified condition and send a notification if the condition exists. Users may subscribe for one or more alert rules to receive notifications when alerts are raised. Alerts can be specified to occur only when the condition lasts for a certain duration. Consecutive alerts can be suppressed.
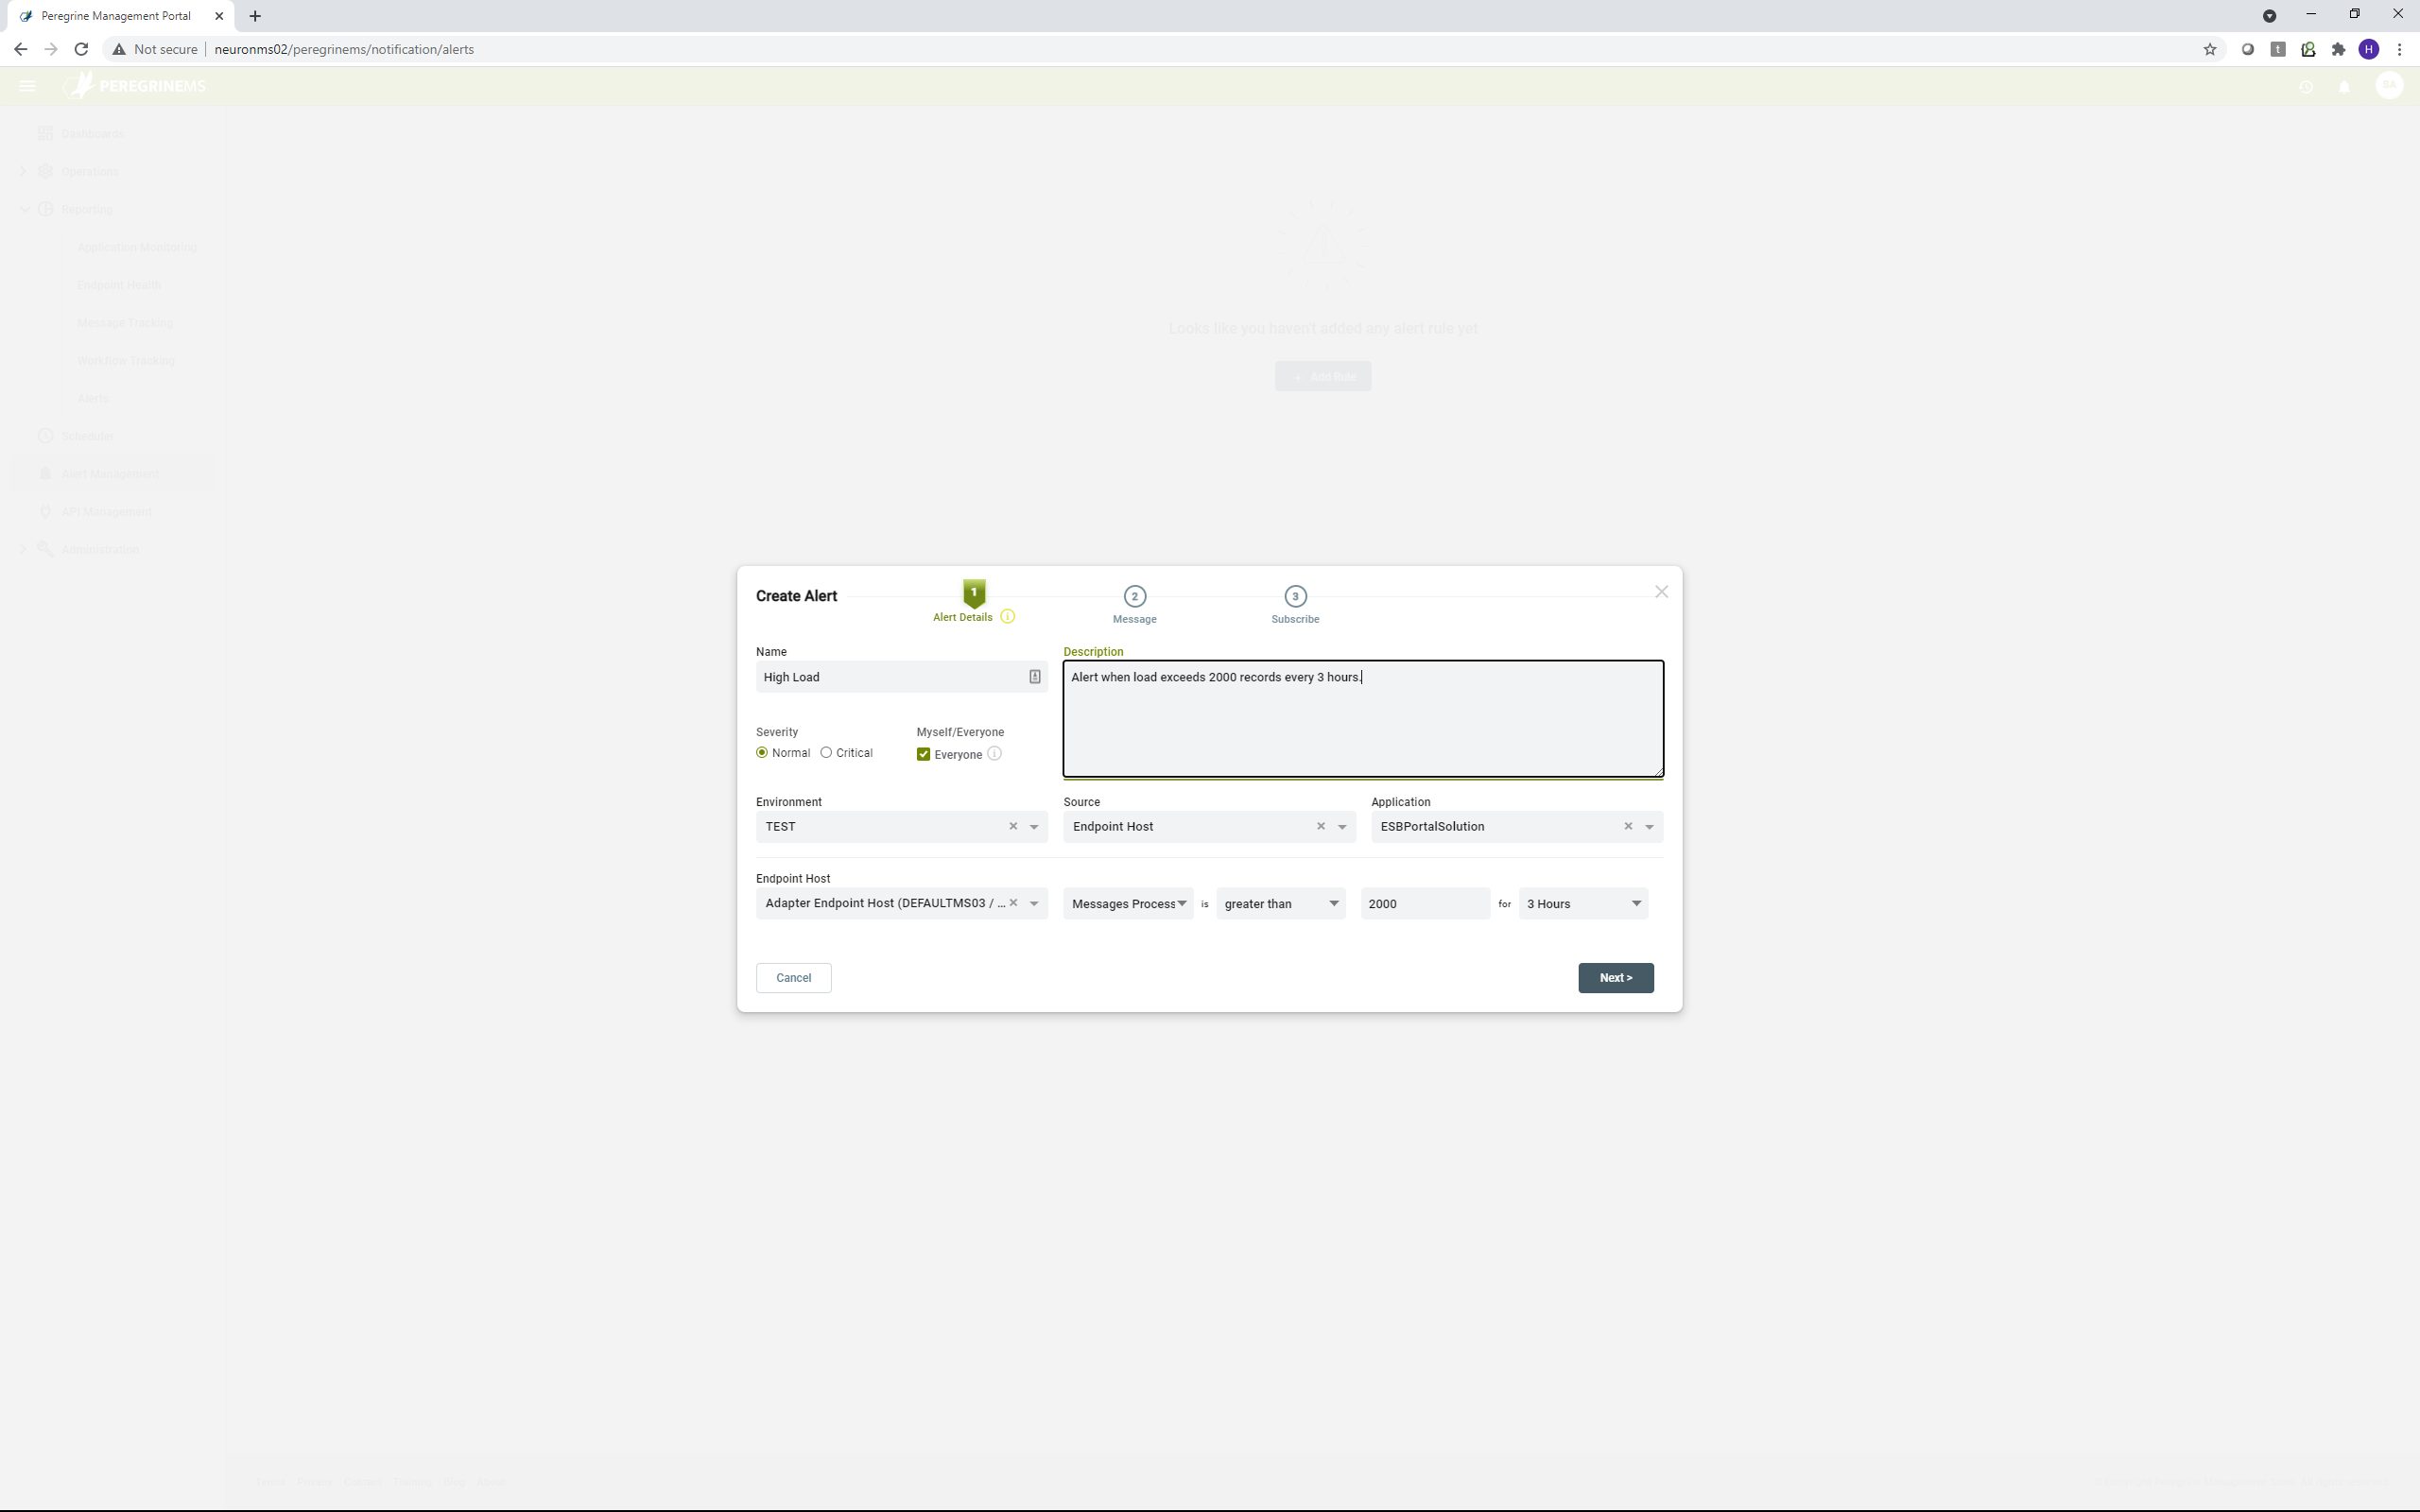
Setup Alerts
You can setup Alert by creating an alert rule with a step by step wizard as shown below. You can specify the environment, source, application and condition when creating the alert rule.
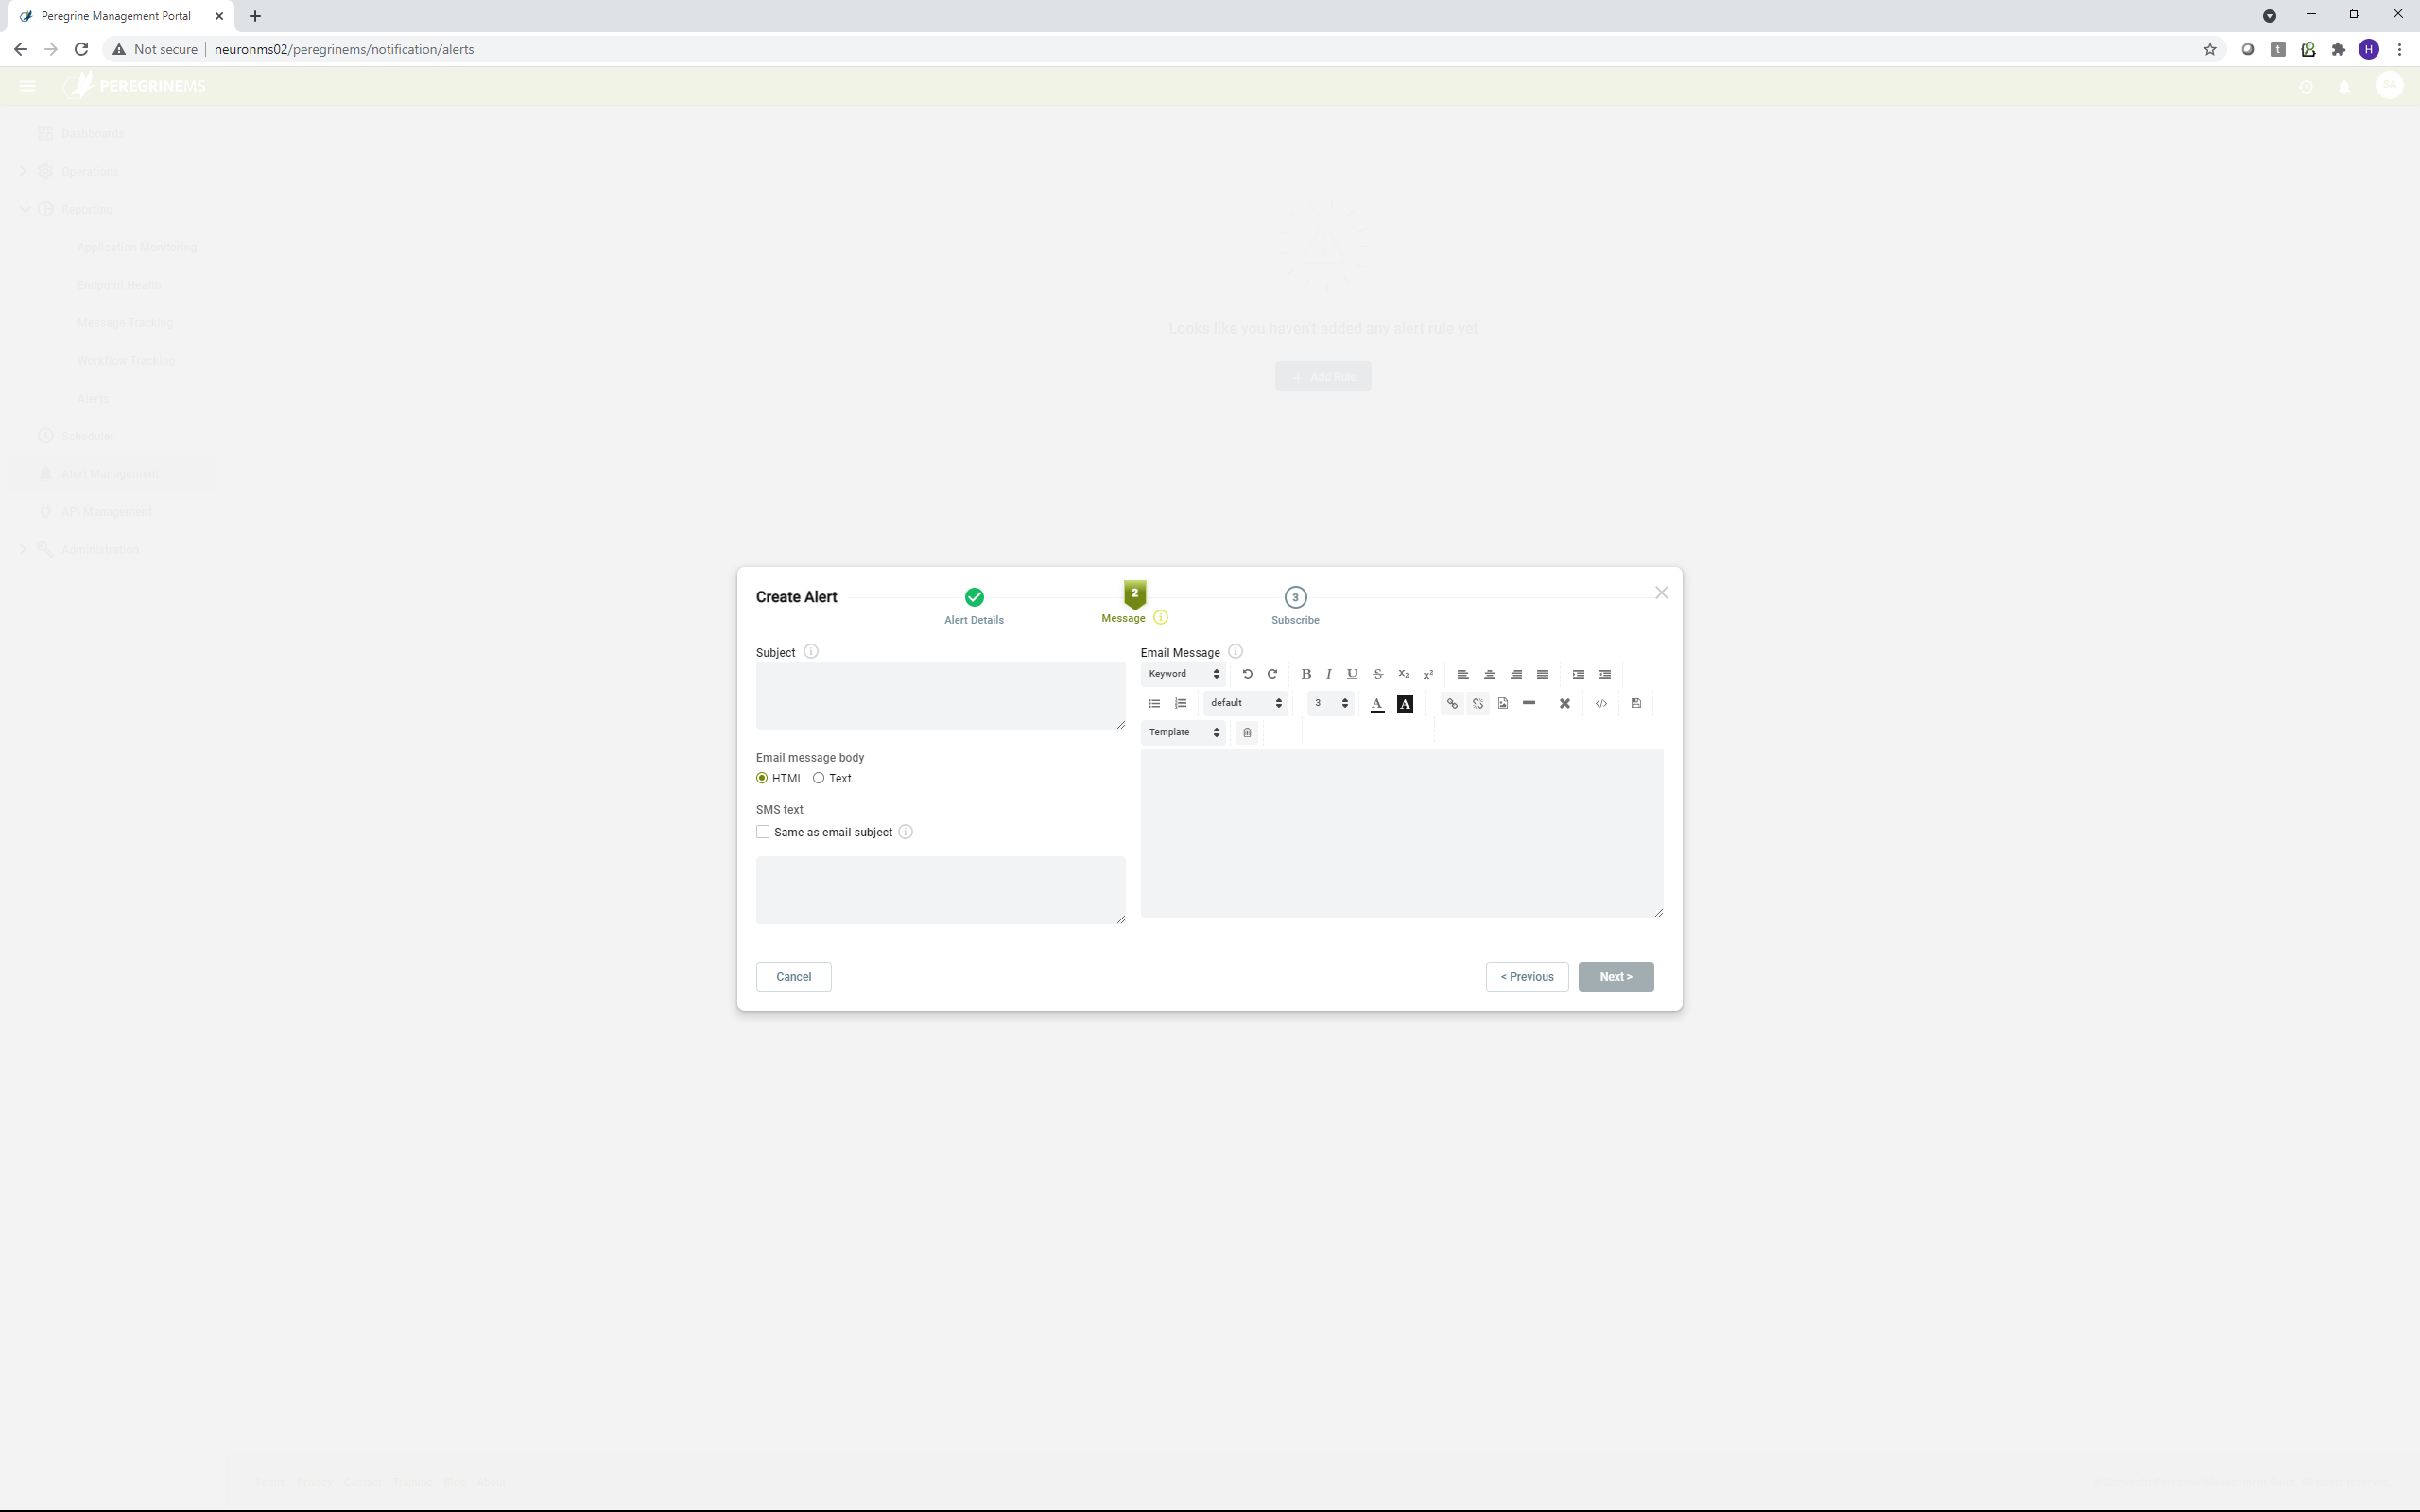
You can specify the message subject, text and message channel (email or text or both). You can specify certain built-in variables in the message body for runtime substitution.
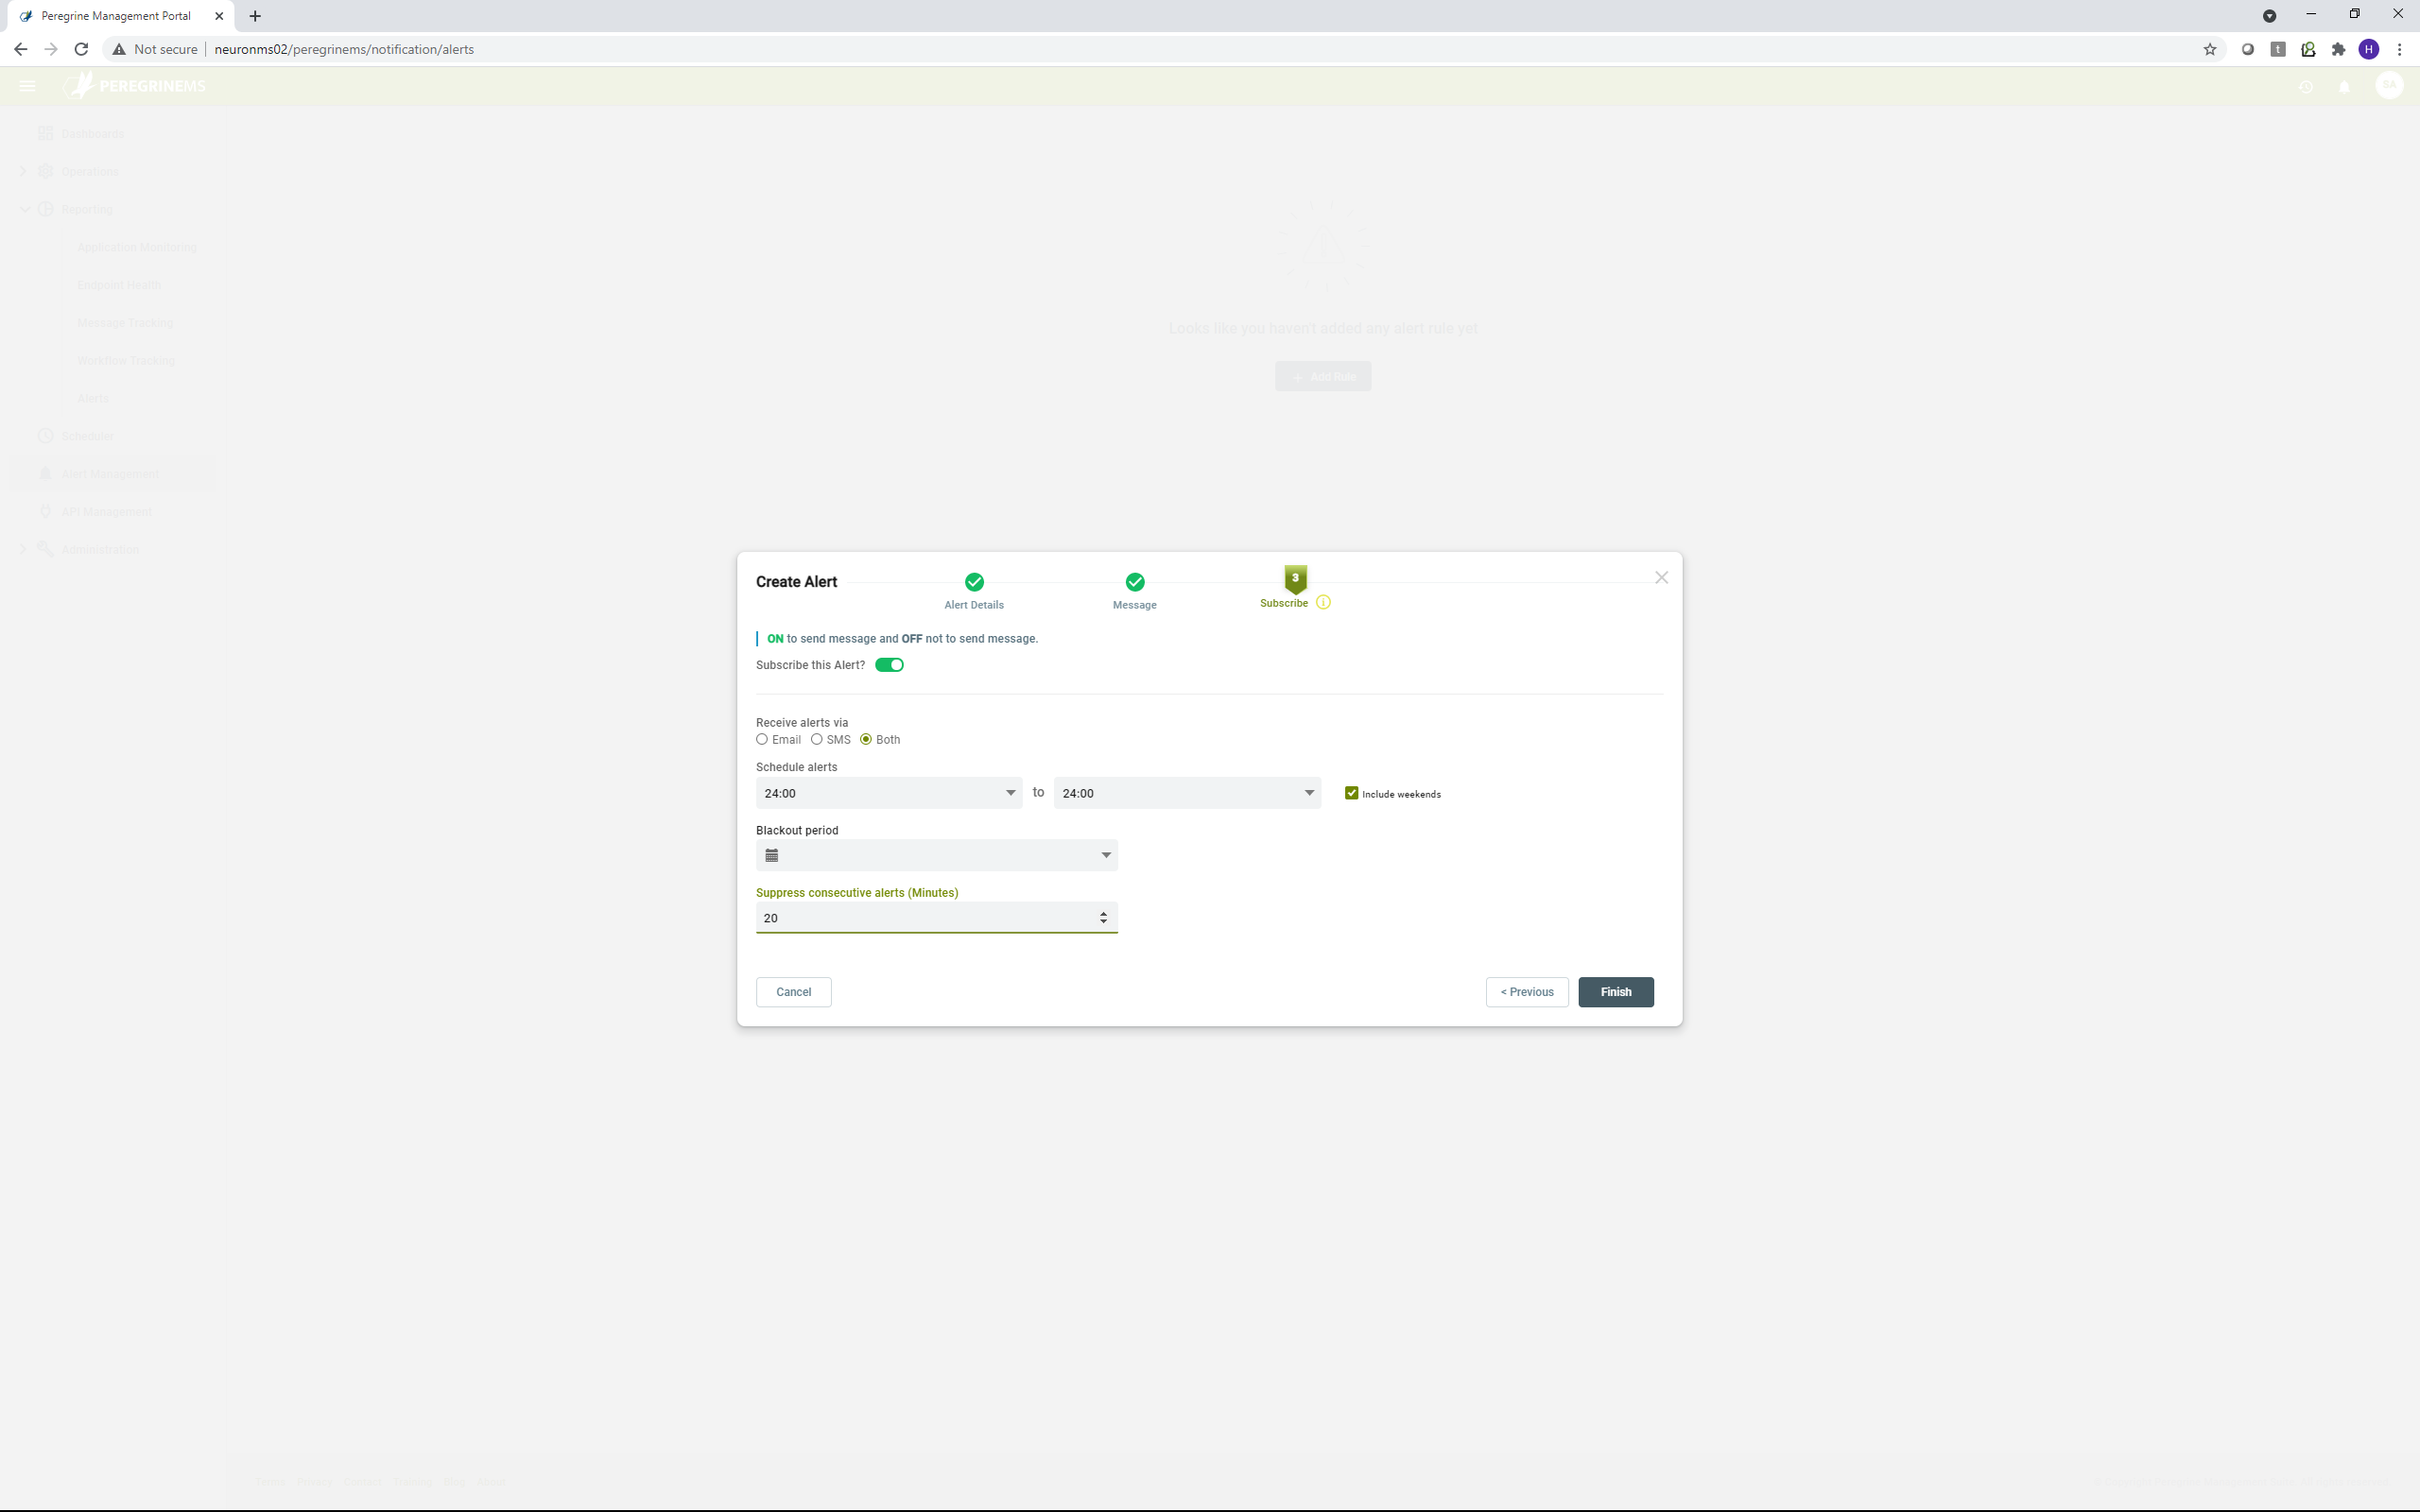
In the final step you can create a subscription with overrides for schedule, black-out periods and suppression of consecutive alerts.
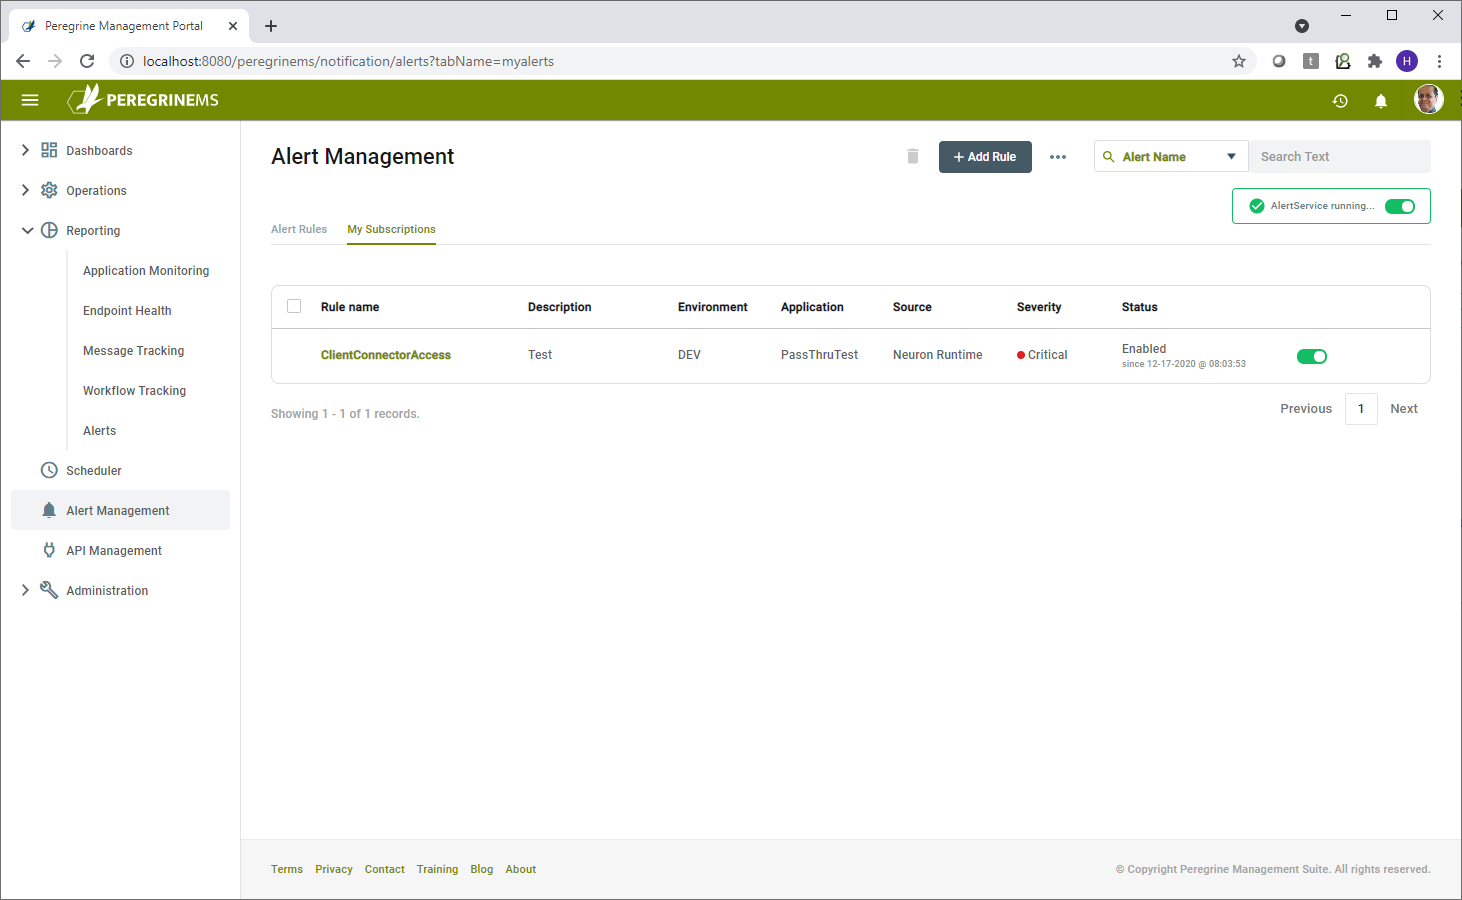
Manage Alerts and Subscriptions
You can subscribe or unsubscribe to one of more alerts using the subscriptions section of the Alert Management page.
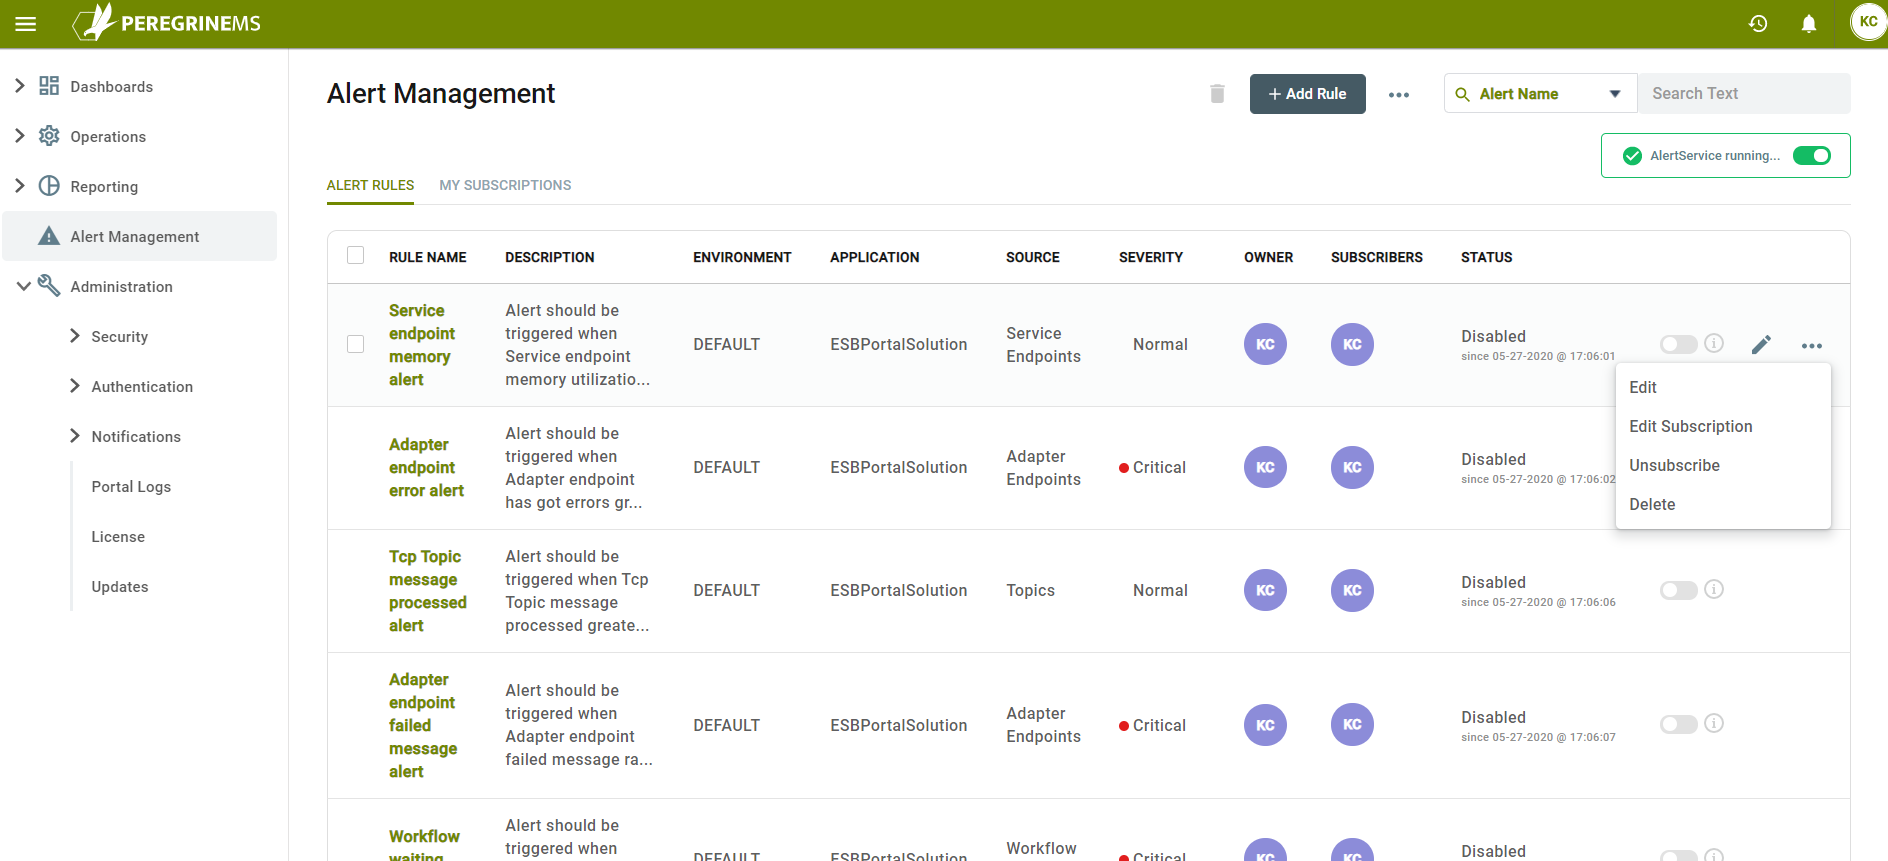
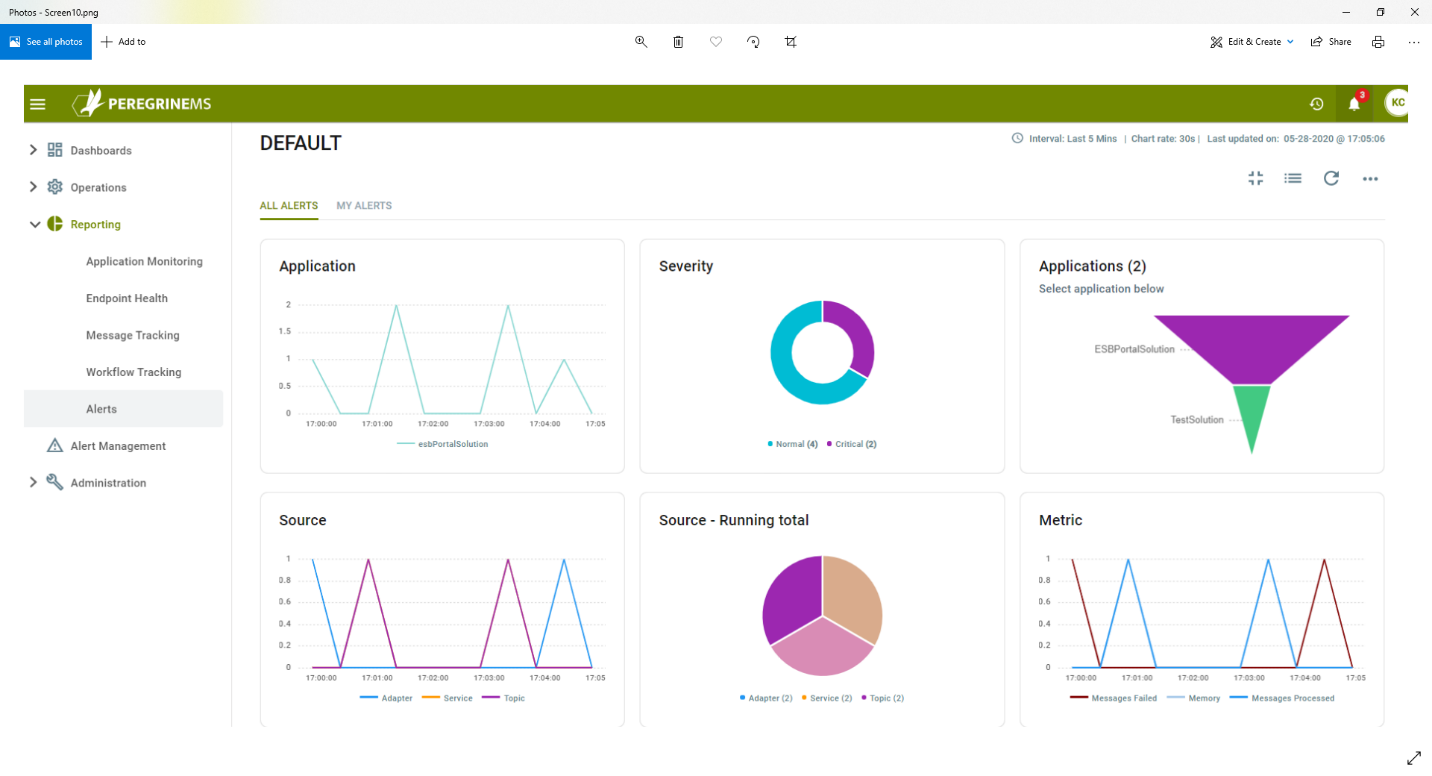
Monitor Alerts
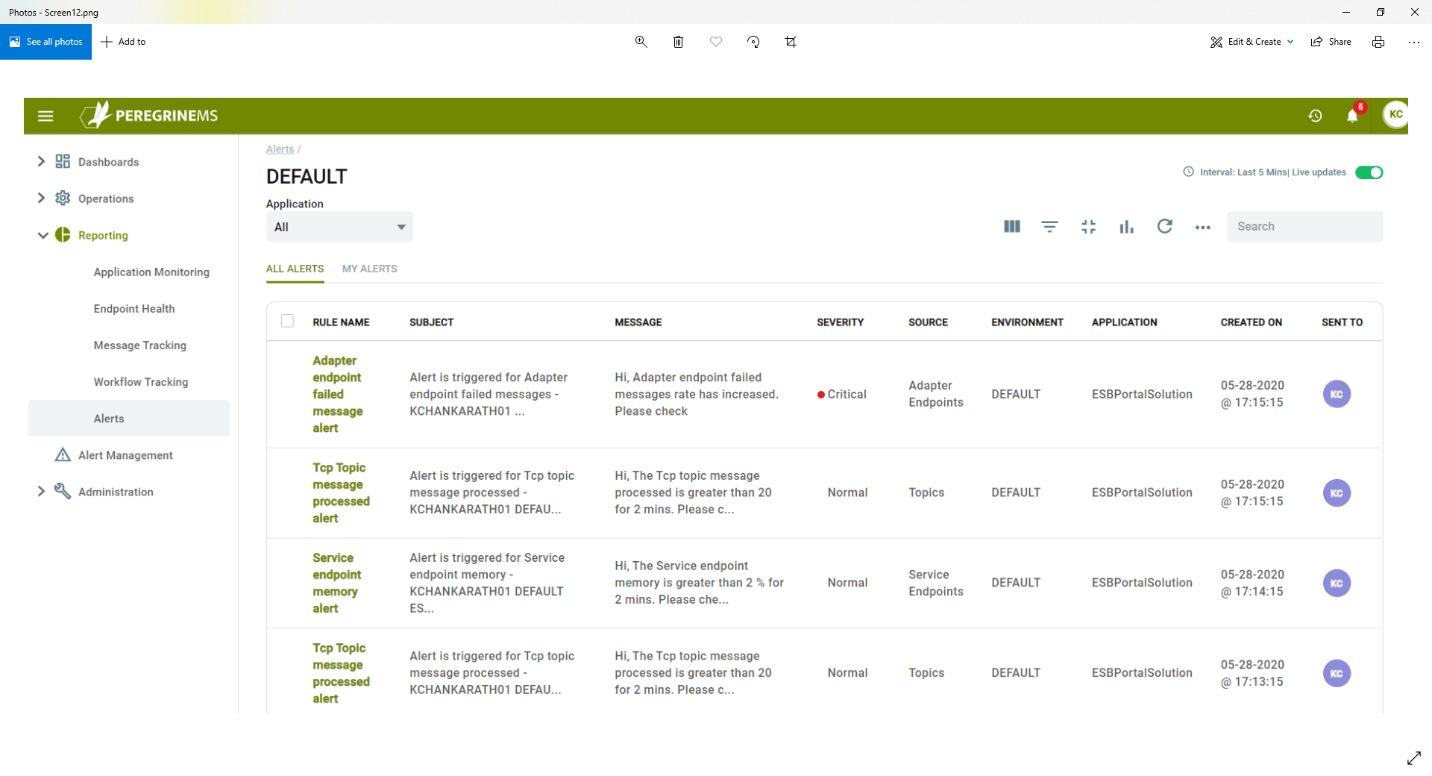
Alert monitoring dashboard shows the alerts in chart view. It shows Alerts grouped by application, source, severity and metrics for failed/processed messages. You may filter Alerts by application and your own subscription.
You can see alerts as a list view and you can add/remove columns or use search on the list to find a specific alert. Alert notifications will also appear as new alarms on the top navigation bar as shown below. They provide a quick view of Alerts from any page that you may be on when alert occurred.