Monitoring
Neuron ESB application integration platform emits many statistics and log entries that you can monitor using Peregrine Management Suite.
The Management Suite shows the logs for following types of entries. These entries are logged for every Neuron ESB server and Instance as well as every EPS service instance in the environment.
- Service Rate
- Machine Stats (CPU and Memory Usage)
- Service Rate (Number of requests per second, number of errors / warnings per second)
- Service Status (Health of Endpoints, Topics Service Connectors, (Started, Failed, Disabled)) etc.
- Log Entries (Errors, Warnings, Information, Verbose depending on Trace Level)
- Audit Messages and Failed Messages
- Scheduler History
- Workflow Instances
The Event Processor Service is responsible for pumping these entries to Elastic Search Indexes after collecting from RabbitMQ. You can view them in tabular or chart format using some of the pages described below. The Management Suite pages get ElasticSearch Index results and show them in the tabular or chart format.
Environment Monitoring
This page is for monitoring the overall status of servers in the environment. System administrators use this page. It shows the overall health of all instances and applications as well as machine stats (CPU and Memory) for all the machines.
You can view various information about the environment at a glance on the card view. You can also view the functioning of different server in the environment for Neuron ESB, EPS, ElasticSearch and RabbitMQ.
You can expand the card view to show more details. In the detailed view, you can view the various endpoints grouped by runtime instances or applications.
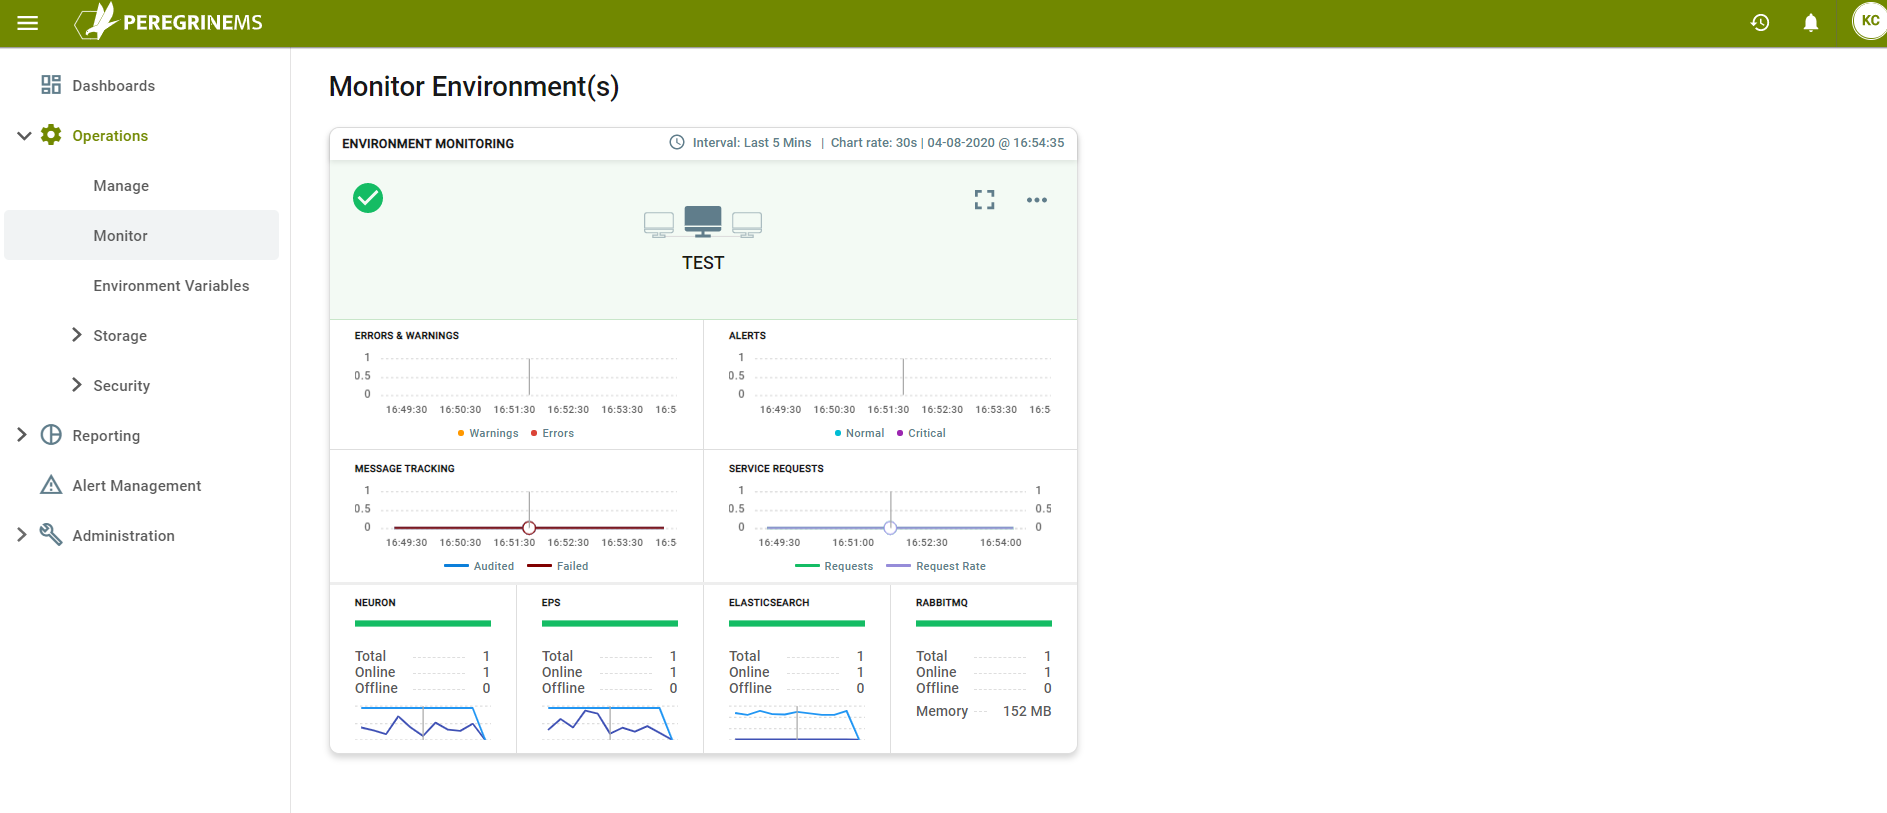
At the top of the card view, you can see the Environment Name. Below that you can see Errors and Warnings for the environment shown on a sliding time scale. Next to that any Alerts (See the Alerts section for documentation on how to create alerts) that are raised are shown on the same time scale.
You can see the number of Audited / Failed messages and Service Requests (Service Rate) in the second row of charts.
The third row of charts show summary view of Neuron, EPS, ElasticSearch and RabbitMQ machines with CPU and memory utilization summary on a sliding scale.
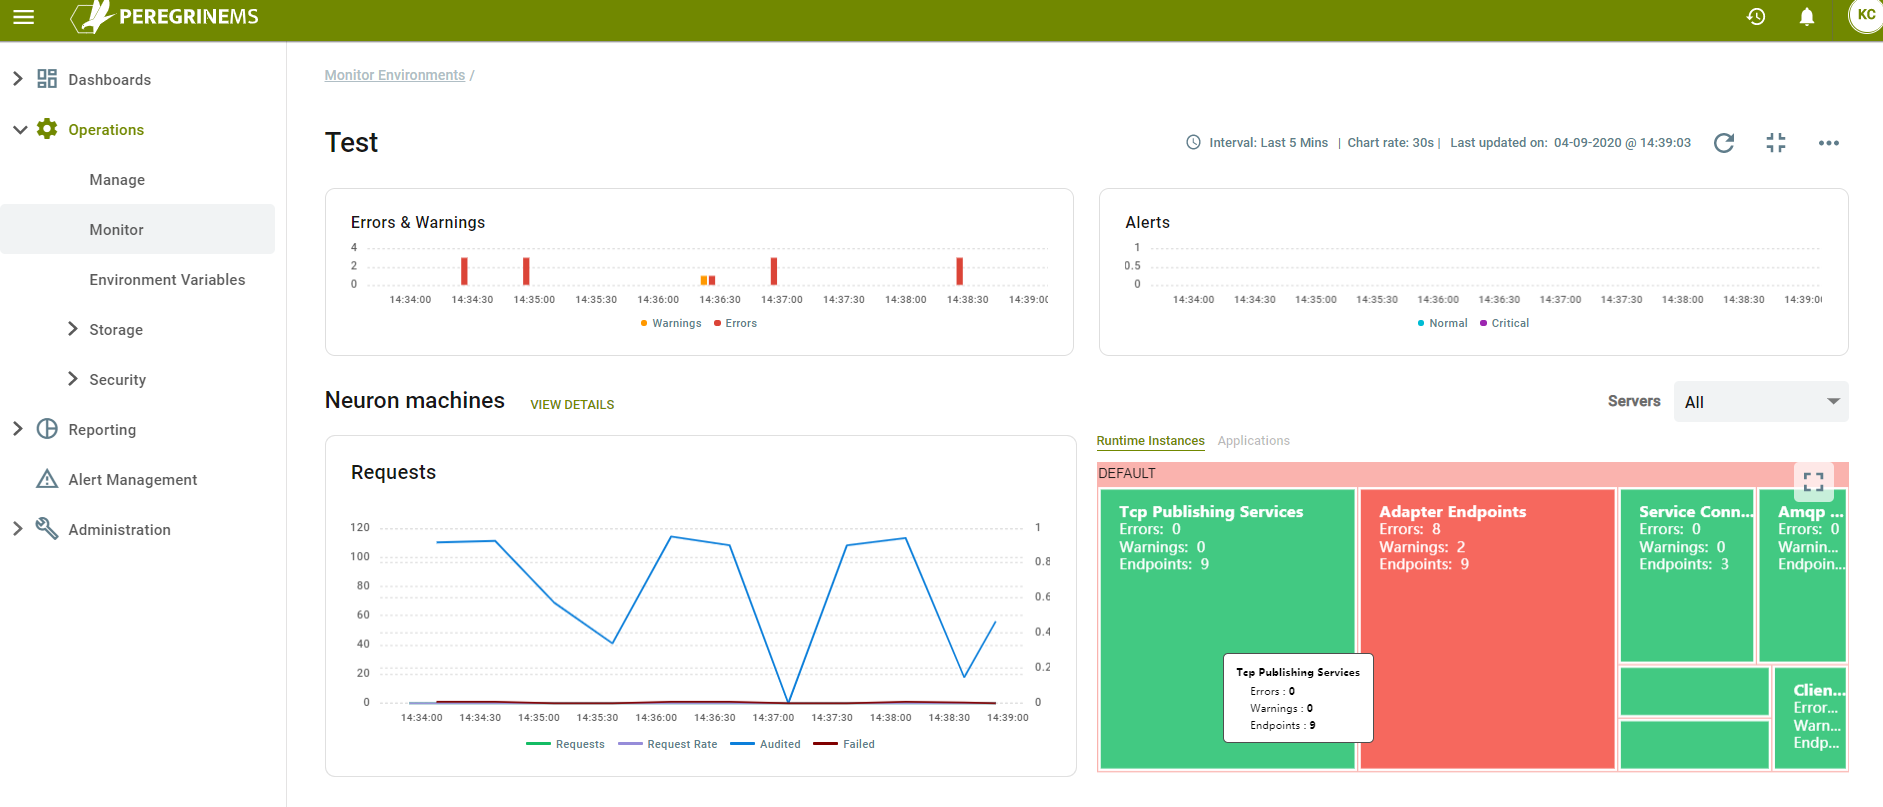
When you expand the card view for more details you can see the following screen.
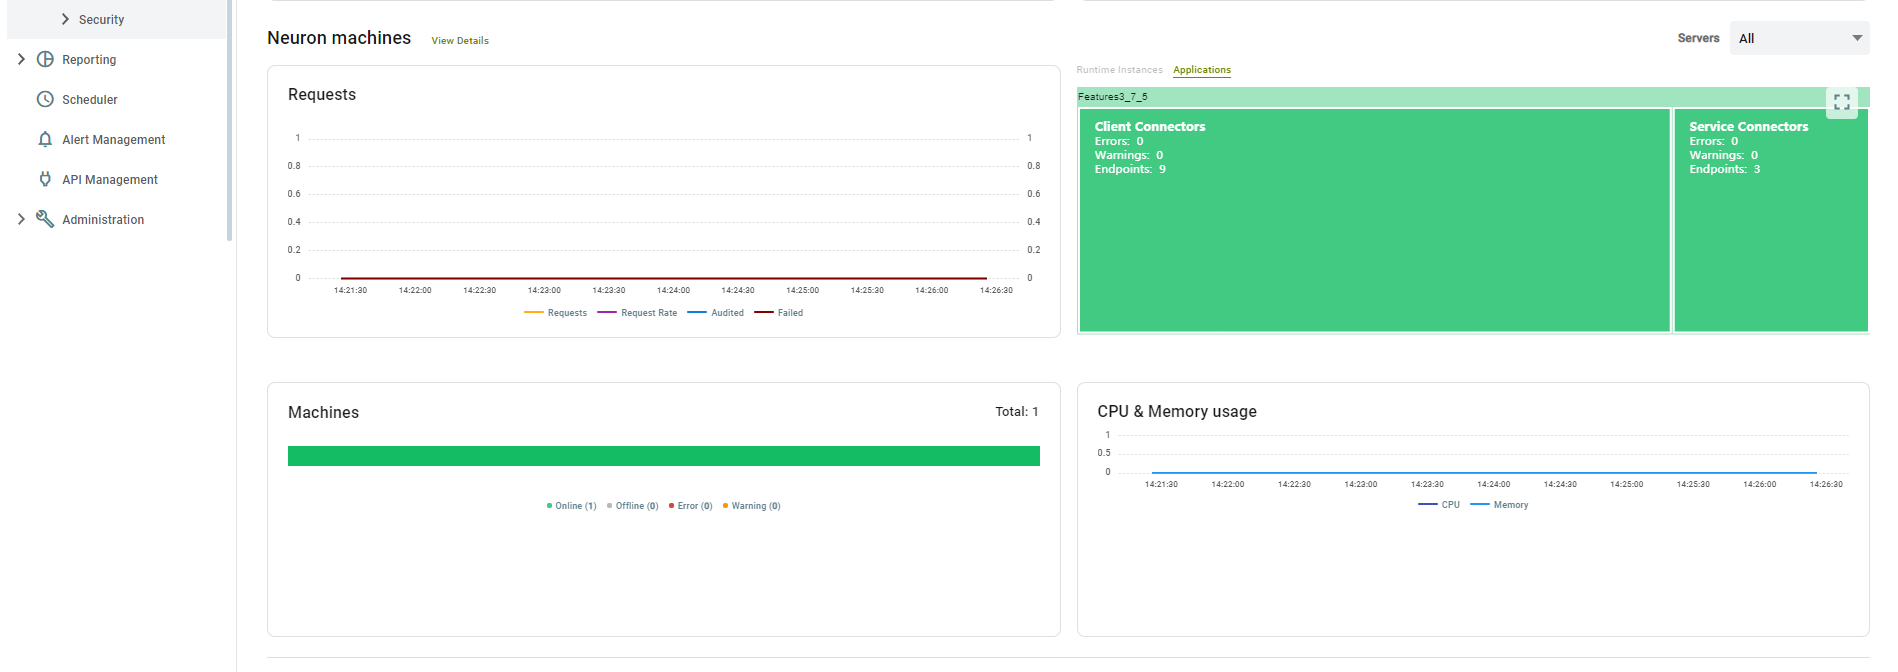
Same screen above showing Applications tab as selected.
As it is a bird’s eye view of everything, this page has a lot of information.
First row of charts shows Errors and Warnings on the left and Alerts on the right like the card view.
In the second row you can see the performance of Neuron Machines in terms of Requests, Request Rate, Audited and Failed Messages on a sliding time scale.
Next to that you can see the various artifacts in the solution that is running in the Neuron Instances in the environment. This is tabbed view and in the second tab Applications, you can see the same information but under the Applications that are currently running under the instances in the Neuron Environment.
Clicking view details brings up the detailed view of monitoring shown in the next section.
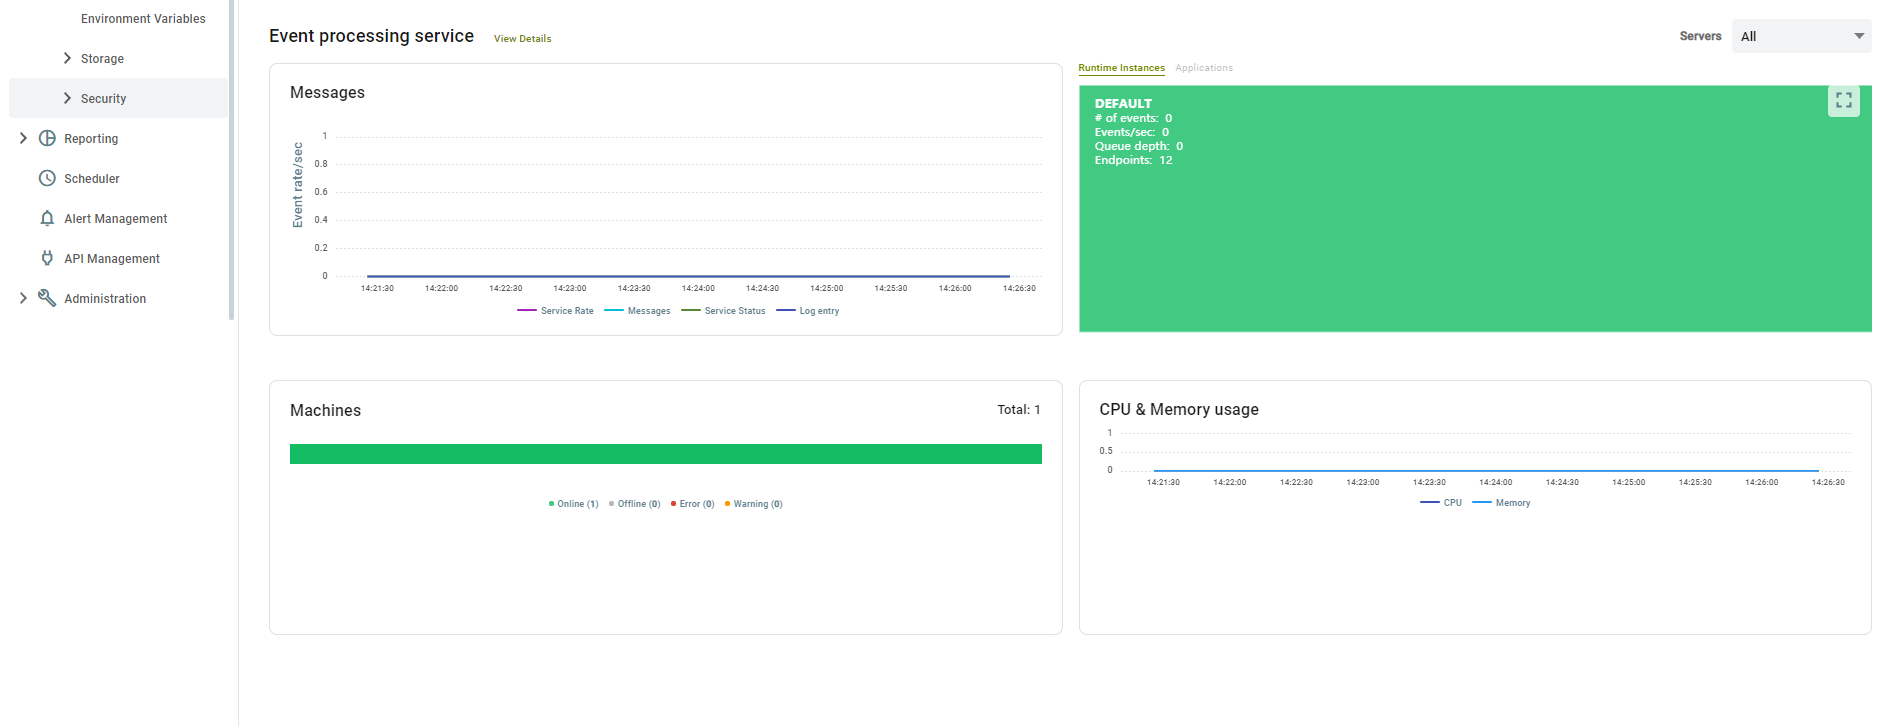
Last row of this screen shows the status of Event Processing service. On the left it shows the number of messages processed for Service Rate, Audit, Service status and log entry type of messages. On the right it shows the CPU and memory usage on the Neuron Event processor machine.
The drop-down boxes above the charts give you the ability to select the view for a specific Neuron Server or Event Processor Server in the environment.
View Details of Neuron Machine
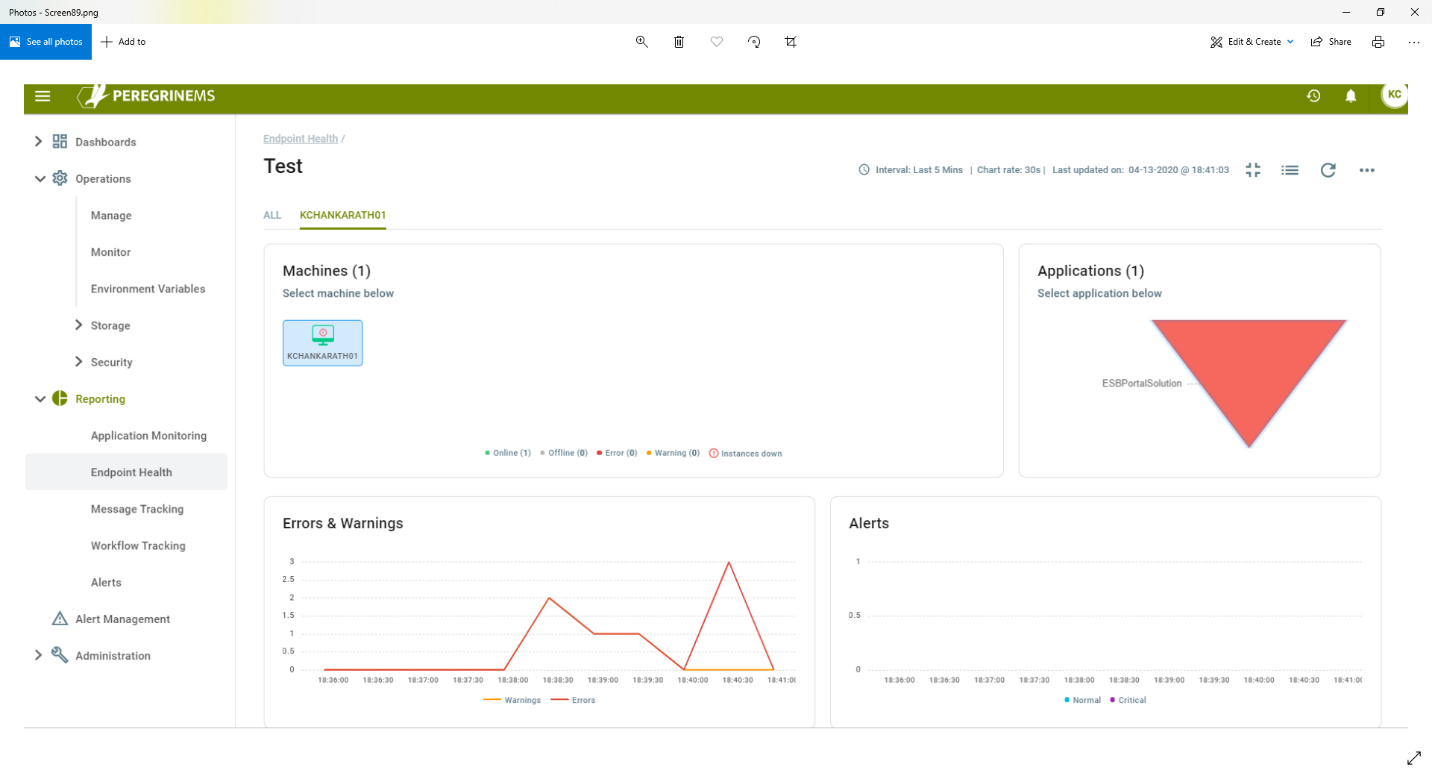
This view shows the Neuron ESB operations in much more detail. You can view all Neuron Machines in the environment or one machine at a time using the tabs at top of the screen.
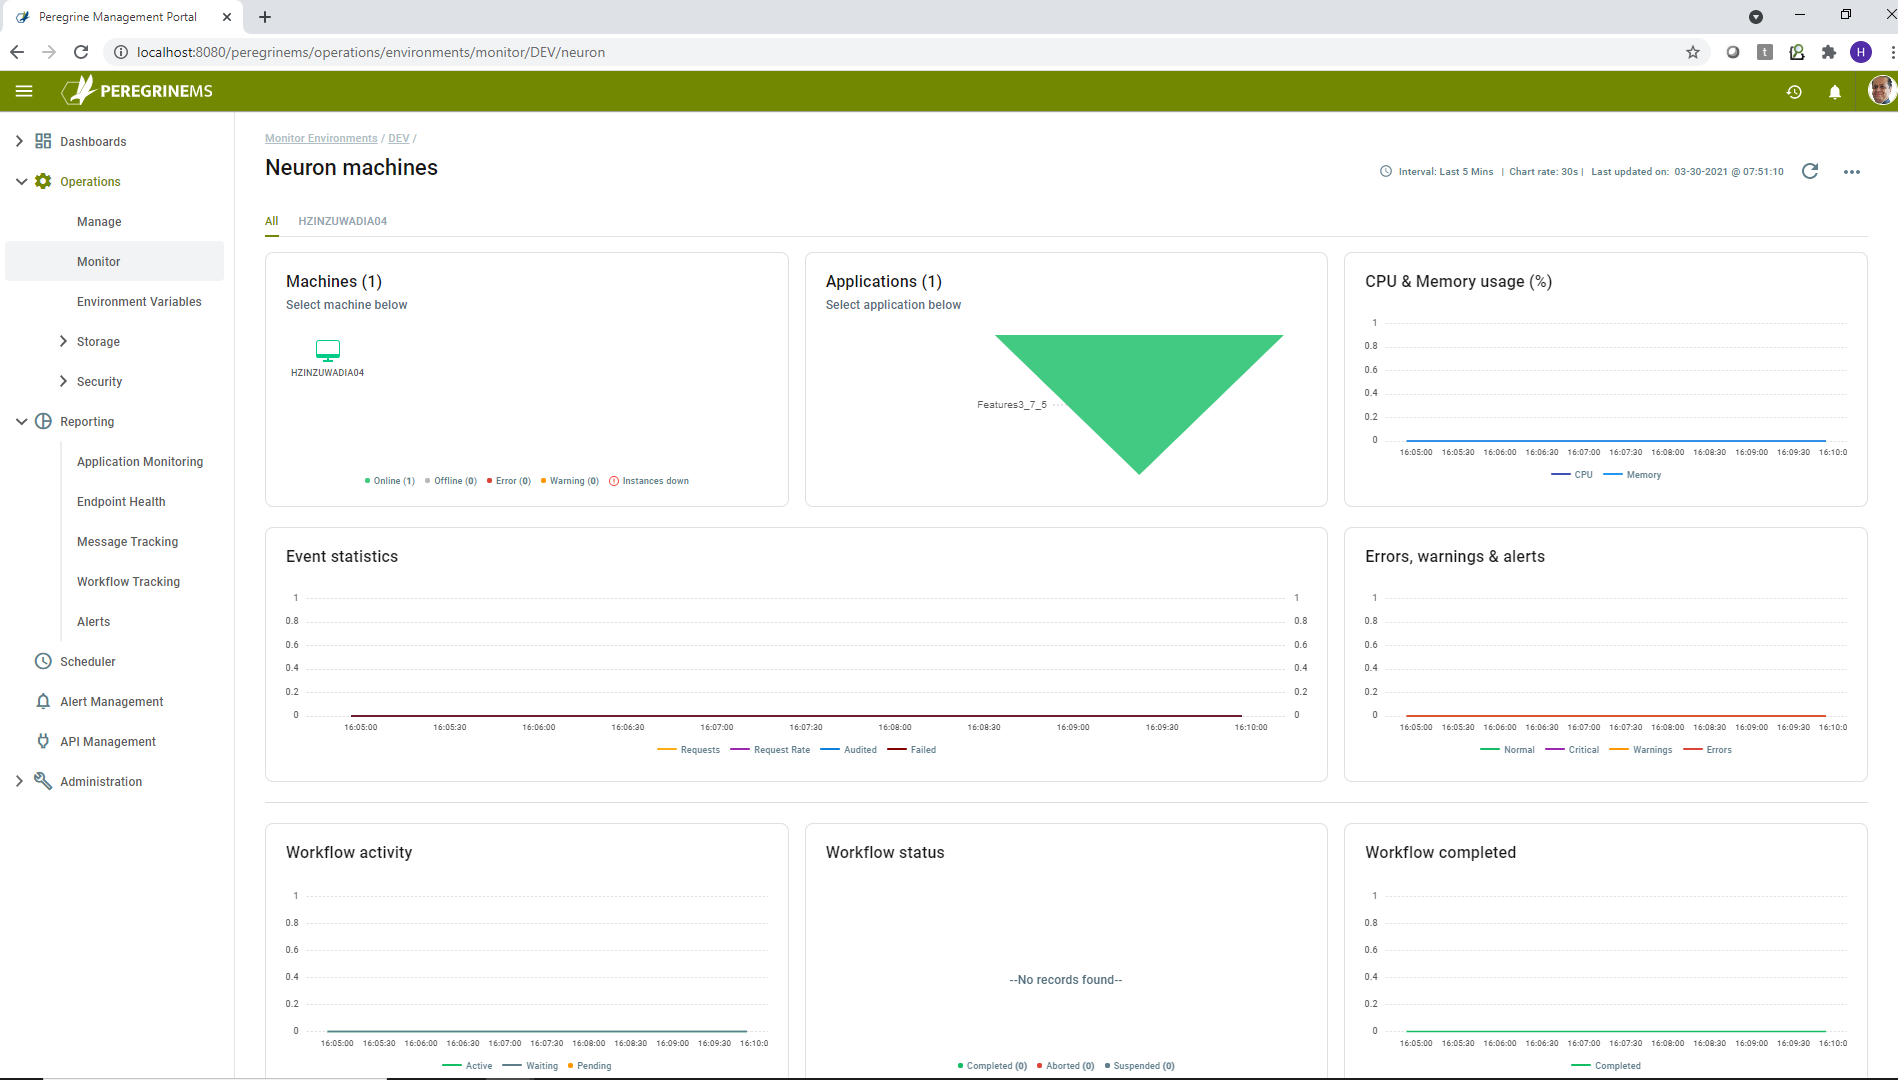
On this dashboard, you can see several widgets described below.
Machines – Shows all the machines in the environment along with their status as indicated in the legend below.
Applications – Shows all the applications running in the environment for each machine-instance combination. Selecting one of the applications launches the application monitoring view of that application. This view is described in the next section.
CPU & Memory Usage – Shows the CPU and memory usage of the selected Neuron machine on a sliding time scale.
Event Statistics – Shows on a sliding time scale, the Request, Request Rate, Audited and Failed messages for the selected machine/instance/application.
Errors, Warnings and Alerts – Shows the number of errors, warnings and alerts logged on a sliding time scale. The type of error or alert is indicated as per the legend colors shown below the chart.
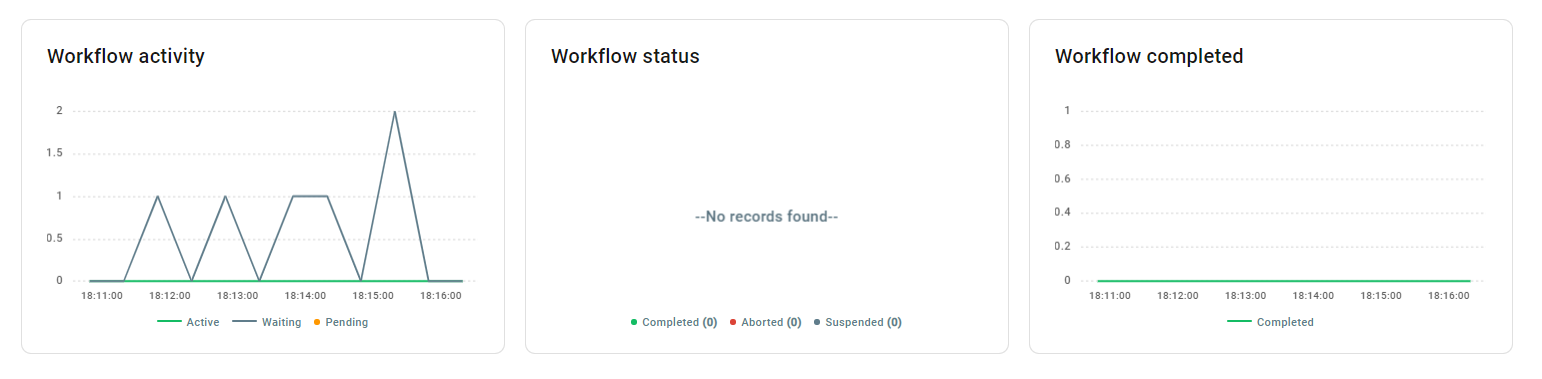
The next row shows three views of Workflows in the Neuron solution.
Workflow Activity – This view shows the number of workflows in active, waiting or pending state. Note that workflow can be waiting if it is based on a correlation. It can be pending if it based on a timer.
Workflow Status – This view shows a pie chart of workflows grouped by status. Values for the workflow status can be completed, aborted or suspended. Note that workflow can be suspended if it is waiting to retry or waiting on another event or state change. Workflow can be aborted if there is a non-recoverable error or is cancelled by user.
Workflow completed – This view shows number of workflows completed on a sliding time scale.
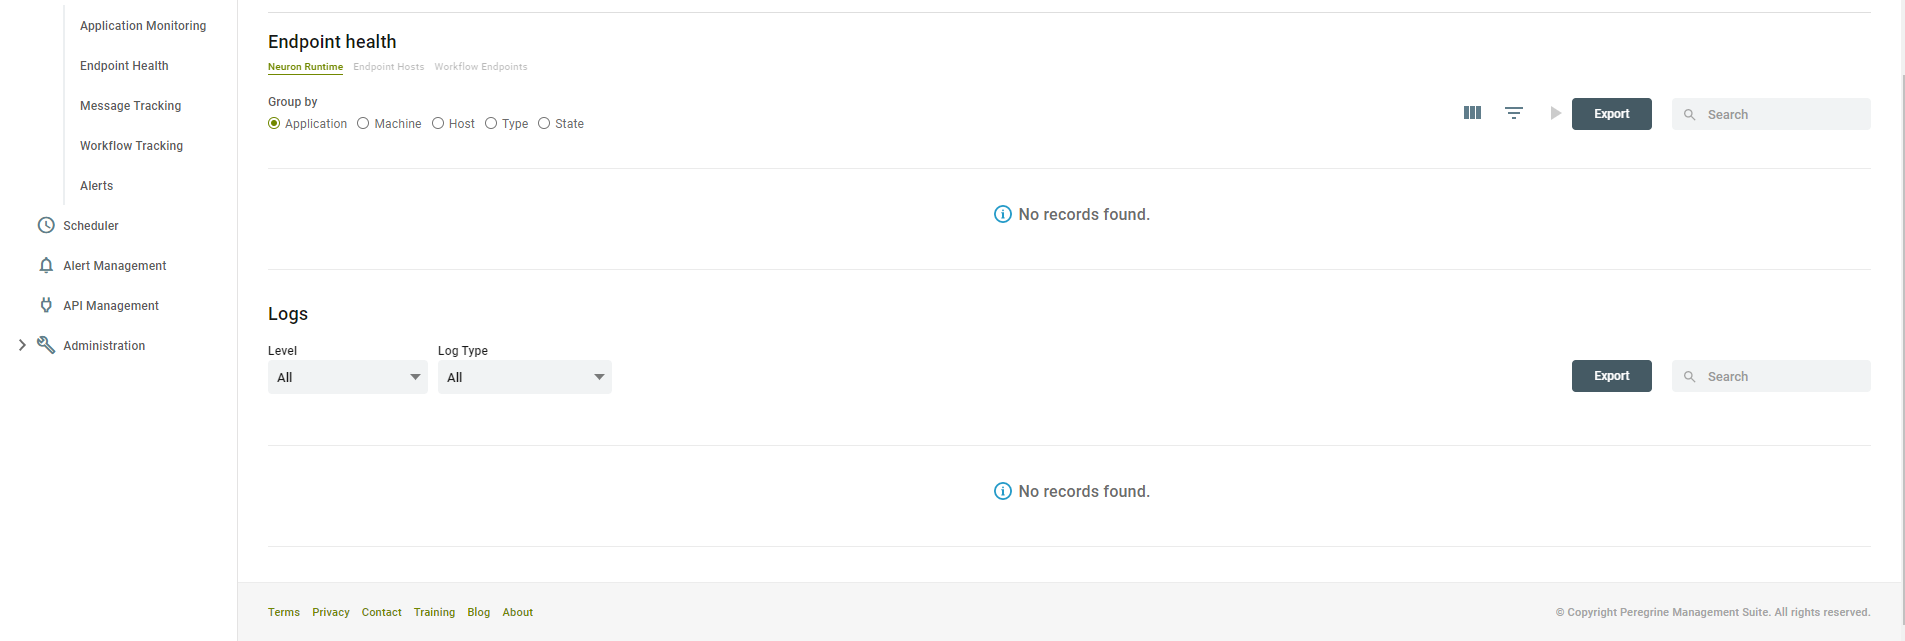
Endpoint Health – This dashboard part shows the endpoints in three categories, ESB Service, Endpoint Hosts and Workflow Endpoints based on the tab selected in this section. The list of Endpoints can be further grouped by Application, Machine, Endpoint Host Name, Type (Client connector, Topic, Service Connector), State (Enabled, Disabled, Started, Stopped, Failed etc.). You can learn more about Endpoint Health in the section dedicated to Endpoint Health Monitoring under Application Monitoring chapter.
Logs – This dashboard part shows the log entries generated by the Neuron Instances in a tabular form. You can filter by log level and log type.
Both Endpoint Health and Logs can be exported using the Export button provided in the top right-hand corner of the respective sections.
View details of EPS Machines
When you select view details under the expanded view of Environment monitoring, you get the following screen.
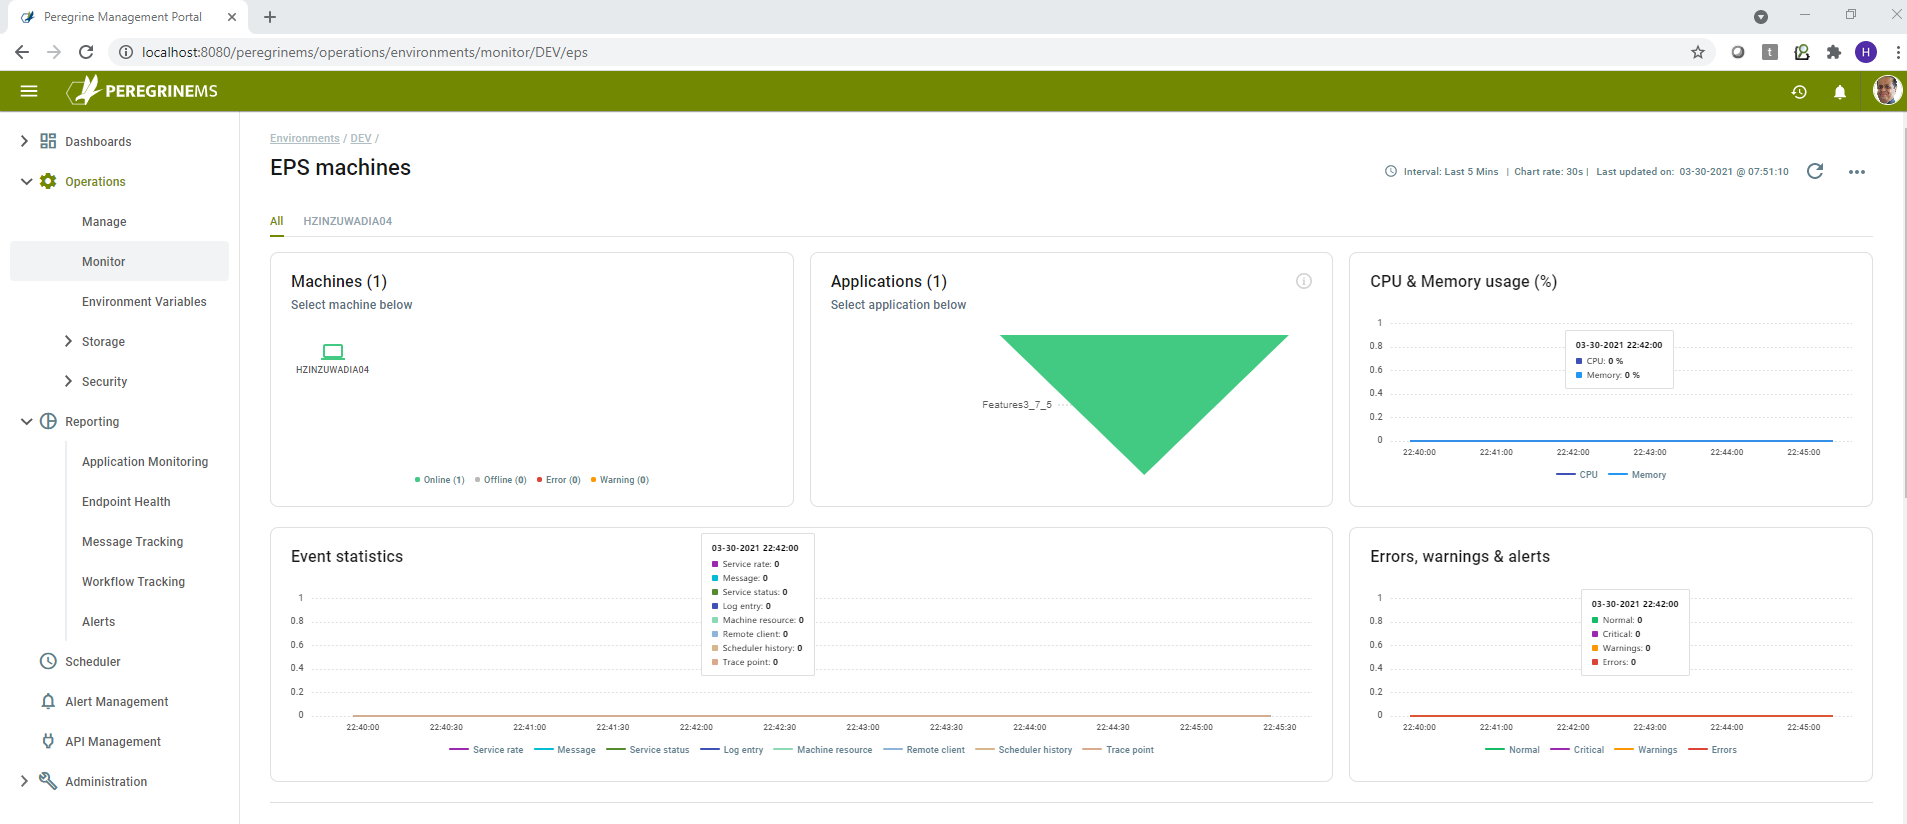
The above dashboard for EPS has many parts as listed below.
Machines – Shows all the EPS machines configured in the selected environment
Applications – Shows all the applications running on Machines/Instances in the selected environment
CPU & Memory Usage (%) – Shows the CPU and Memory usage in percentage used over a sliding time scale for the selected EPS machine
Event Statistics – Displays counts of various Elastic Search indexes over a sliding time scale.
Errors, warnings and alerts – Displays summary of Errors, Warnings and Alerts created over a sliding time scale.
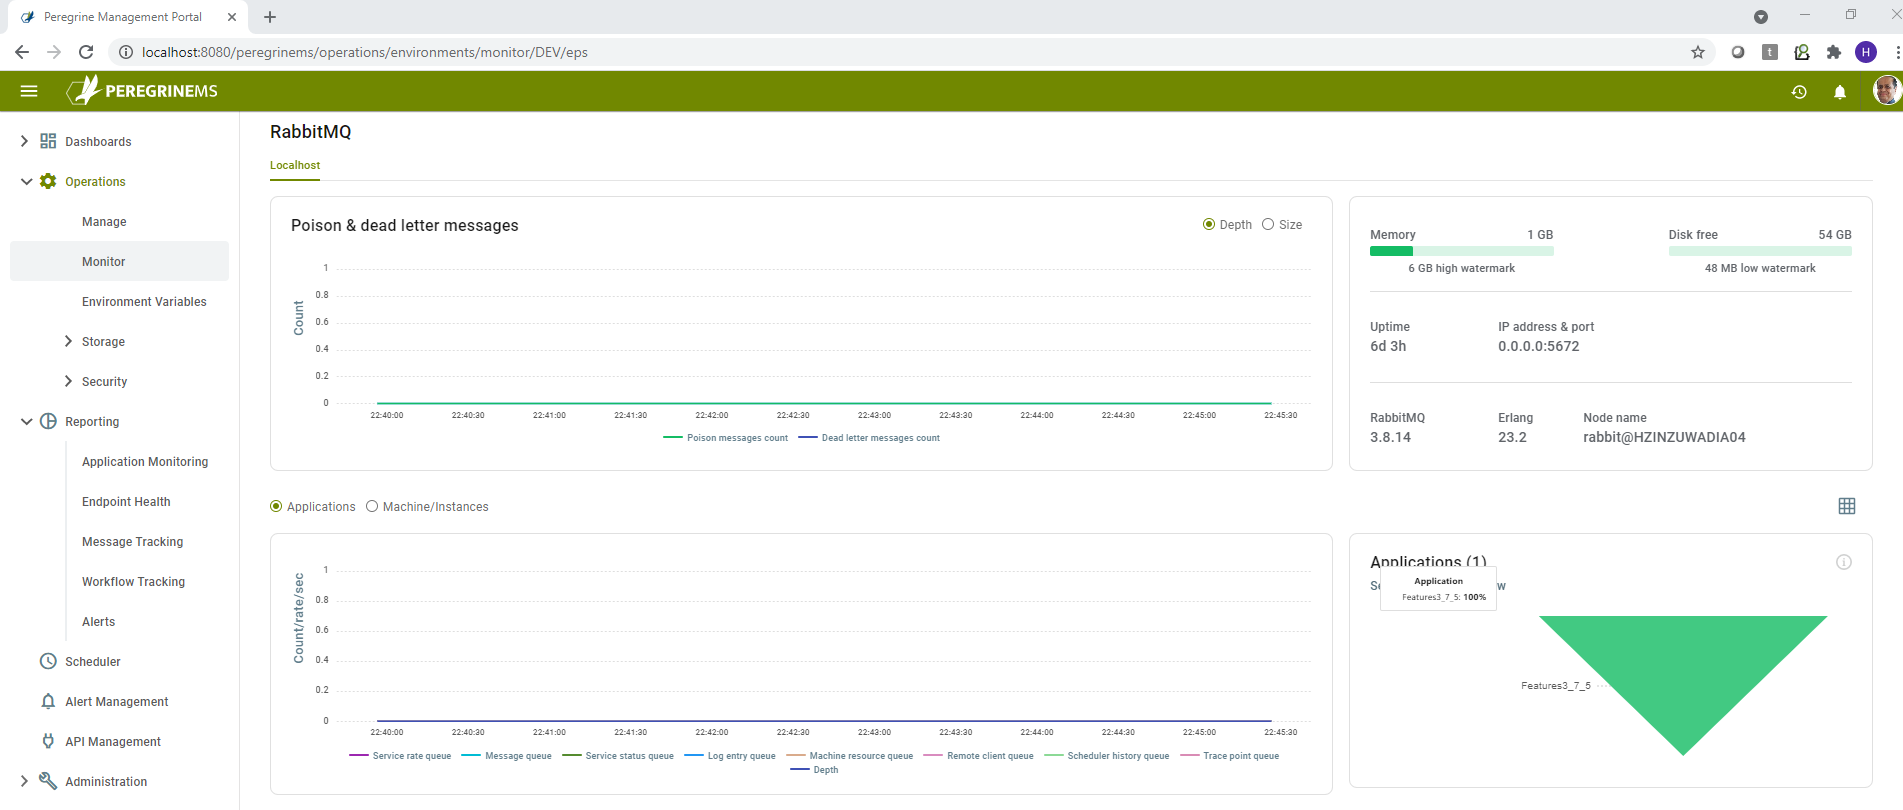
RabbitMQ
Poison and Dead letter messages (by depth and size) – Shows counts or total size of Poison and dead letter messages over a sliding time scale.
Statistics – Shows summary of disk free space, memory, up time, IP address & port, Version of RabbitMQ/Erlang and node name.
Counts/Rate/Sec (by Application and by Machine/Instance) – Shows the message counts and rate per second for various types of Event processor entries that are queued by Neuron ESB instances to be consumed by the Event Processor Service.
Applications – Shows the list of Applications being served by the EPS machines in the current environment. Selecting an application filters the whole dashboard for the selected application.
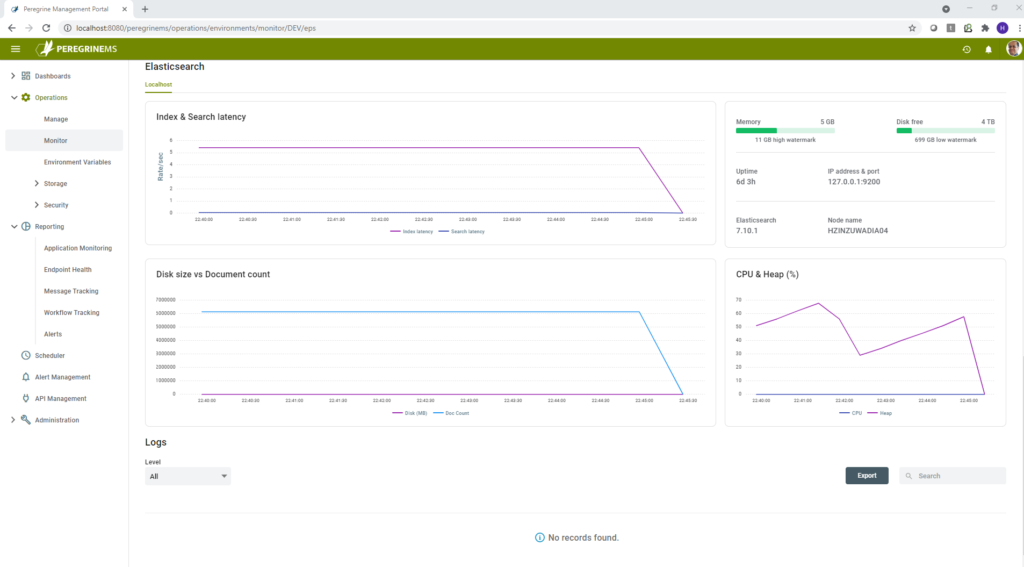
ElasticSearch
Index & Search latency – Displays the Index and Search latency (measured in how many documents indexed/searched per second (higher rate indicates lower latency) for each of the indexes processed by the Event Processor Service.
Statistics – Shows Memory, Disk free space, Uptime, IP address & port, version and node name for the Elastic Search machine associated with the EPS instance in the selected environment.
Disk size vs Document count – Shows disk size and document count of all the indexes combined over sliding time scale.
CPU & Heap (%) – Shows the ElasticSearch nodes CPU and Java Heap memory utilization over a sliding time scale.
Logs (Filter by Level)
This shows all the Event Processor log entries in a tabular format. This table can be exported and searched using the controls provided on the top right-hand corner of this dashboard part. For each log entry, you can see the following columns.
Timestamp – Date and time of the log entry
Level – Information, Debug, Warning or Error level of the log entry
Message – Actual message providing more information of the log entry
Source – The component or system that created the log entry
Application Monitoring
This page provides application centric view of monitoring. Use this page to monitor individual applications that are running in an environment. The expanded view can show more details about endpoint health in those applications.
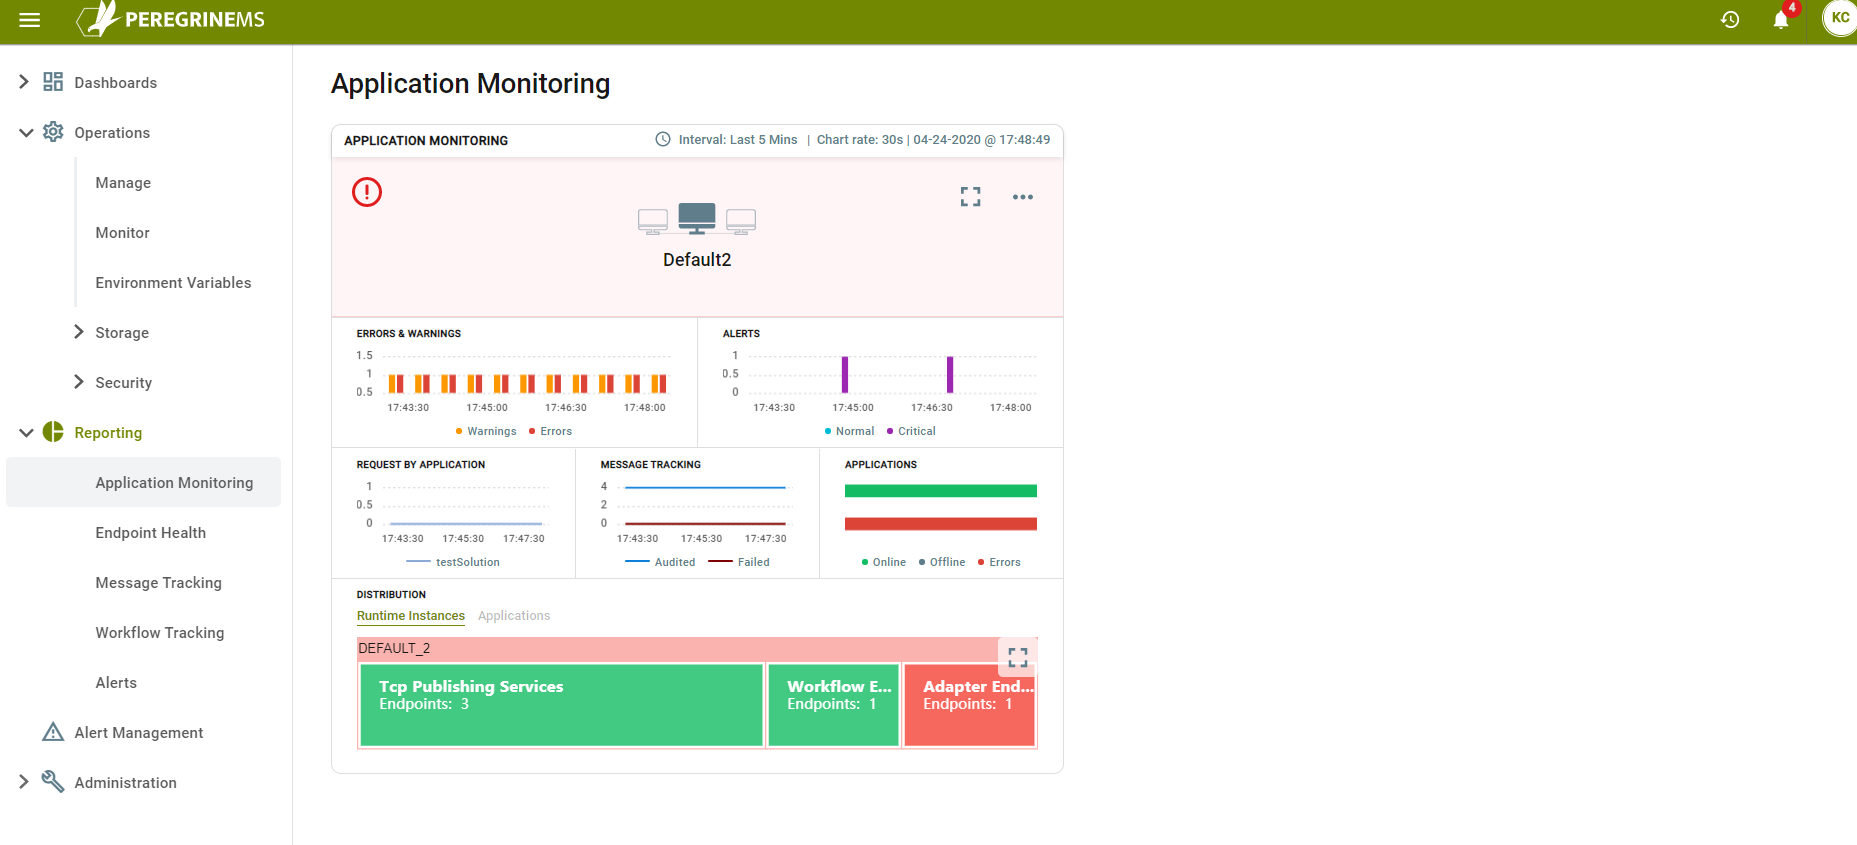
The above view shows the name of the environment in the first row. In the second row it shows the following:
Errors & Warnings – Number of Errors and Warnings shown in a bar chart against a sliding time scale.
Alerts – Number of Normal and Critical Alerts raised as a bar chart against a sliding time scale.
The third row shows the following:
Requests by Application – Number of requests processed by all Applications running in the environment as a line chart against a sliding time scale.
Message Tracking – Number of Audited and Failed messages logged against a sliding time scale.
Applications – Shows the number of online, offline and errored endpoints in all the applications in the environment.
The last row in this dashboard shows the Distribution of different artifacts by Instance or by Application. It shows a box chart of different types of Endpoints with size of the box proportional to the number of endpoints in each category.
Expanded View
With Expanded view, you can see many more details about the applications running in your environment.
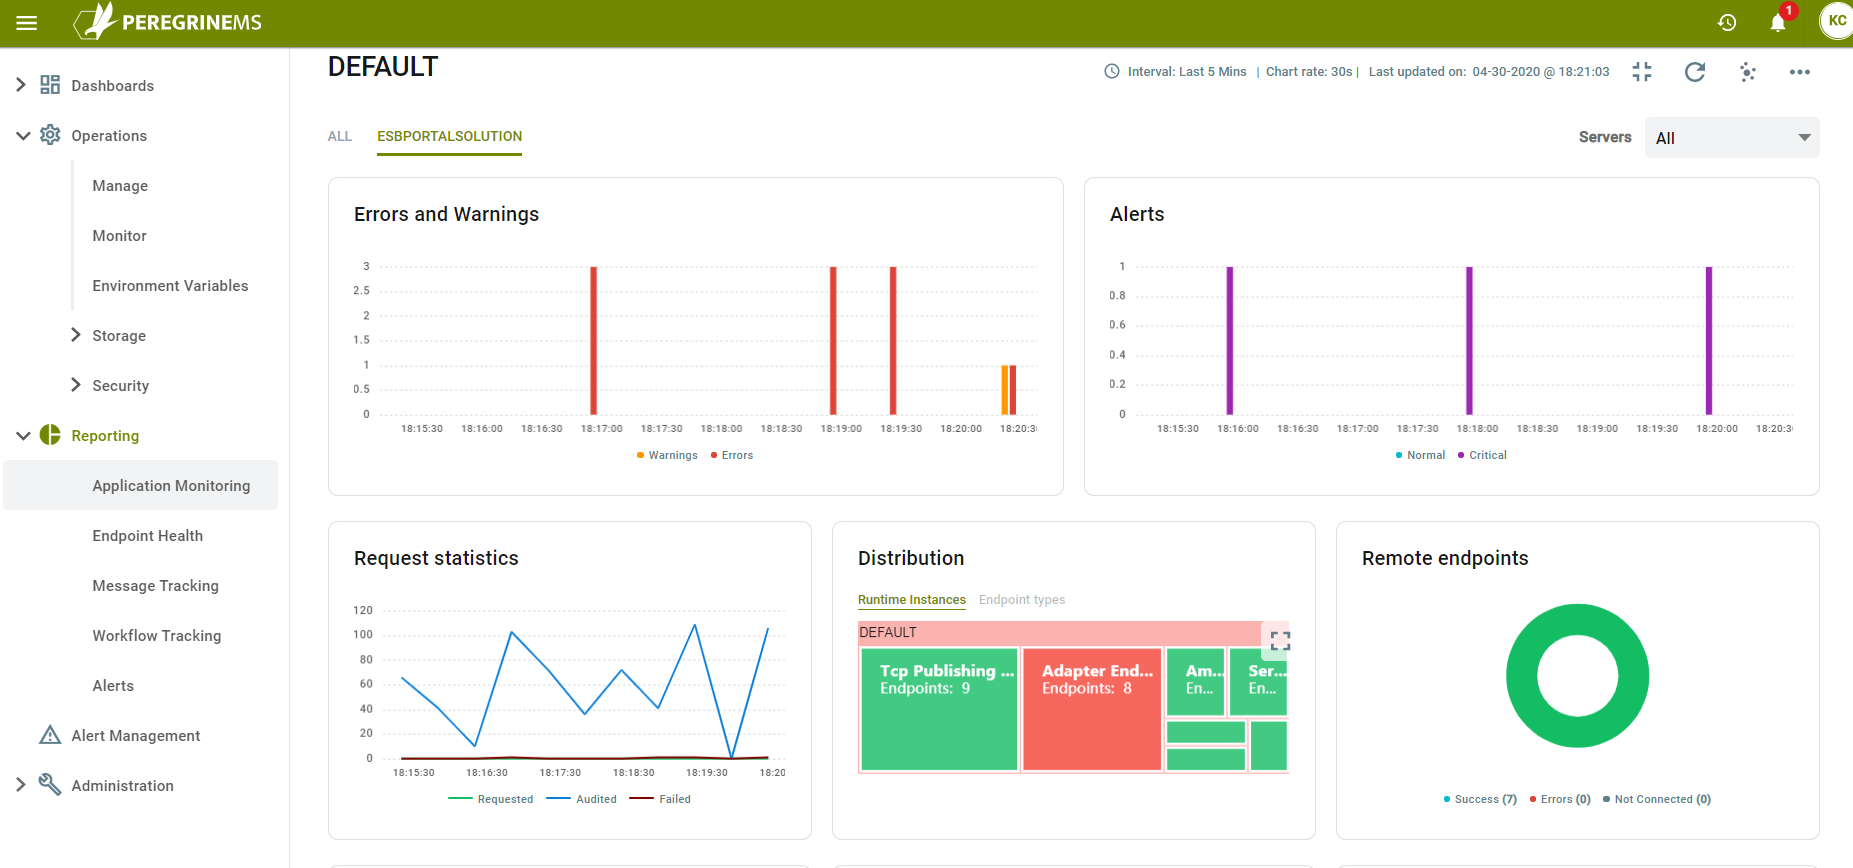
In the above view you can see the following charts. These can be viewed by individual application or combined for all applications in the environment.
Errors & Warnings – Number of Errors and Warnings shown in a bar chart against a sliding time scale.
Alerts – Number of Normal and Critical Alerts raised as a bar chart against a sliding time scale.
Request Statistics – Number of requests processed by the application or all applications running in the environment as a line chart against a sliding time scale. It shows counts for requested, audited and failed requests.
Distribution – This shows the Distribution of different artifacts by Instance or by Application. It shows a box chart of different types of Endpoints with size of the box proportional to the number of endpoints in each category.
Remote Endpoints – This part is visible only when viewing a specific application. It shows the distribution of Remote endpoints using a pie chart that shows endpoints count with successful requests, Endpoint counts with Errors and Endpoint counts that are not connected.
If you have workflows running in the solution, then you can also monitor them using this page. Following widgets will show the workflow activity, status and completion rates.
You can view the endpoint health using the detailed view and you can take actions such as start/stop or disable on the endpoints and endpoint hosts. In this section, you have the ability start/stop, topics and endpoints as well as ESB Service and endpoint hosts. This part is same as the part described in the Environment Monitoring Section.
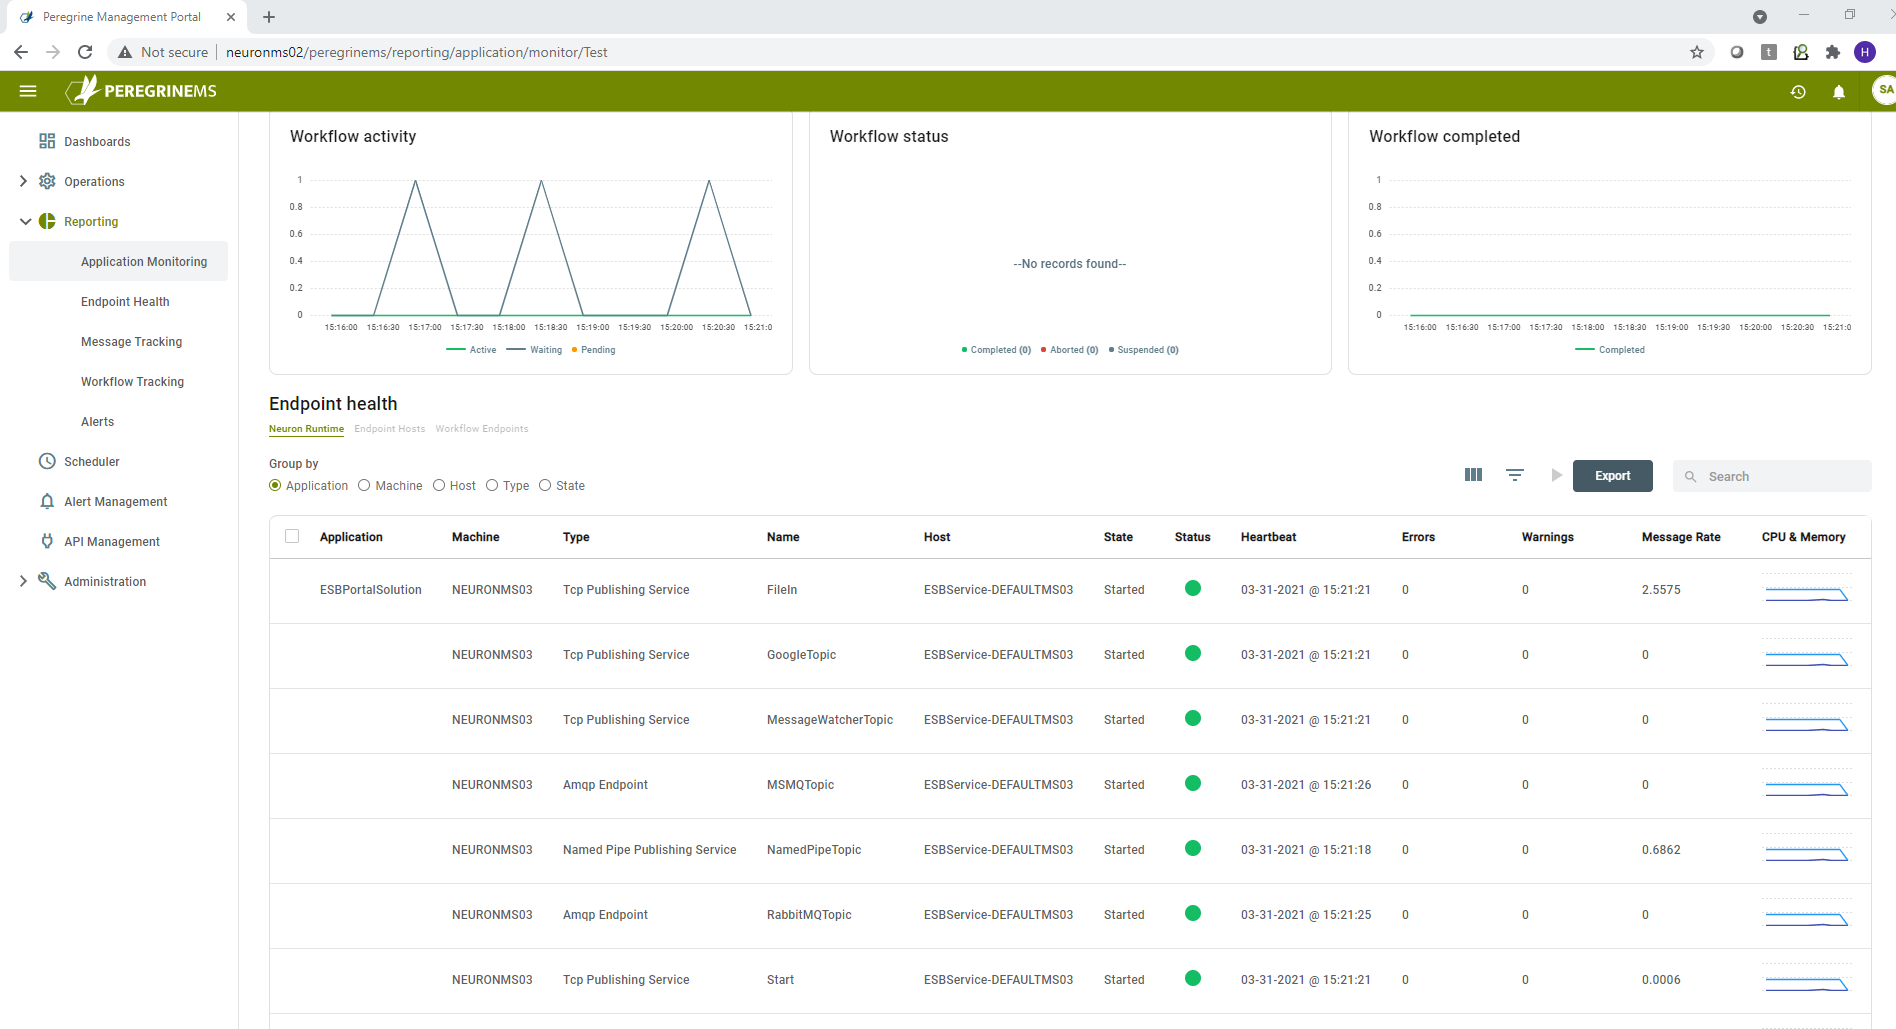
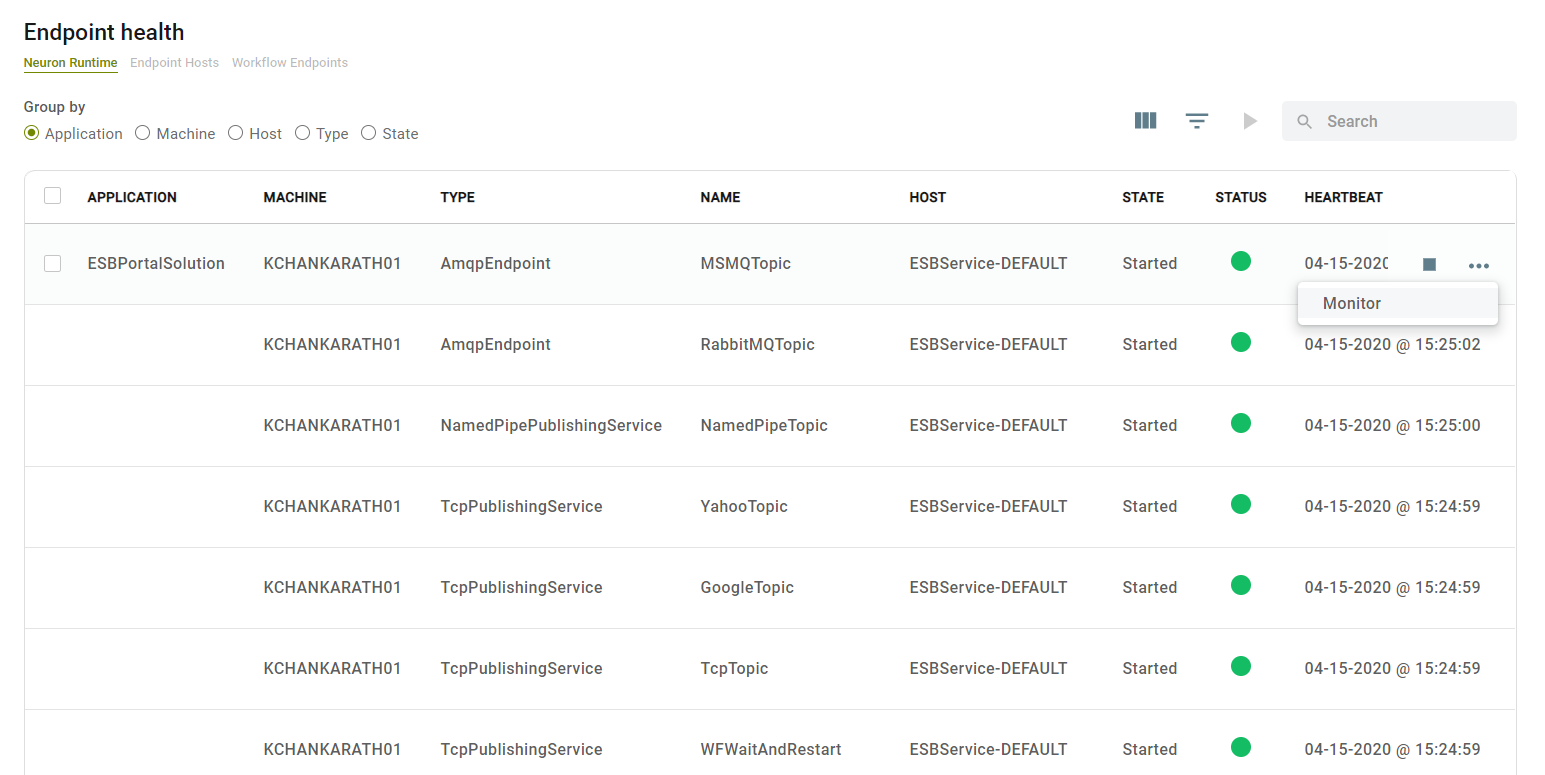
The endpoint health page lists the Endpoints running under different tabs for Neuron ESB Service or one of the Endpoint Hosts. It lists Workflow Endpoints under a separate tab also. Generally, Topics run under ESB Service whereas the Client Connectors, Service Connectors and Workflow Endpoints run under Endpoint Host (Though you can run them under ESB Service).
You can further group the Endpoints by Application/Machine/Host Name/Type and State by selecting one of the radio buttons above the grid.
Following columns are shown in the default view.
Application – The Neuron Solution or Application the endpoint belongs to.
Machine – Machine on which the Endpoint is running
Type – Type of the Endpoint. Shows TcpPublishingService, AmqpEndpoint, MSMQEndpoint, Client Connector, Service Connector or Workflow Endpoint.
Name – Name of the Endpoint assigned by the application developer.
Host – Name of the Endpoint Host that is running the Endpoint.
State – Shows the State of the Endpoint, e.g., Started, Stopped, Disabled etc.
Status – Shows the status of the endpoint green dot if running normally, red dot if it has errors.
Heartbeat – Shows the time of the last heartbeat. Heartbeats let the Management Suite know if the endpoint is alive or dead every few seconds.
Other columns not shown in this view are
Errors – Number of Errors for the endpoint since last start
Warnings – Number of Warnings for the endpoint since last start
Message Rate – Rate of message processing counts/sec for the endpoint
CPU and Memory – Summary chart of CPU and Memory Utilization. Hovering mouse over shows the values in percentage.
Actions
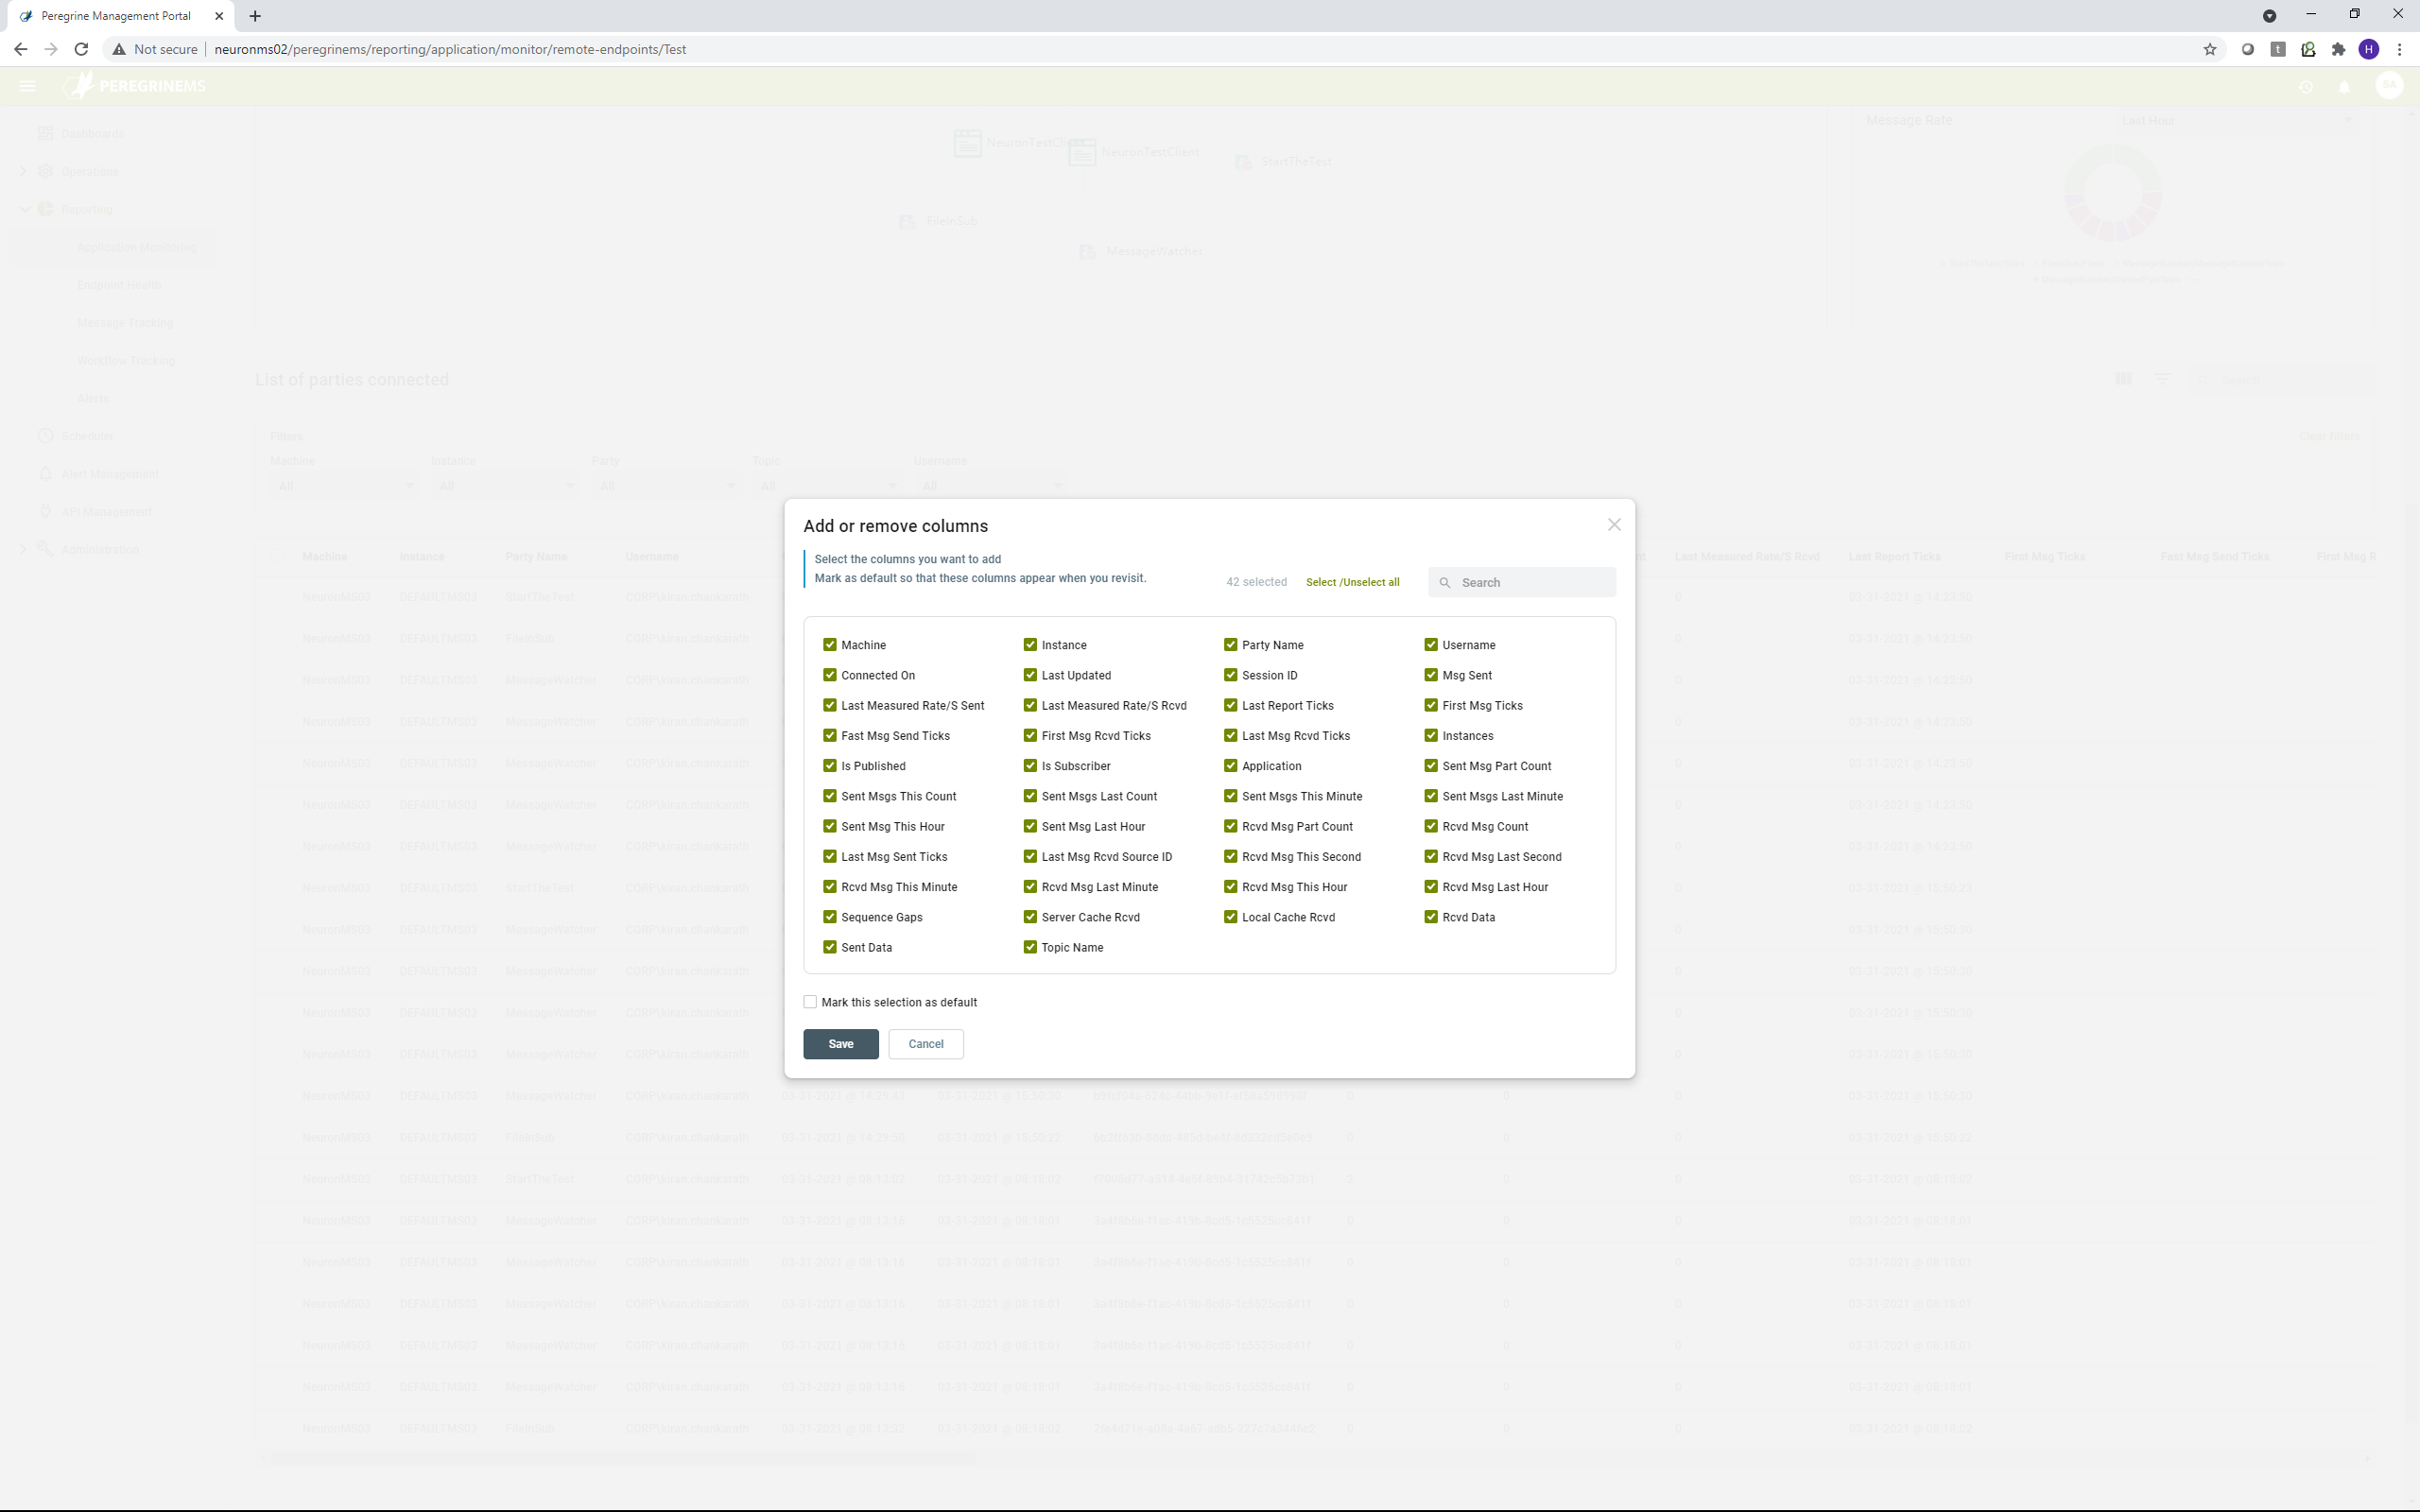
The buttons shown in the screen below on top right-hand corner of Endpoint Health Grid allow you to customize, search and filter the endpoint grid. It also allows you to start any stopped or disabled endpoints.
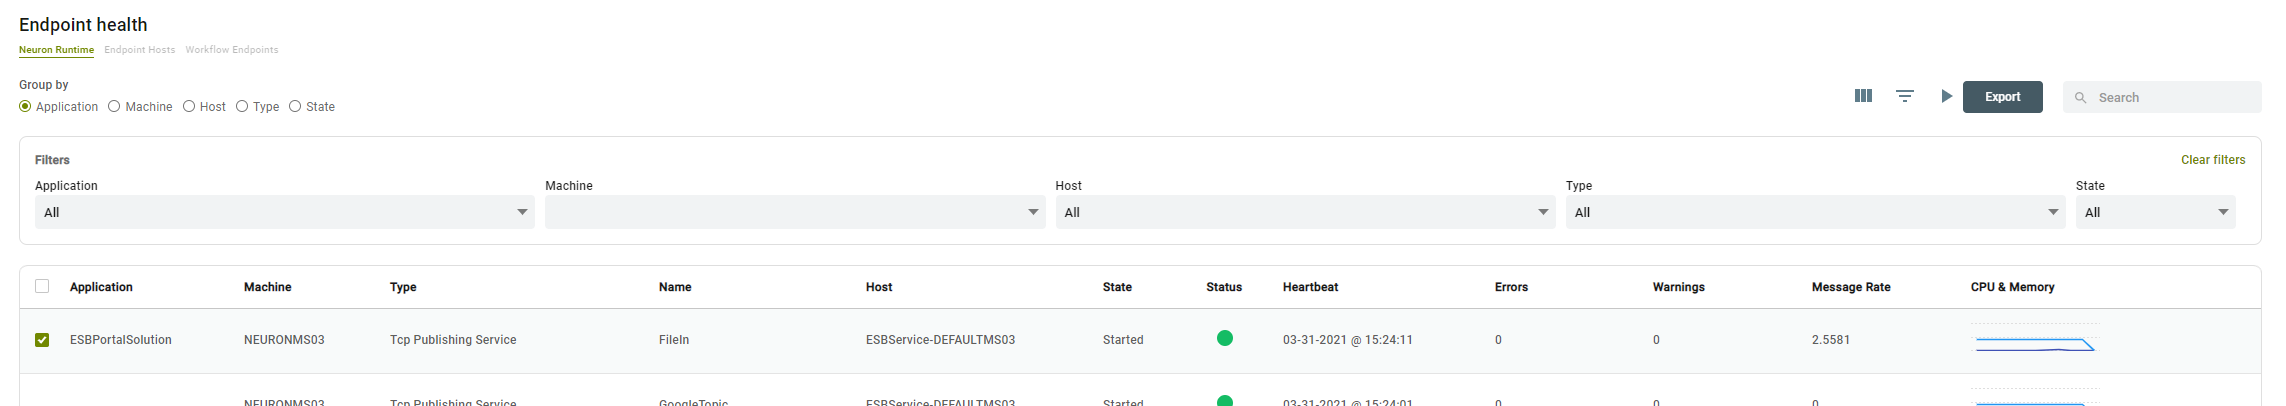
The accordion icon allows you to customize the columns shown in the grid. The funnel icon displays additional row above the Grid as shown, that allows you to filter the Grid. When an item is selected, the play button is enabled, and you can start a stopped endpoint using this button. Using the Export button, you can export the results to a CSV file or Excel Spreadsheet.
Notes: Endpoint Hosts are used to separate endpoints into isolated domains so that fault in one endpoint connector will not affect endpoints in other endpoint hosts. Endpoint hosts can be scaled independently across Neuron ESB machines. Refer to Neuron ESB documentation for more details.)
There is also another page dedicated to Endpoint Health, that provides more details about the endpoints as well as all the options available on this page.
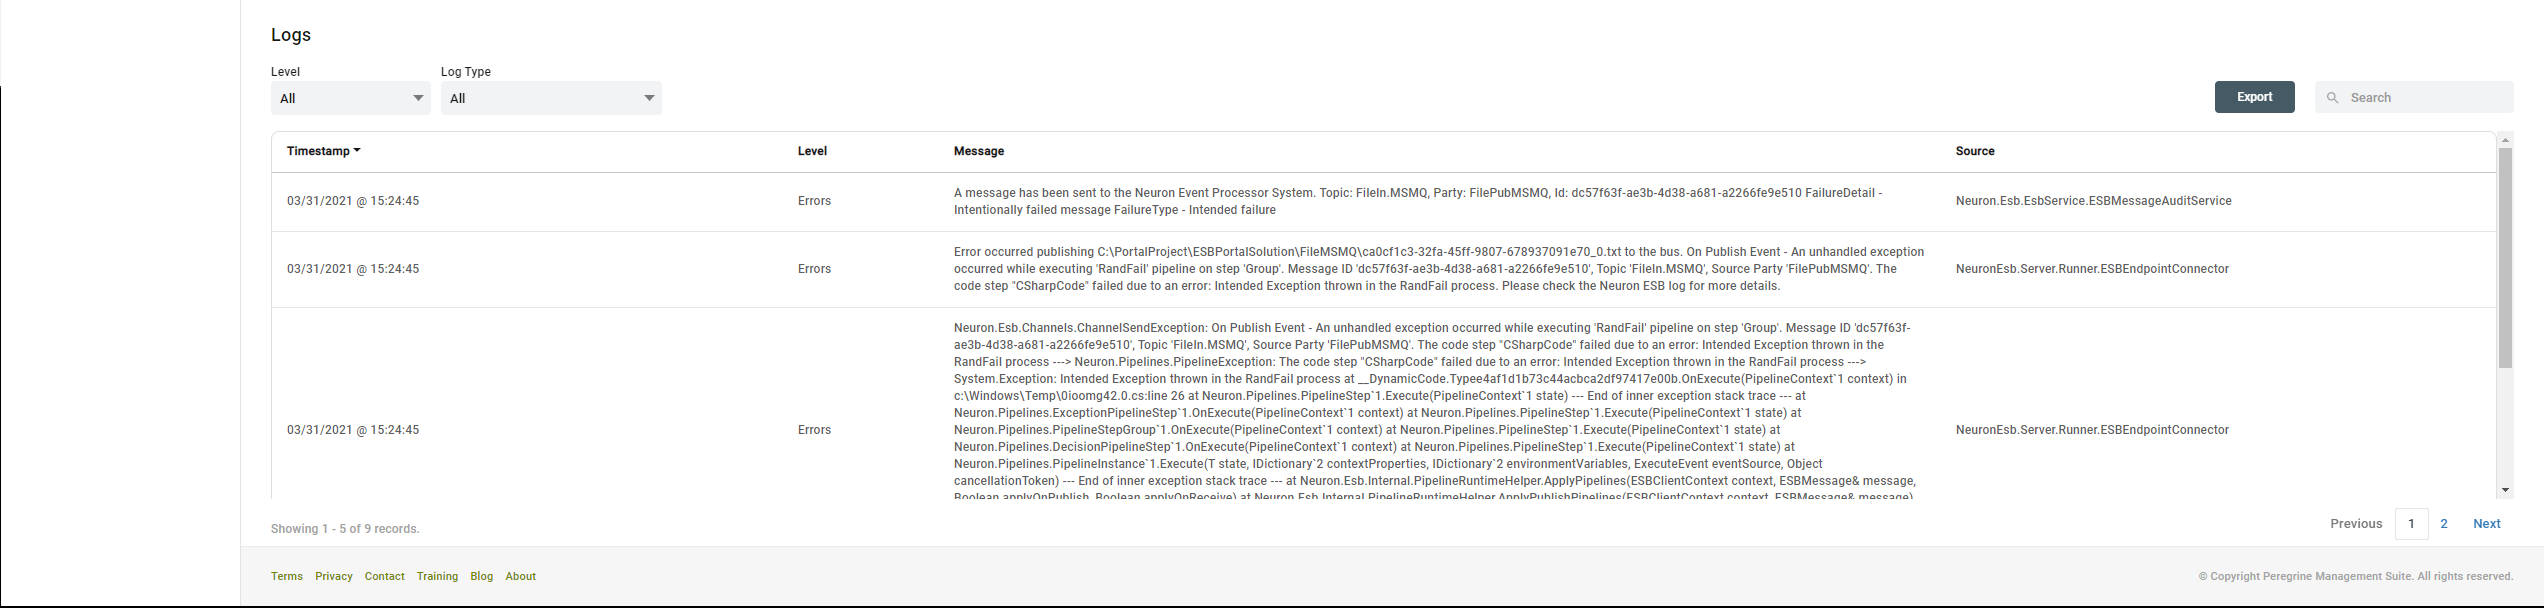
Finally using this page, you can view the log entries for various endpoints and endpoint hosts. You can also export the logs to CSV file for shipping them out. This table can be exported and searched using the controls provided on the top right-hand corner of this dashboard part. For each log entry, you can see the following columns.
Timestamp – Date and time of the log entry
Level – Information, Debug, Warning or Error level of the log entry
Message – Actual message providing more information of the log entry
Source – The component or system that created the log entry.
Remote Endpoint Health
When other applications connect to Neuron ESB instance using the Neuron ESB SDK and publish / subscribe messages using topics in the Neuron instance, they are referred to as remote endpoints or externally hosted endpoints. Remote endpoint Health can be accessed by clicking ![]() icon in the top right-hand corner of the Application Monitoring page. This page shows graphical view of connected parties and a tree view of all connected parties and the topics they subscribe to. You can view list of parties connected as well as message rate for each party. This page is shown below.
icon in the top right-hand corner of the Application Monitoring page. This page shows graphical view of connected parties and a tree view of all connected parties and the topics they subscribe to. You can view list of parties connected as well as message rate for each party. This page is shown below.
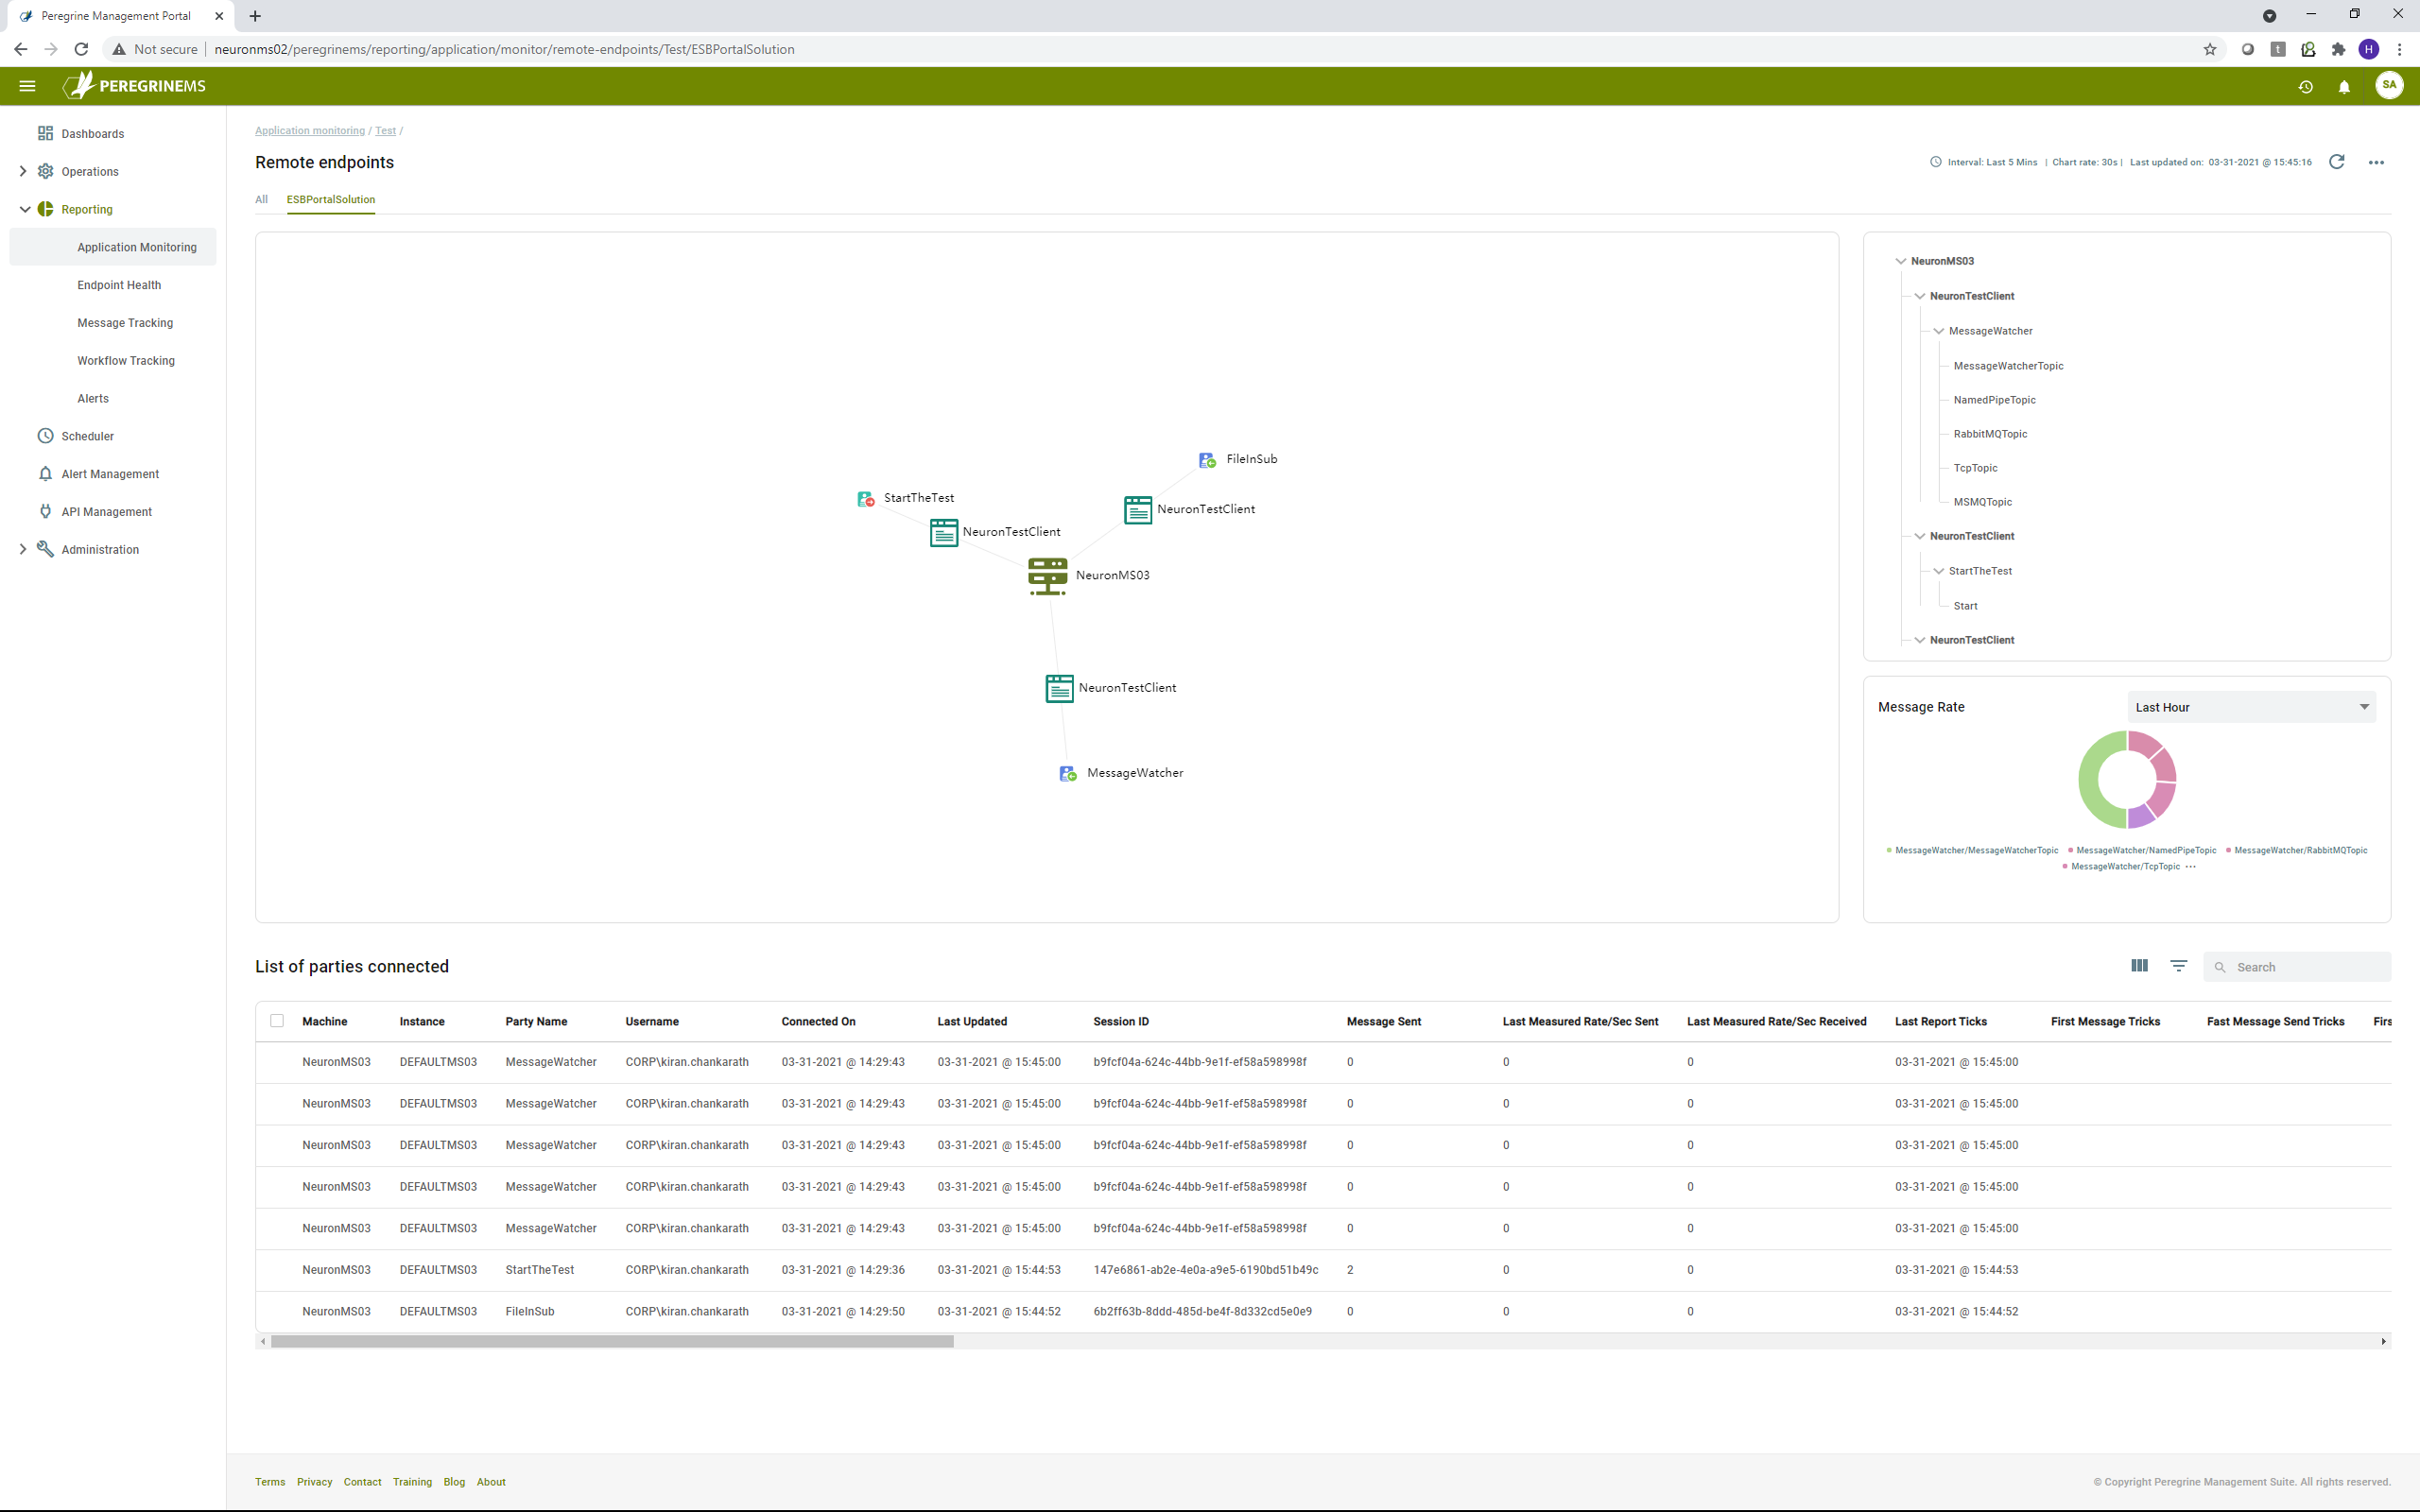
The graphical view above shows the application and the Neuron machine as well as the publishers and subscribers (and the associated topics) that are hosted by the remote application. The tree view on the right shows the publishers/subscribers and associated topics in a hierarchical list.
The message rate dashboard part shows the message rate over different topics hosted by the remote applications. The list view below shows the list of parties connected and the information associated with each connection.
List of parties connected grid
This grid view shows the following columns for each remote party connected to Neuron ESB.
Machine – Name of the remote machine.
Instance – Name of the Neuron ESB Instance.
Party Name – Name of the party (i.e., subscriber or publisher hosted by the remote application).
Username – Username under which the remote application is running.
Connected On – Time of when user application connected to Neuron ESB.
Last Updated – Time when the statistics of remote party are last updated.
Session ID – Session ID assigned to each remote party.
Message Sent – Number of messages sent by the remote party.
Last Measured Rate/Sec Sent – Last measured rate of sent messages by the remote party.
Last Measured Rate/Sec Received – Last measured rate of received messages by remote party.
Remote Application – Name of the remote application.
Sent Message Part Count – Count of number of sent message parts (when multi-part messages are sent by remote application).
Sent Messages This Second Count – Number of sent messages this second (at the time of recording).
Sent Messages Last Second Count – Number of sent messages last second (at the time of recording).
Sent Messages This Minute – Number of sent messages this minute (at the time of recording).
Sent Messages Last Minute – Number of sent messages last minute (at the time of recording).
Sent Message This Hour – Number of sent messages this hour (at the time of recording).
Sent Message Last Hour – Number of sent messages last hour (at the time of recording).
Received Message Part Count – Count of number of received message parts (when multi-part messages are received by remote application).
Received Message Count – Count of number of received messages since beginning of session.
Last Message Sent Ticks – Amount of time measured in Ticks since the last message was sent from any party.
Last Message Received Source ID – Source ID (publisher) of the last message.
Received Message This Second – Number of received messages this second (at the time of recording).
Received Message Last Second – Number of received messages last second (at the time of recording).
Received Message This Minute – Number of received messages this minute (at the time of recording).
Received Message Last Minute – Number of received messages last minute (at the time of recording).
Received Message This Hour – Number of received messages this hour (at the time of recording).
Received Message Last Hour – Number of received messages last hour (at the time of recording).
Received Data – Total amount of data received in bytes.
Sent Data – Total amount of data sent in bytes.
Topic Name – Name of the topic on which messages are sent or received.
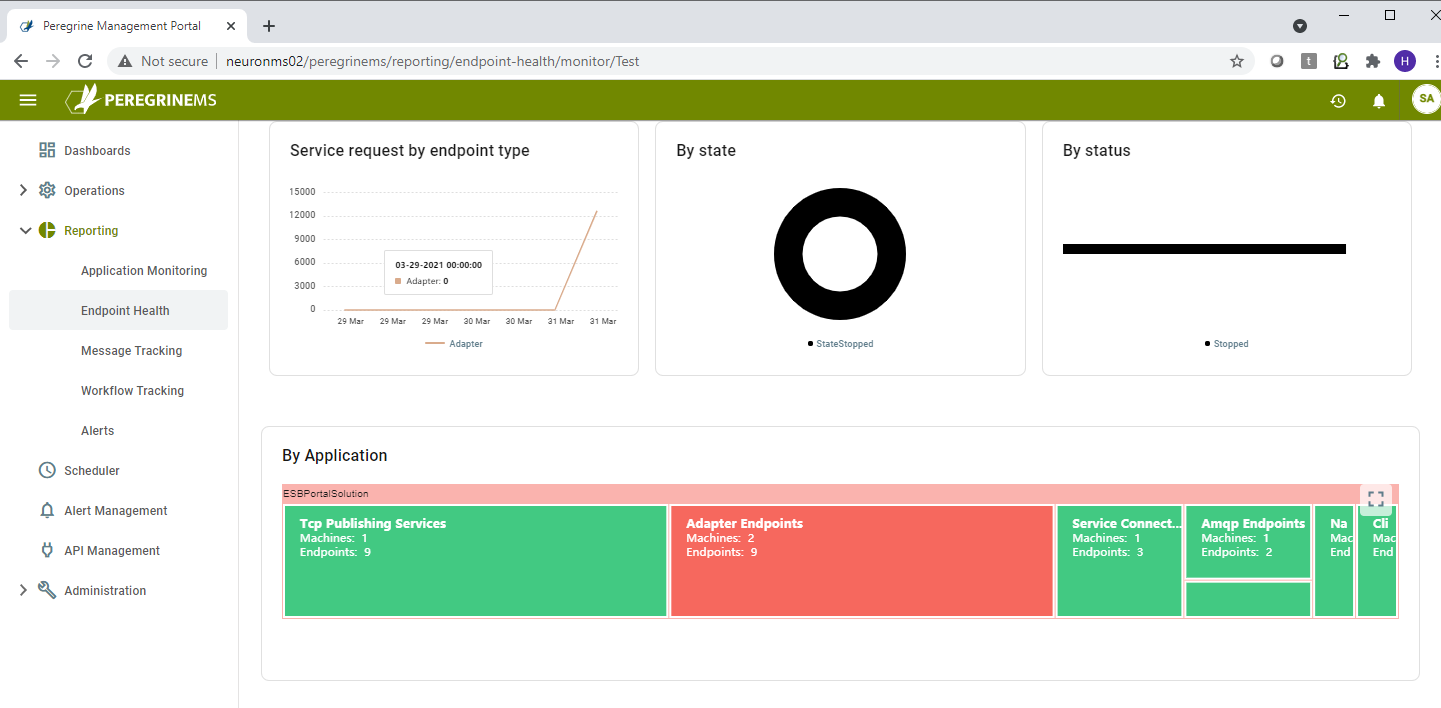
Endpoint Health
The Endpoint Health card view below shows summary of Endpoint Health.
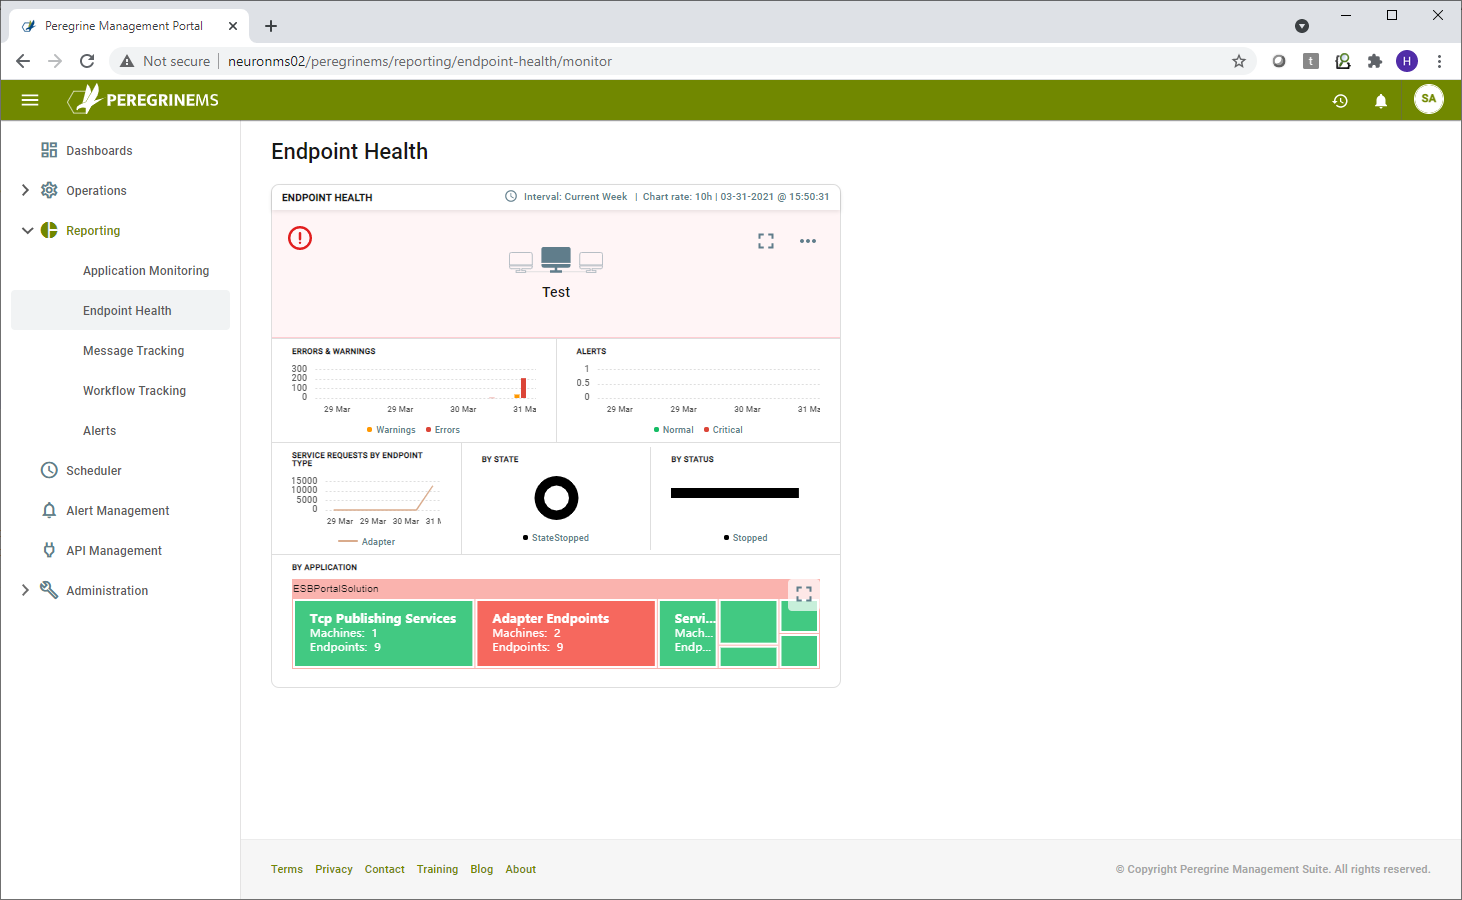
The first row above shows Environment Name. The second row shows Errors, Warnings and Alert (Normal / Critical) counts on a sliding time scale.
The third row shows number of service requests by Endpoint Type in the first chart, second and third charts in this row show the service endpoints by State (Started, Stopped) and by Status (Normal, Error, Disabled etc.)
The fourth row shows the distribution of endpoints by endpoint type such as topic, adapter, service etc.
The Endpoint Health detail page provides more detailed view of individual endpoints, such as service requests by endpoint and endpoint health logs. Using this view, you can start/stop or enable/disable endpoints and endpoint hosts.
The detailed view provides expanded charts described in the previous section for the card view.
The bottom part of this detail page shows the Endpoint Logs in a list view. This section is like the Log section described in Environment Monitoring in the previous chapter.
Clicking on the List view of the detailed Endpoint Health page shows the Endpoint Health List view which is same format as described in the previous section of Application Monitoring.