Environment Setup and Management
This article lists all the tasks that a Peregrine Management Suite administrator should perform immediately after installation.
Adding Environments
Each instance of a Neuron ESB Application on your premises needs to be configured as an environment in Management Suite.
The following steps show the configuration of an environment.
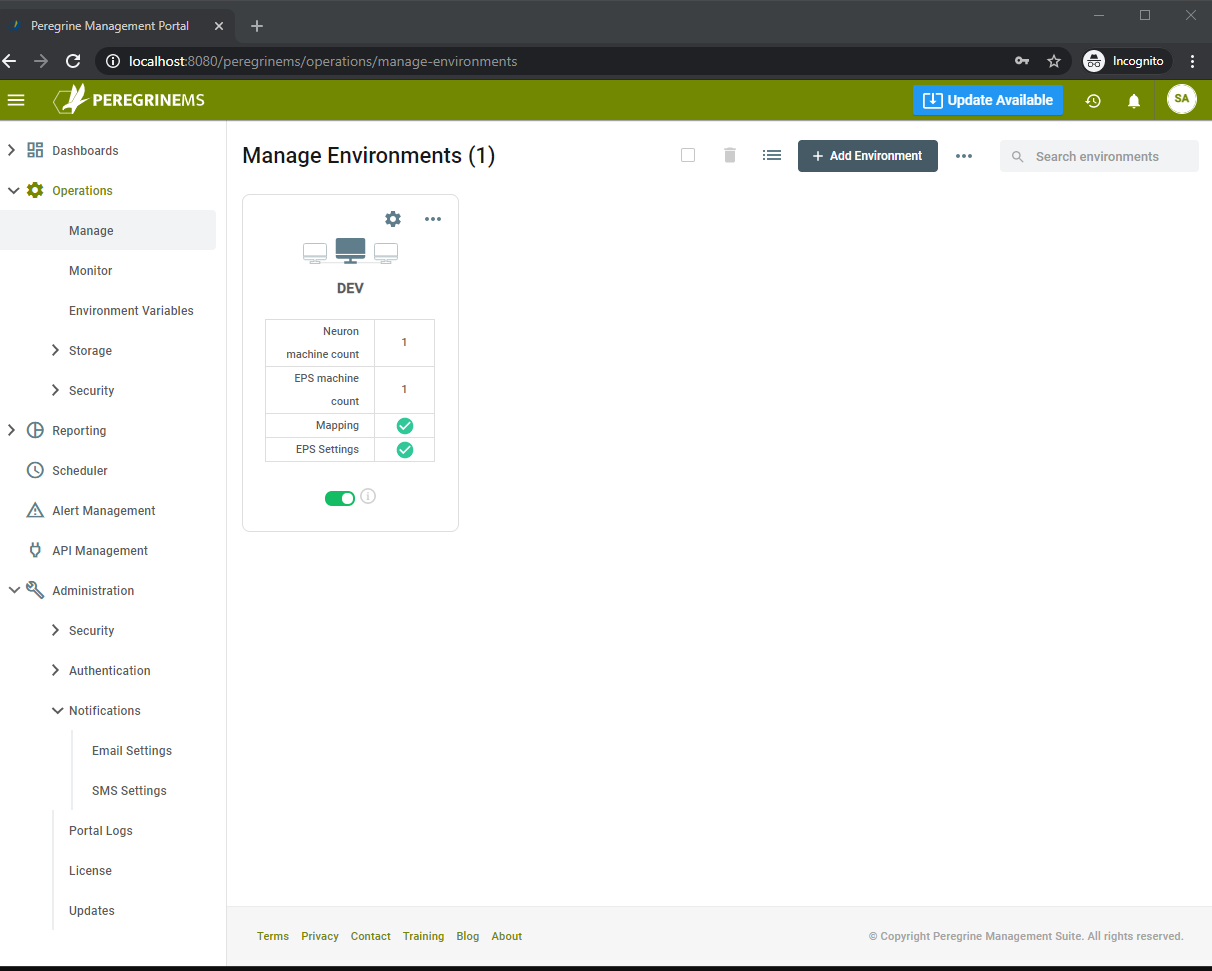
On the left-hand side menu, select Operations -> Manage. Then click the Add Environment button:
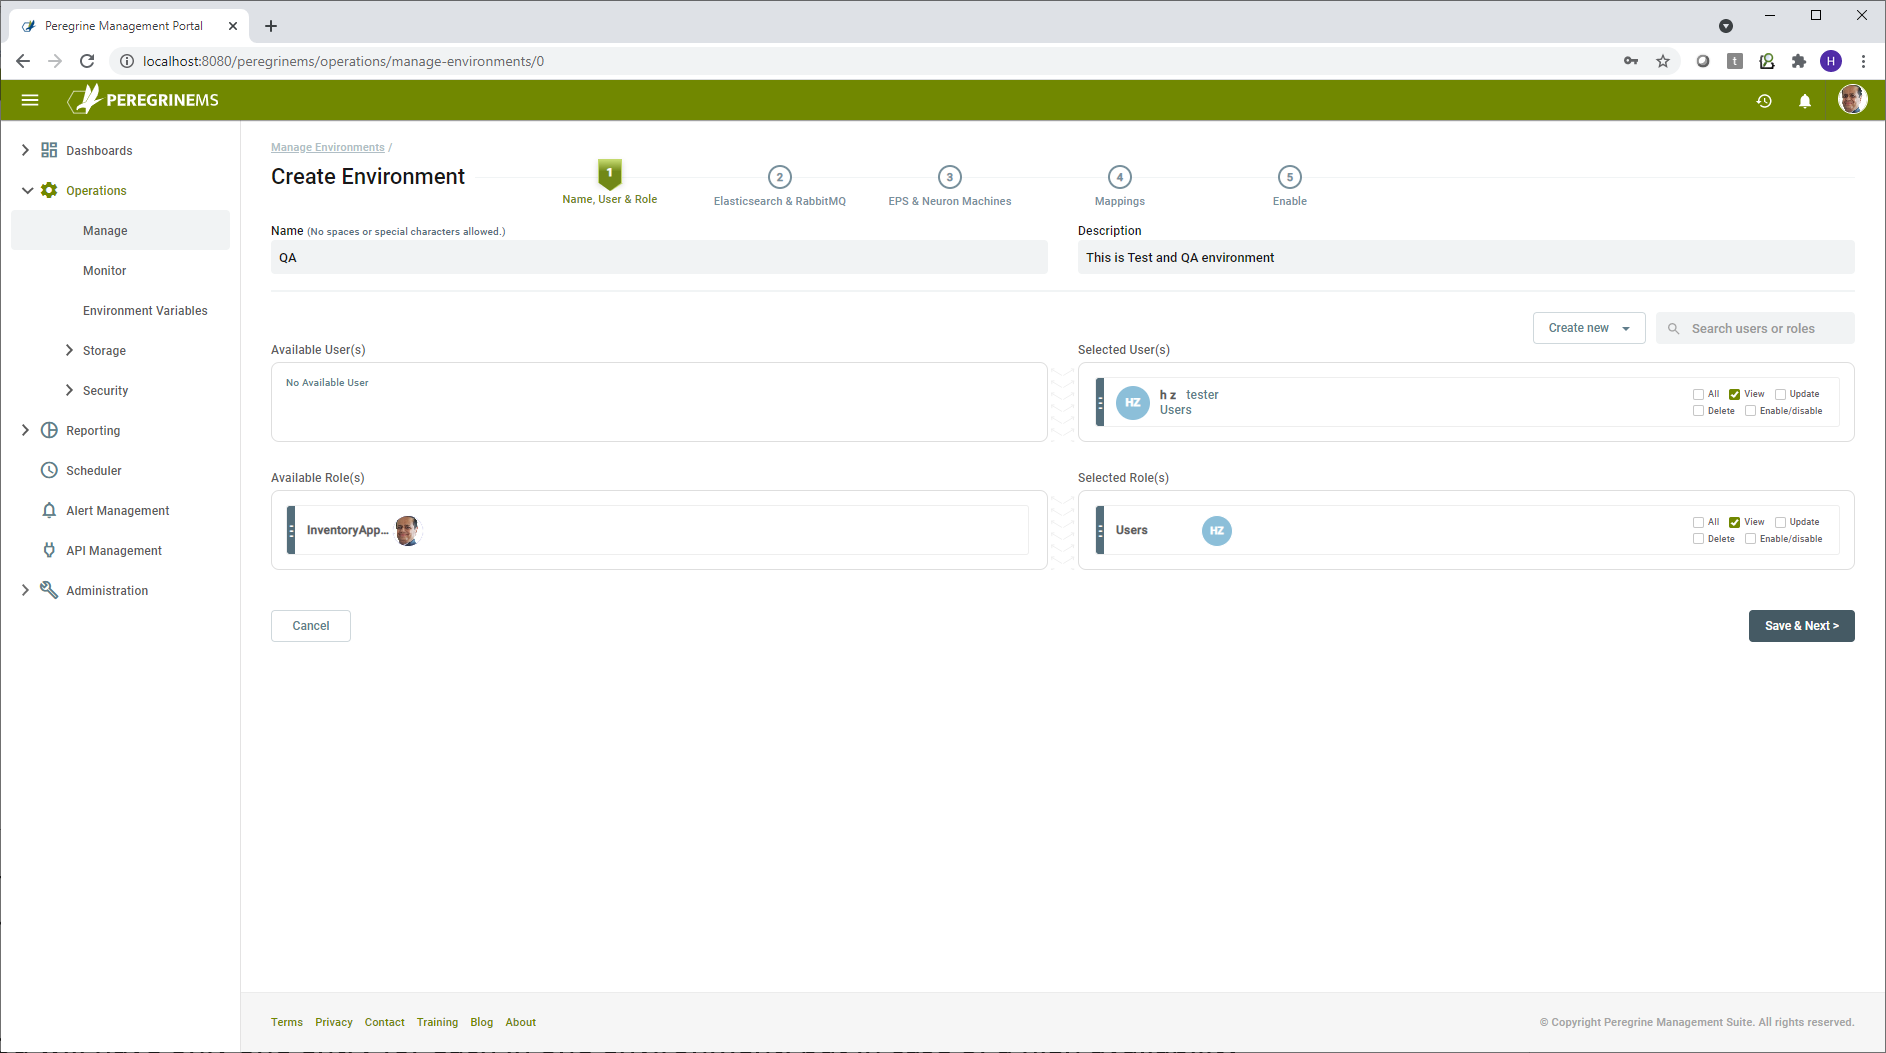
This starts a wizard to create the environment. The first step is to create the Environment Name and Description, this could reflect your physical environments, i.e., Dev, Test, or Production.
The next step is to assign users and roles to the environment. The Global Administrator role automatically has permission to all environments. If no further user or role assignments are required, you may skip this step. If you would like to assign specific users or roles, select user or role, and drag it from left to right. Note, you may go back to this step to assign or edit users and roles later. Check the boxes corresponding to the level of permissions allowed such as View, Update, Delete, Enable/Disable or All on either the user or role.
Next step is to define the Elastic Search and RabbitMQ servers associated with this environment. Click on each of the tabs and fill in the required information. Be sure to test the information by clicking the Test button. Click the Add button to save the information your entered in each tab. Note that you may add more than one Elasticsearch and RabbitMQ Server in the environment.
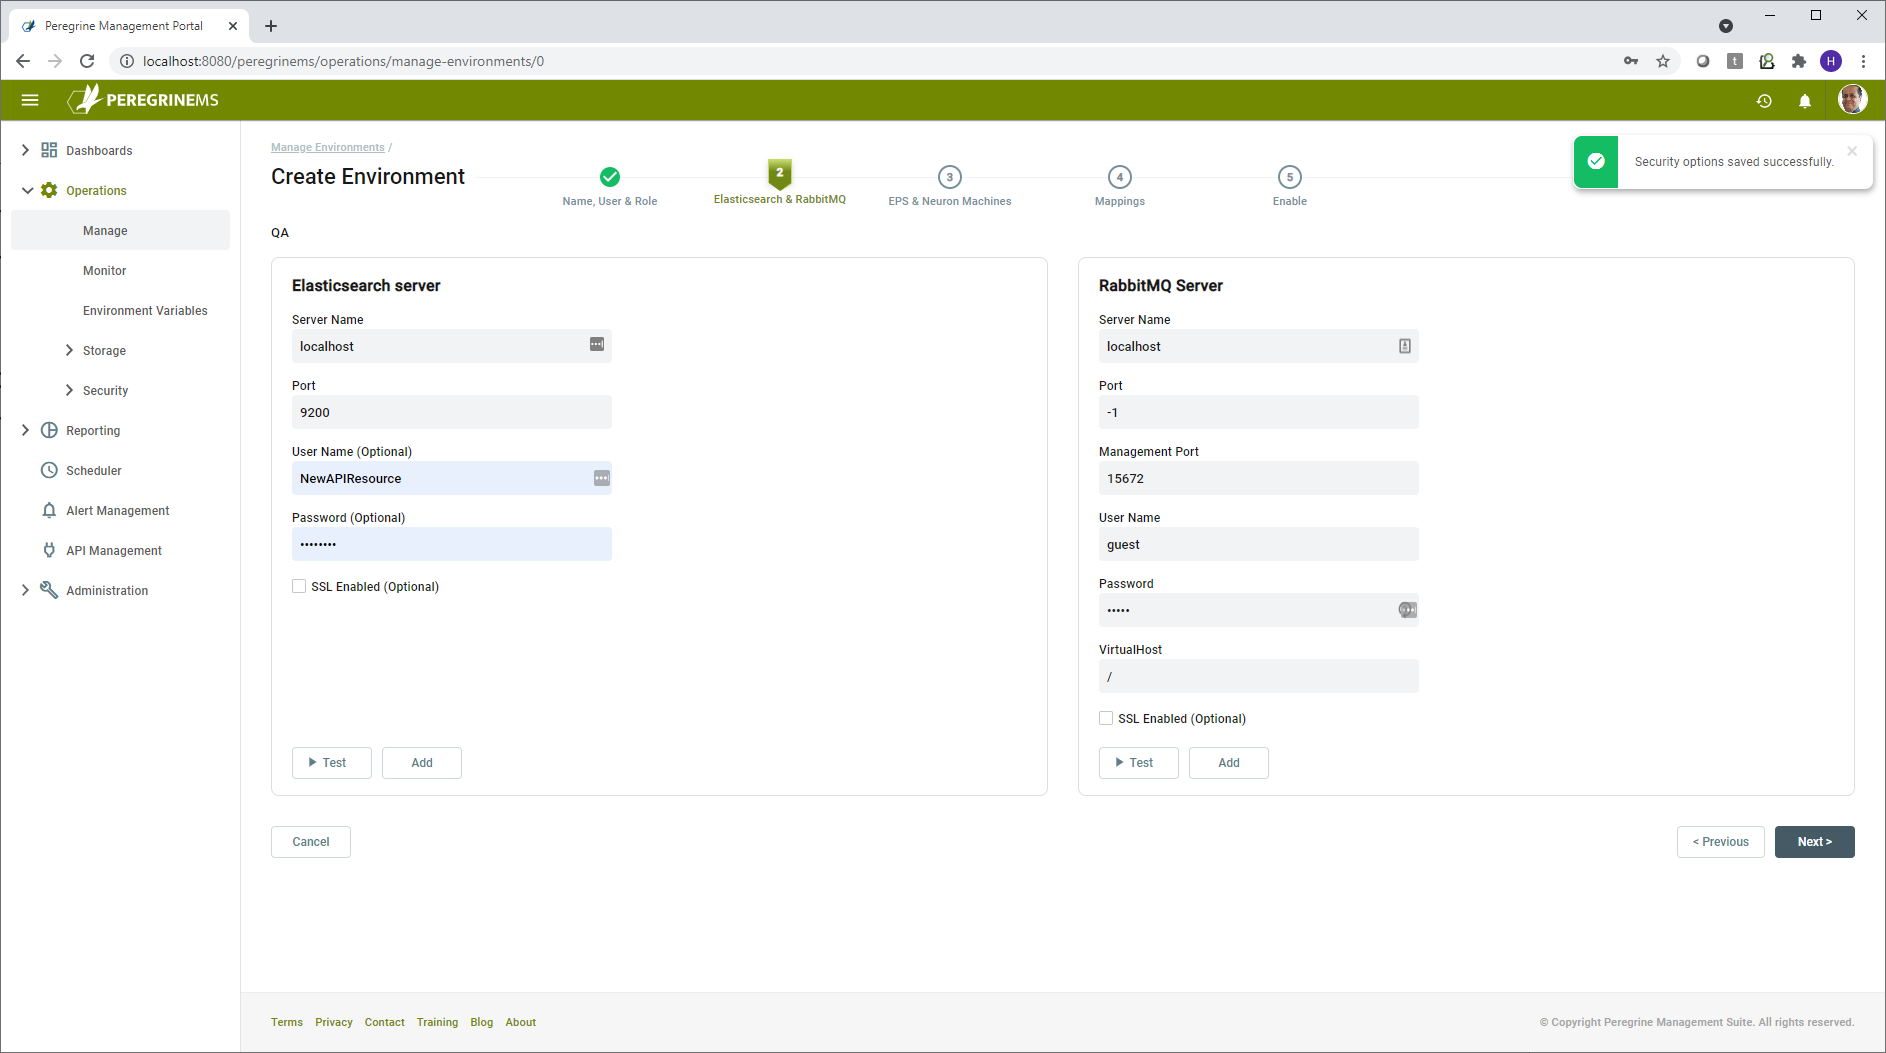
For each ElasticSearch server, specify the server name and port, and optionally a username and password and select whether or not SSL is enabled for that server. For each RabbitMQ server, specify the server name, port, management port, username, password and which virtual host to use, and optionally whether or not SSL is enabled for that server. Virtual hosts are used in RabbitMQ to segment access across multiple environments. Please see reference section for links to guidance on using SSL with Elasticsearch and RabbitMQ.
After completing this section and testing/verifying the servers, click Next to save and continue to set up the Event Processing Service (EPS) and Neuron servers. For the EPS server, generally, you will have only one entry in each environment. If you require a highly available or scalable setup, you may add additional servers. The Event Processor service can detect failures and continue processing using the second server. Enter the machine name and port of the EPS server.
Next, add the Neuron ESB servers to the environment. Like EPS, you will generally only have one entry for each environment. For high availability or scalable setup, you may have more than one entry. The number of Neuron servers included here would be the same as the number of servers is a specific Deployment Group.
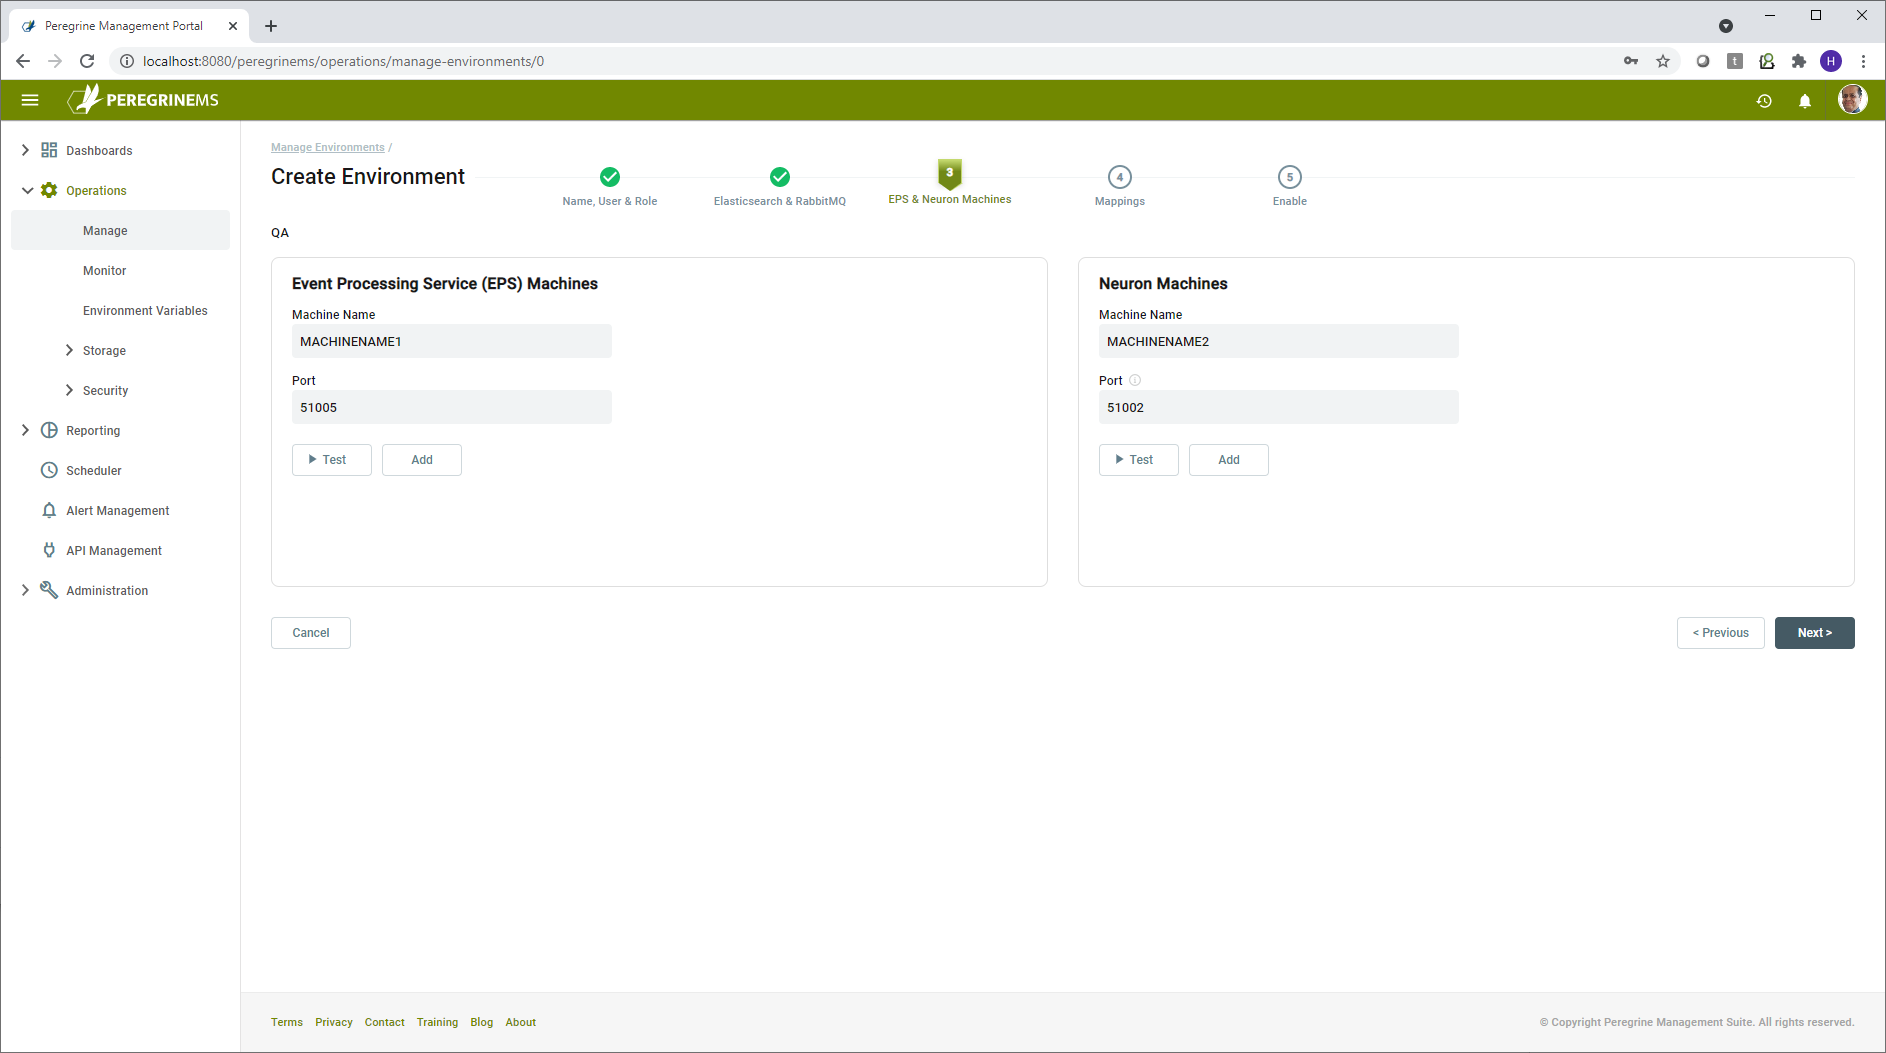
Click Test and Add to continue. Note that the port number for the Neuron server represents the Discovery (Operations) service port configured in the C:\Program Files (x86)\Neudesic\Neuron ESB v3\NeuronOperationService.exe.config file on the Neuron Server. Its default value is 51002 and only in rare cases you need to override it with a different value.
The next page of the wizard has you create one or more mappings for the environment. The mapping screen basically maps a Neuron Server/Instance/Deployment Group with an EPS server. You can have one or more EPS servers in an Environment. Most will probably just have one, and all applications deployed to an environment will map to it. However, you could also create a dedicated EPS for each application or just specific ones. For instance, if you knew you had an application that was going to generate a lot of traffic, you may want to have that dedicated to its own EPS. Usually, the EPS is installed on the same box the neuron instance is installed on. However, to allow for additional scaling, the EPS could be installed on its own dedicated server. In summary, you can have one or more EPS servers in an Environment.
Create a mapping between each Neuron server/Instance/Deployment Group to an EPS server and click the Add Mapping button. For each server in a Deployment Group, you should add a mapping. When you are finished adding mappings, click the Next button.
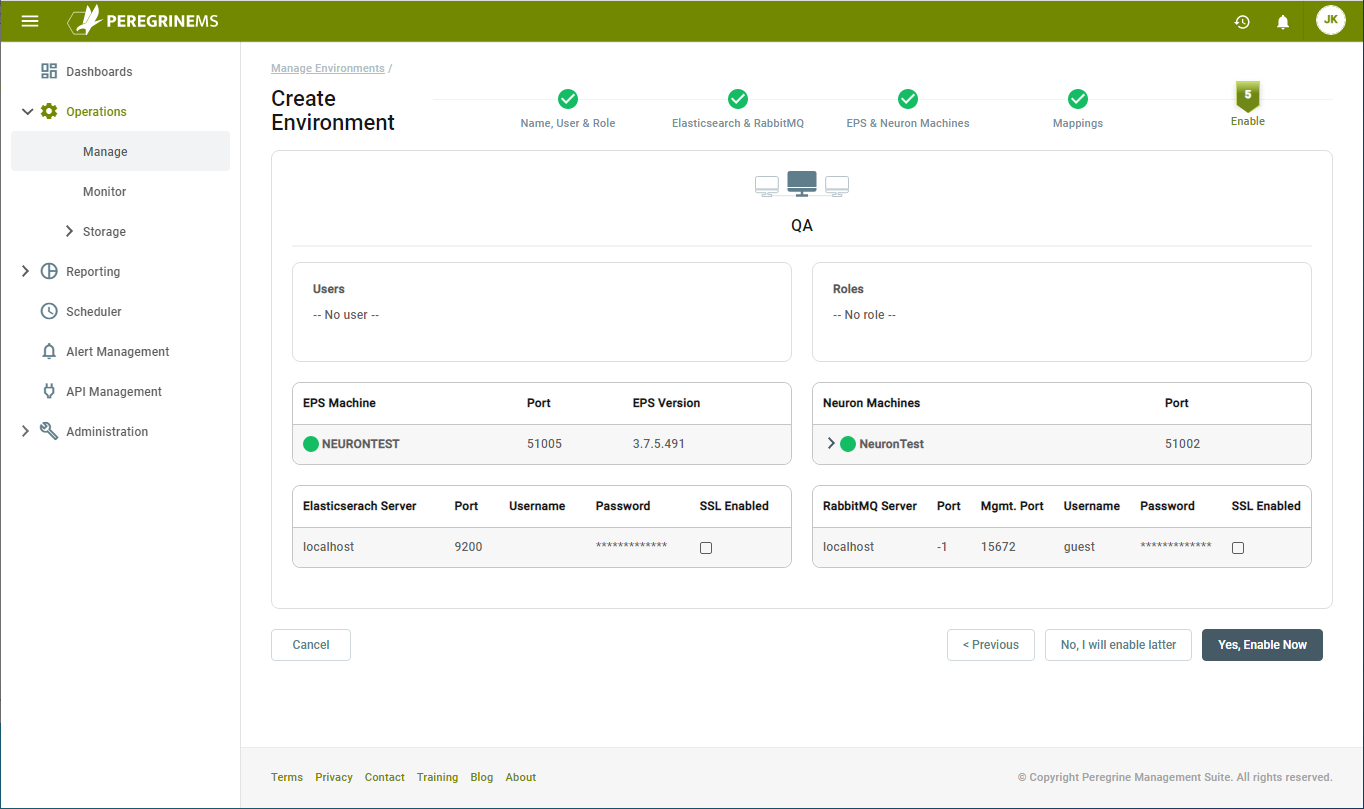
On the last section of the wizard, review all the settings. Once you are sure everything is correct, you can enable the environment by clicking the Yes, Enable Now button. If you are not ready to enable the environment, click the No, I will enable later button.
When you enable the environment, Management Suite will perform a few steps against each mapping:
- Updates the configuration of the Neuron Event Processor Service and restarts it
- Starts or restarts the Neuron Discovery Service
- Updates the configuration of the Neuron instance and starts or restarts it
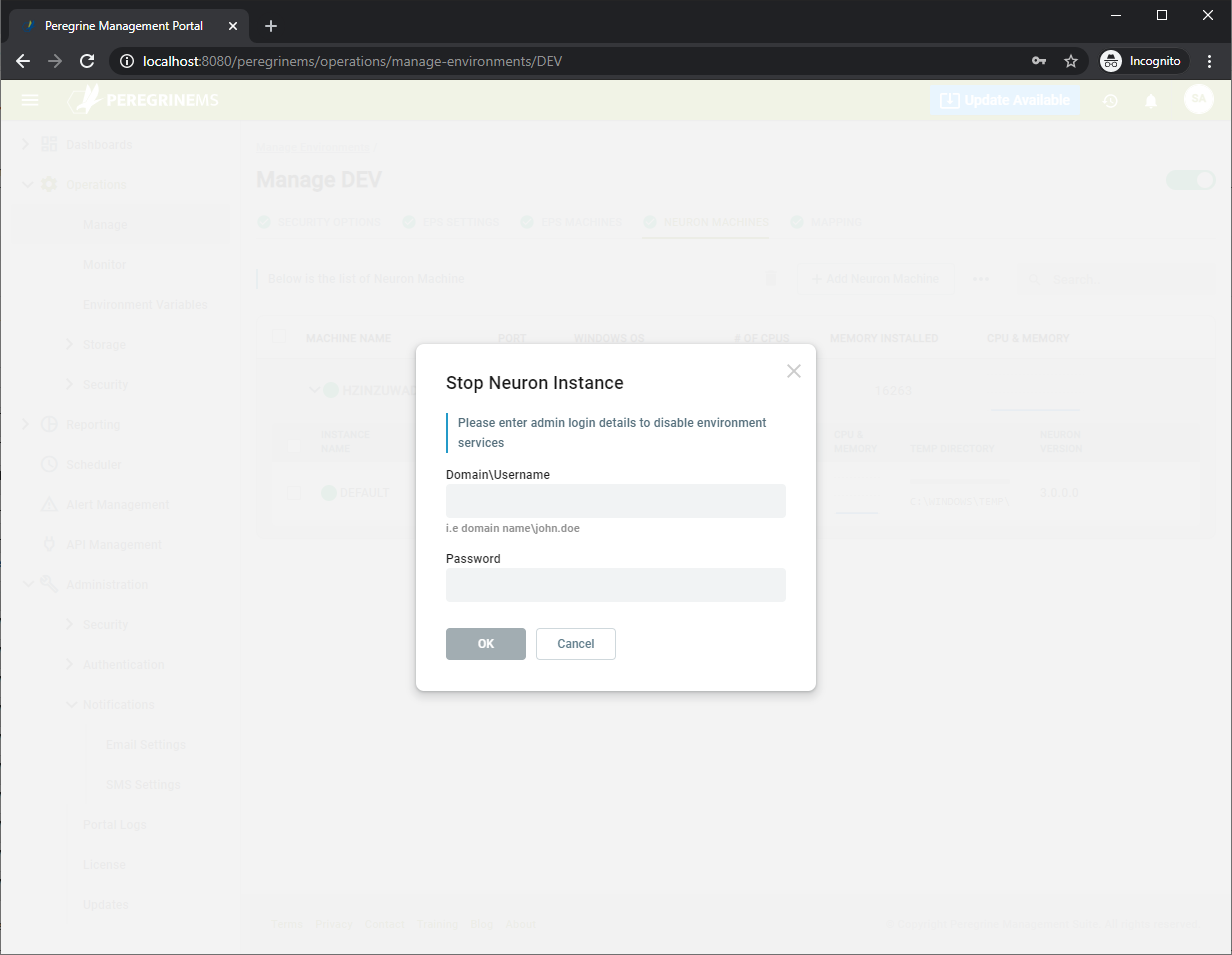
Enabling the environment will prompt for username and password credentials for the respective Neuron or EPS machine. This is required as the Management Suite performs remote operations on these machines on your behalf. It uses these credentials to launch local or remote PowerShell scripts on your behalf. These PowerShell scripts perform the above tasks. The credentials provided must have sufficient privileges on the Neuron/EPS machine to complete the tasks.
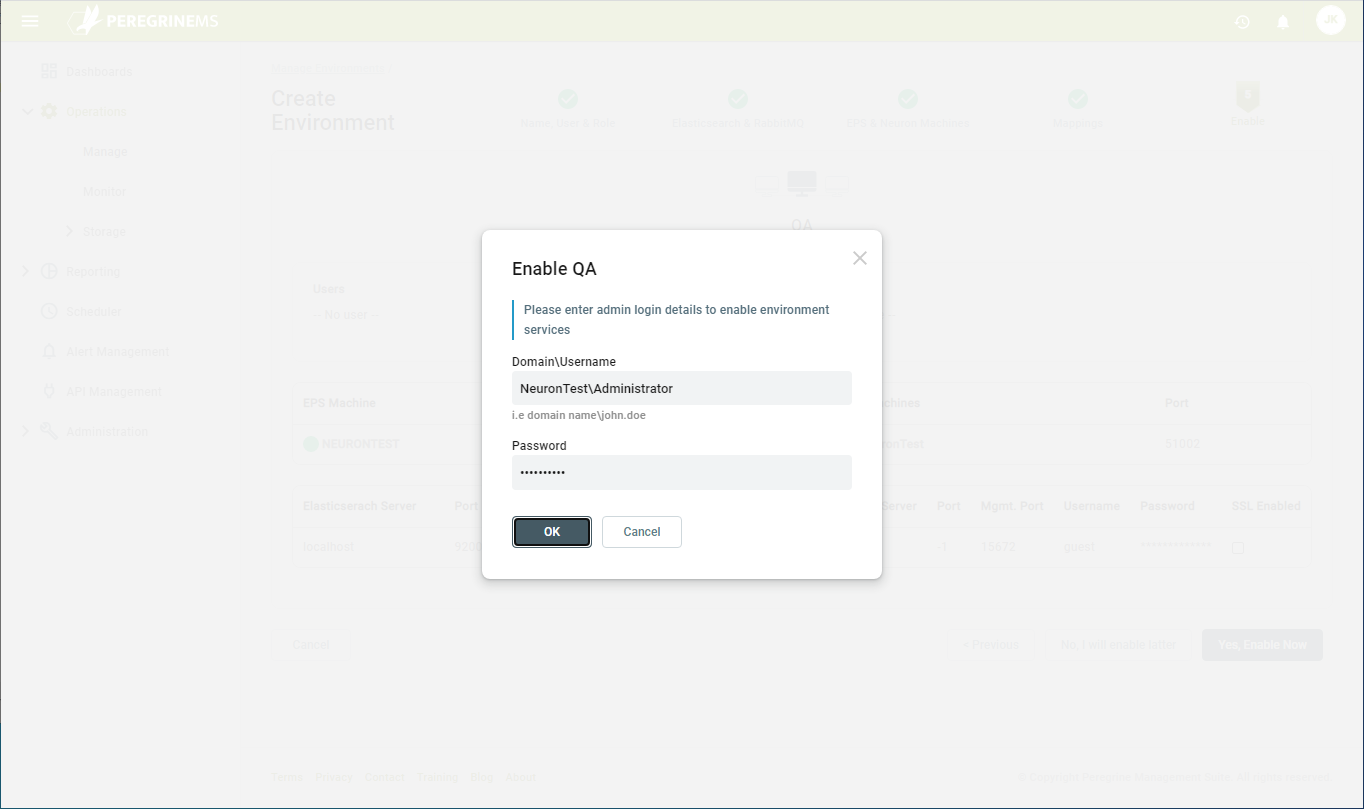
Click OK after entering the credentials. You will be notified if the entered credentials do not have sufficient rights to perform the necessary tasks. Once the environment is successfully enabled, you will see something similar to this:
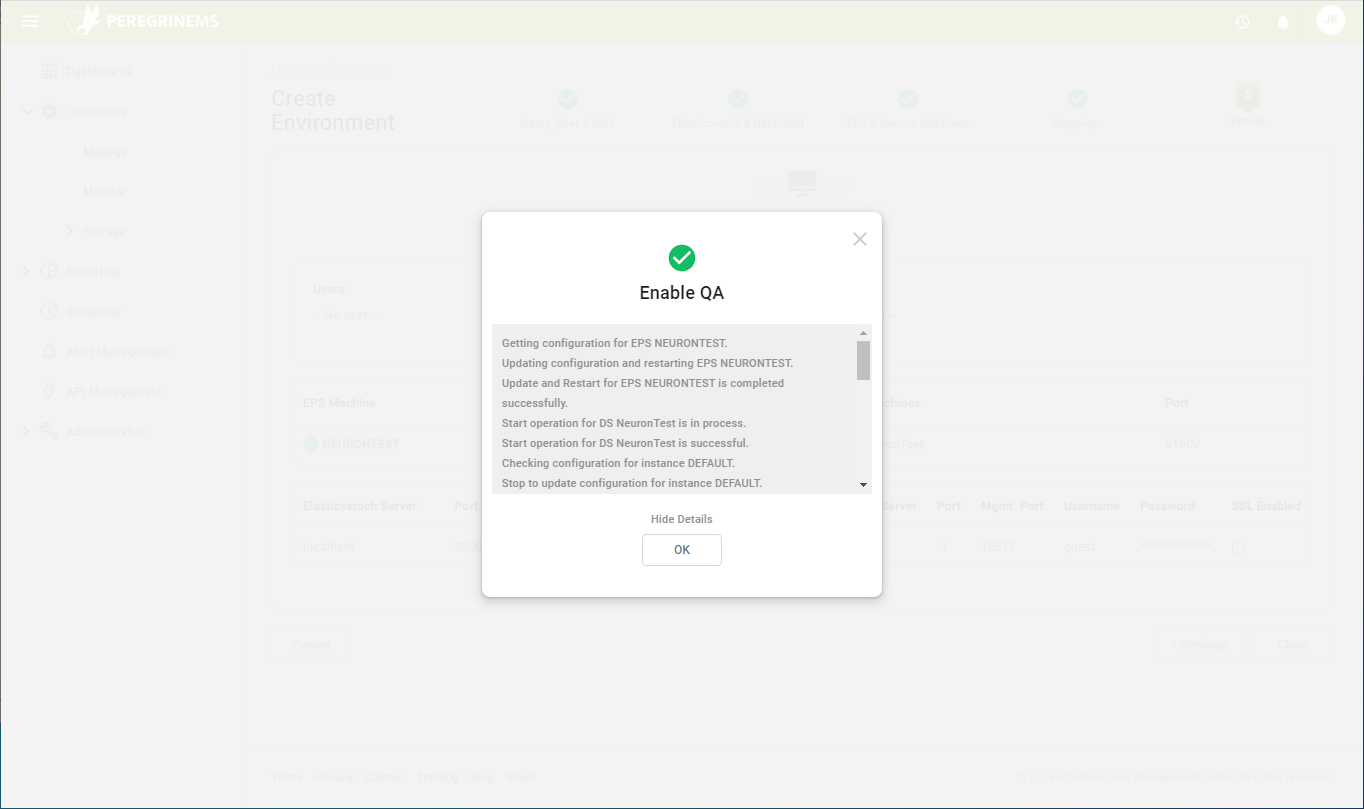
This completes the environment setup.
Note that a Neuron machine and a Neuron Instance can only appear in one mapping and environment.
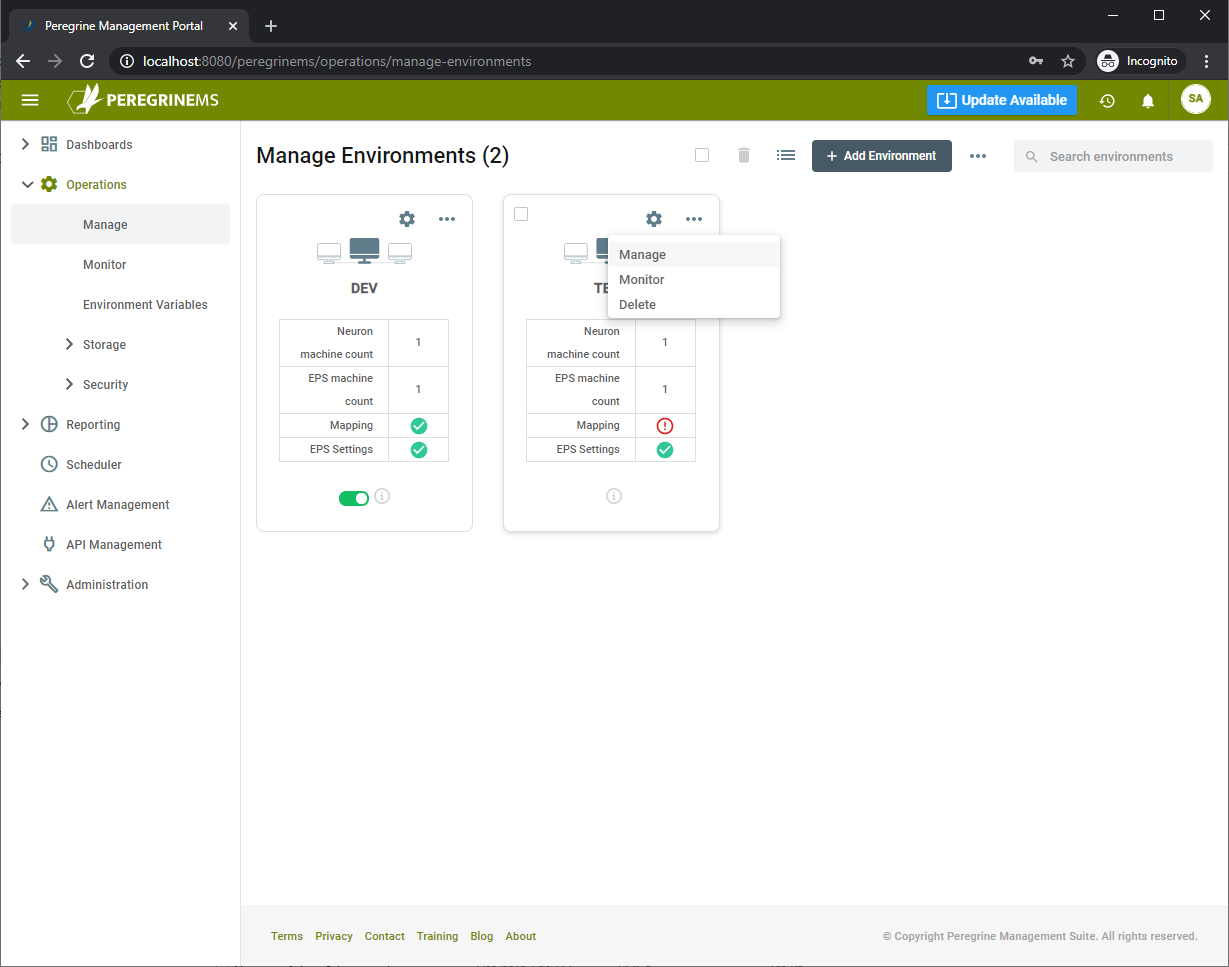
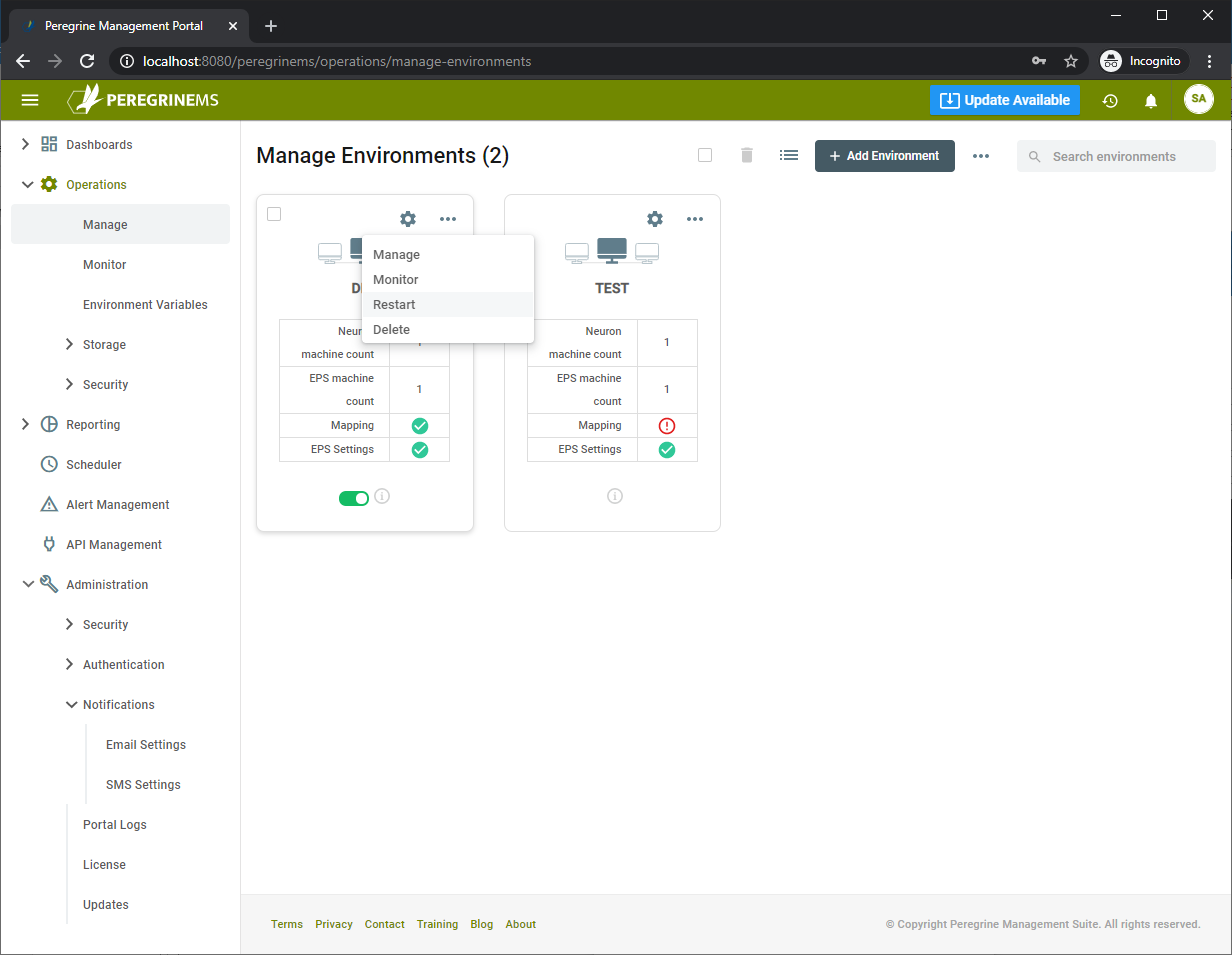
Note that if any of the steps is left incomplete in the above setup wizard, you may return to it by selecting Manage on the Environment as shown below. In these pages, the mapping tab is filled in after the initial environment setup. The environment card shows that mapping is incomplete with an “!” symbol:
Environment Operations
Using Management Suite, an Environment can be stopped, restarted, patched or updated. Also, the runtime application settings of various instances can be updated using the options described below.
You may restart all services in an environment by choosing to restart under the drop-down menu shown below.
To perform various tasks with specific machines in an environment, you can click manage, then go to the specific machine or instance and use its context menu for more options as shown below.
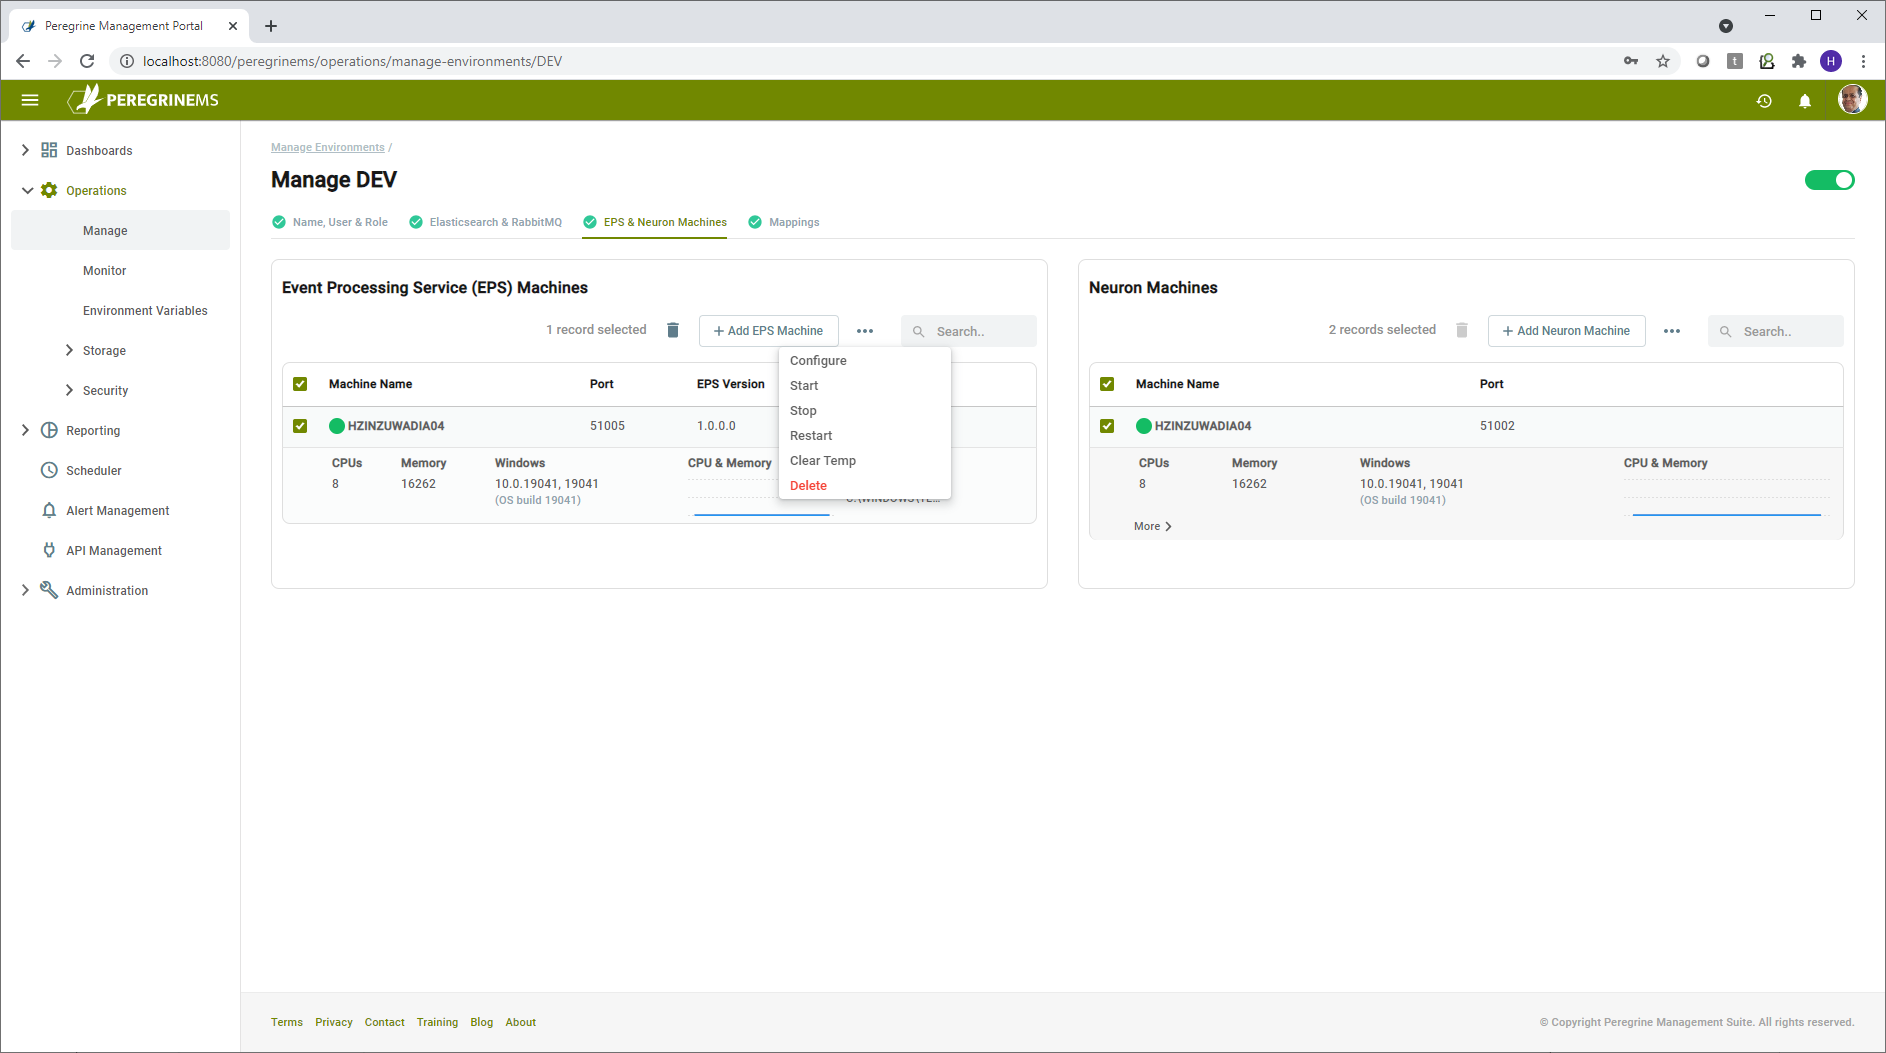
Note that you may perform operations on multiple items by selecting them and using context menu at the top of each panel (Event Processing Service (EPS) machines and Neuron Machines). Some commands such as Install Neuron and Apply Patch can be done only on one machine or one instance at a time. In that case the commands will be disabled at the higher-level context menu.
You may add or delete additional machines for Neuron and EPS using the Add button at top and the delete option in context menu respectively.
The operations Start, Stop, Restart are self-explanatory. Selecting one of these options will prompt for username and password credentials for the respective Neuron or EPS machine. This is required as Management Suite performs remote operations on these machines on your behalf. It uses these credentials to launch local or remote PowerShell scripts on your behalf. It is those PowerShell scripts that perform the starting/stopping of services and other tasks.
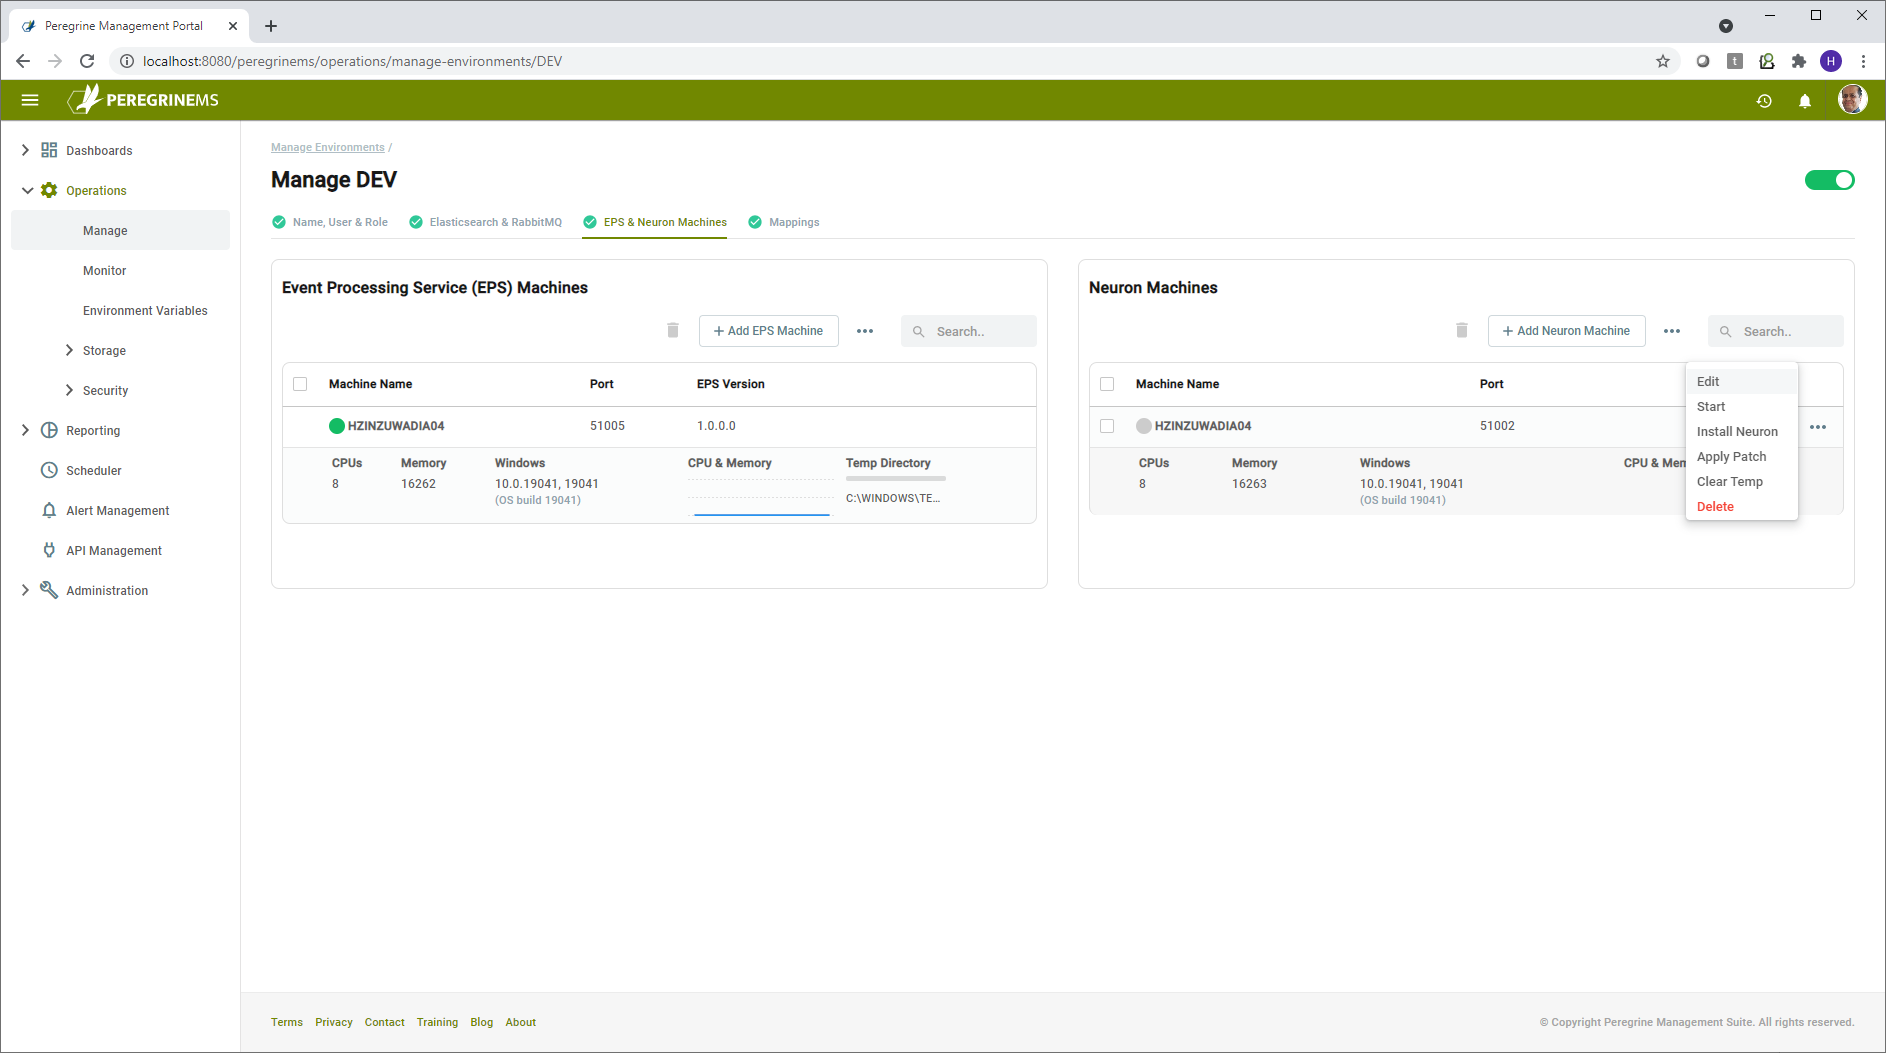
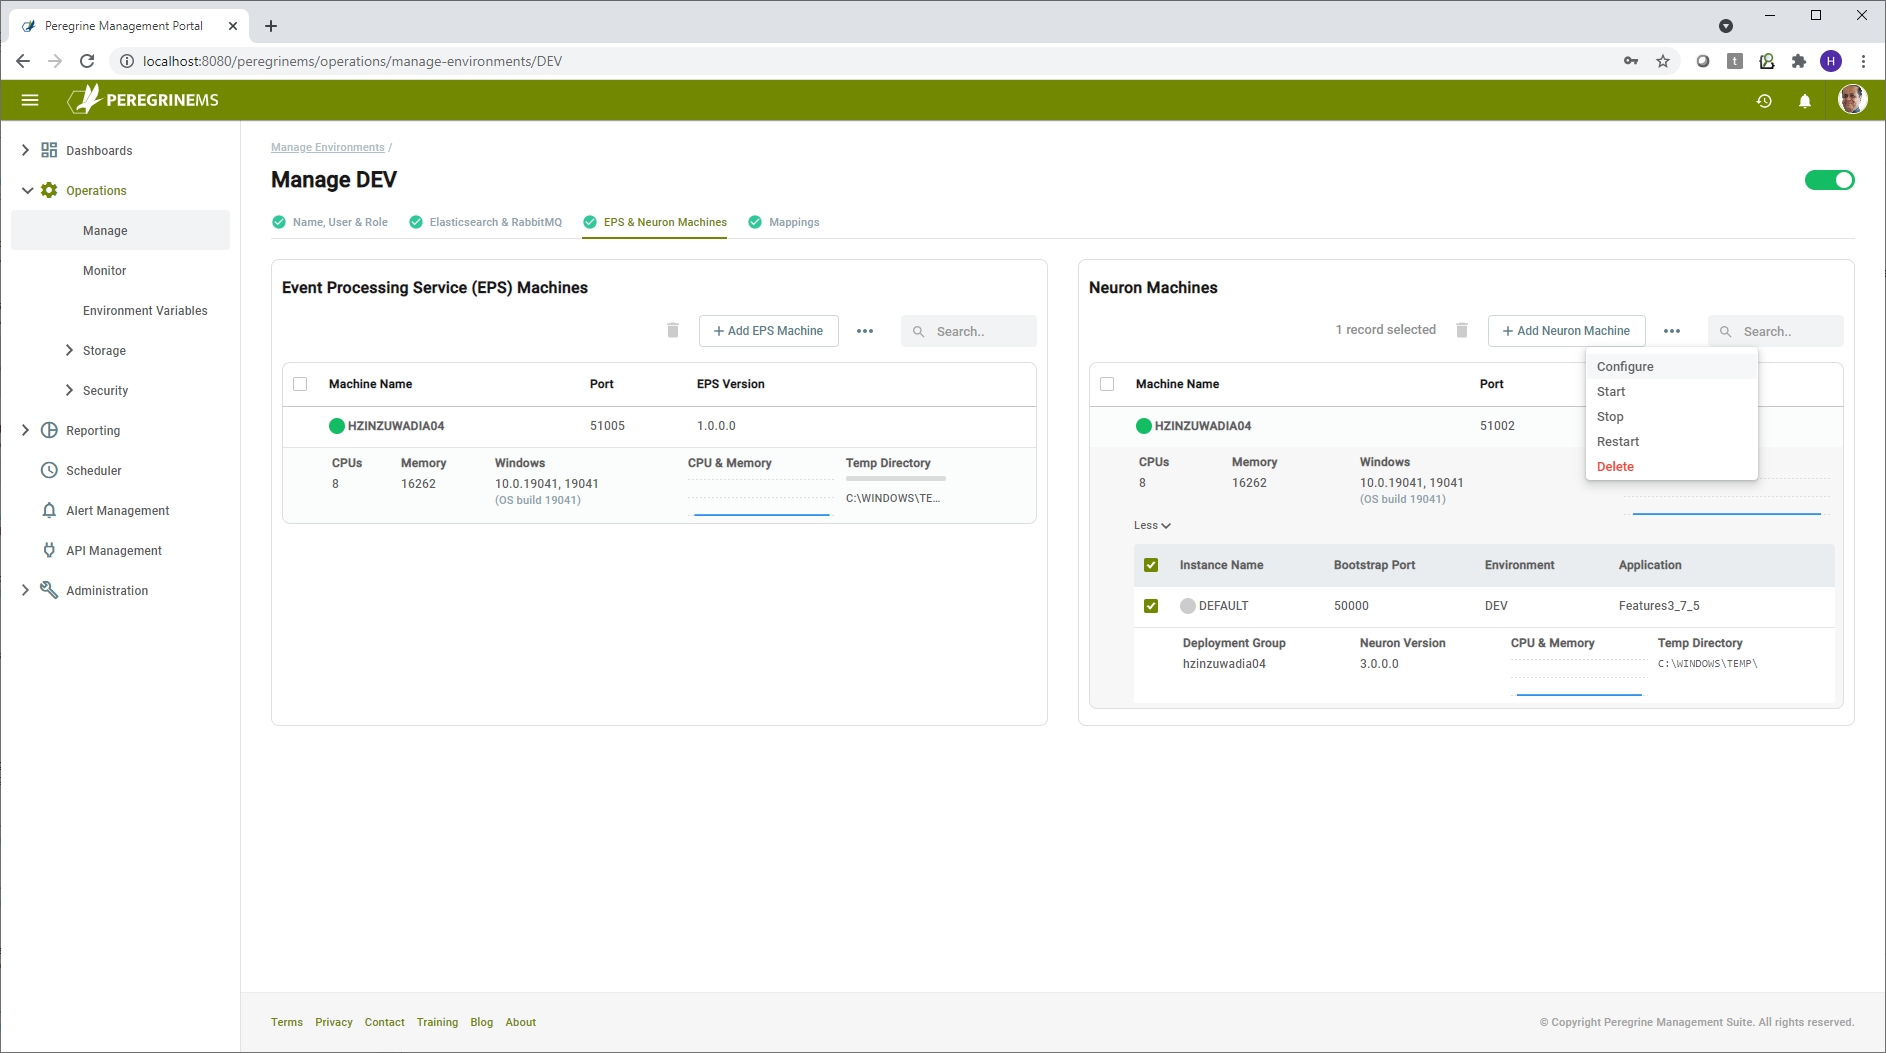
Other context menu items – Neuron Machines
Configure
Using configure instance shown in the page below, you may change the application settings used to launch the Neuron Instance services. Many settings are available to change. Some settings are applicable at machine level whereas other settings are applicable at Instance level.
Machine level configuration settings:
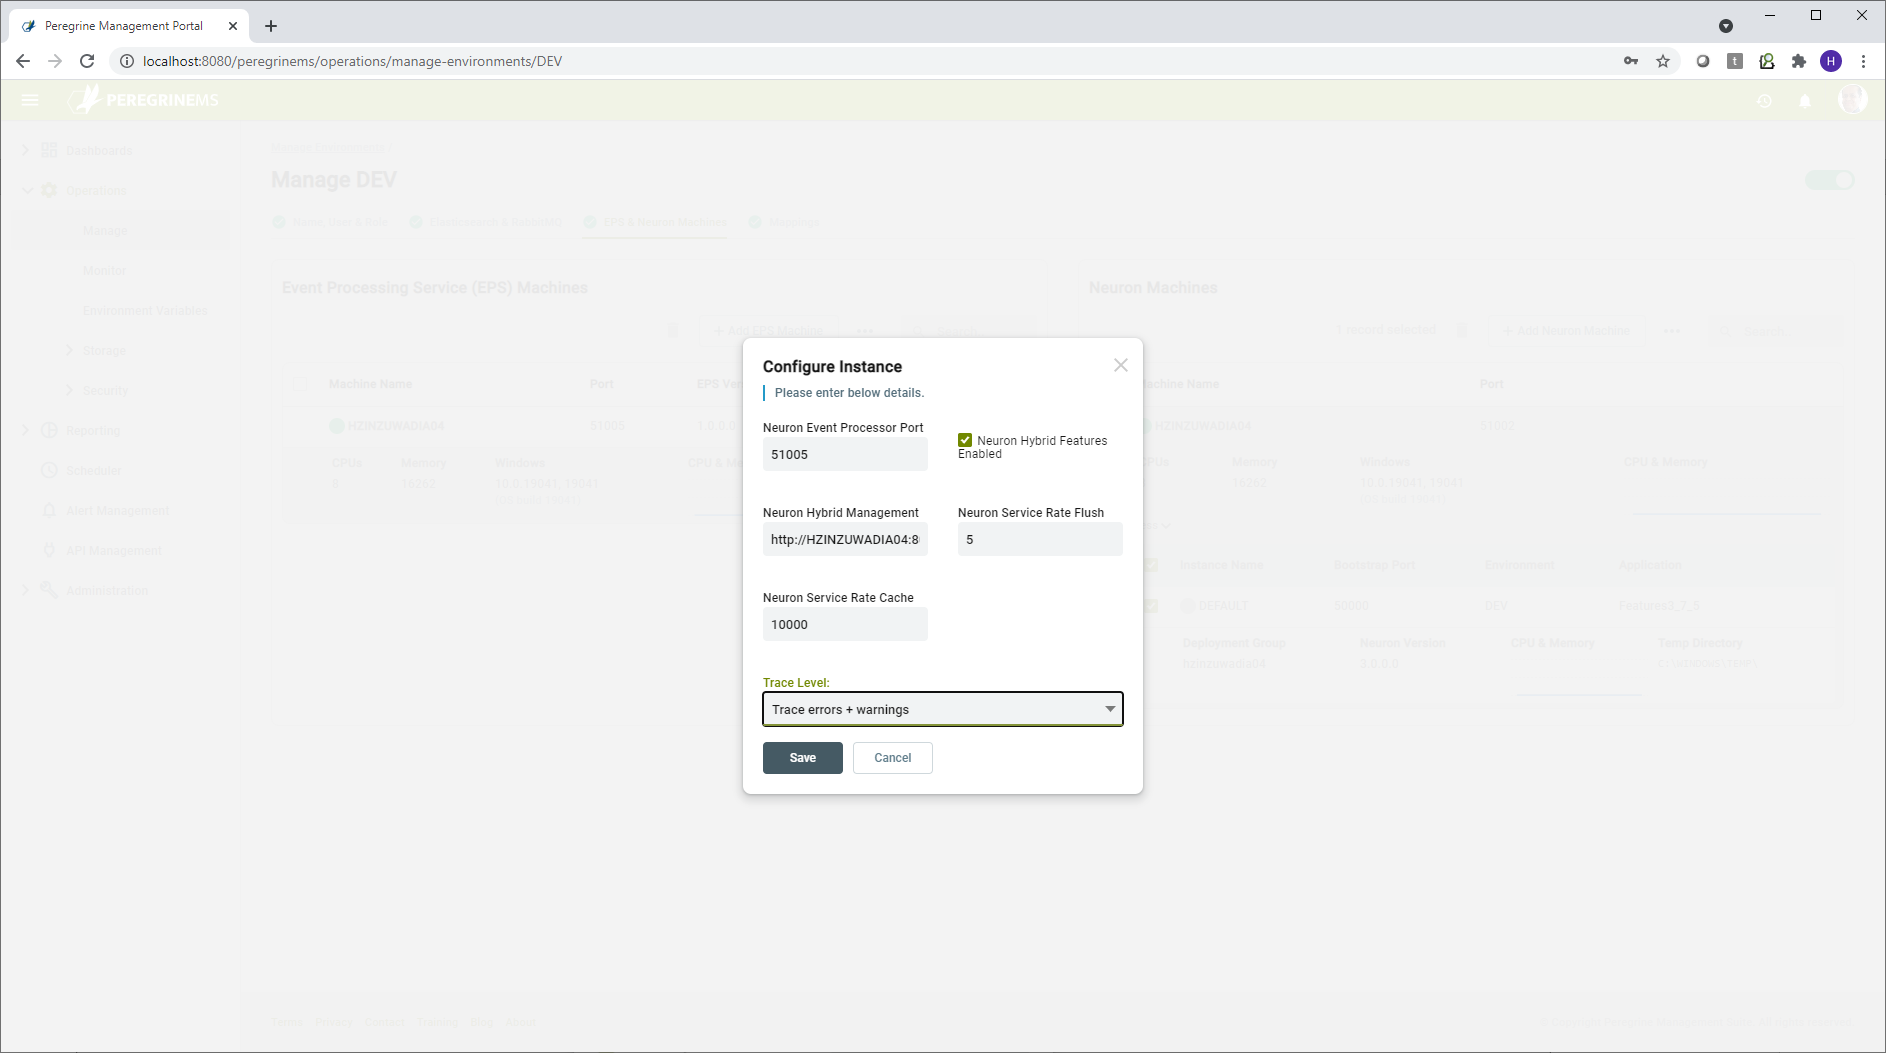
Neuron Event Processor Port – This is the port used by Neuron Event Processor to accept API commands that control start, stop and configuration options for the Neuron Event Processor.
Neuron Hybrid Features Enabled – This setting will generally always be enabled if you are managing Neuron environment with PeregrineMS. Disabling the Neuron Hybrid Features will disable publishing of logs and statistics from Neuron to the PeregrineMS.
Neuron Hybrid Management – This indicates the URL path where the Peregrine MS is installed.
Neuron Service Rate Flush – This is the interval to write the service rate information to PeregrineMS. The value 5 indicates that the service rate information for endpoints will be updated every 5 seconds.
Neuron Service Rate Cache – If under excessive load, too much service rate information is being published, the number of entries processed will be throttled after the pending entries exceed this number.
Trace Level – This setting controls what level of logging is performed by Neuron runtime. More detail logging can be useful for debugging in lower level environments. In production environment, this setting should be set to Errors and Warnings otherwise performance may suffer under load.
Instance Level Configuration settings
Some of the above settings can be overridden at instance level, whereas some other settings below are applicable at the Instance level.
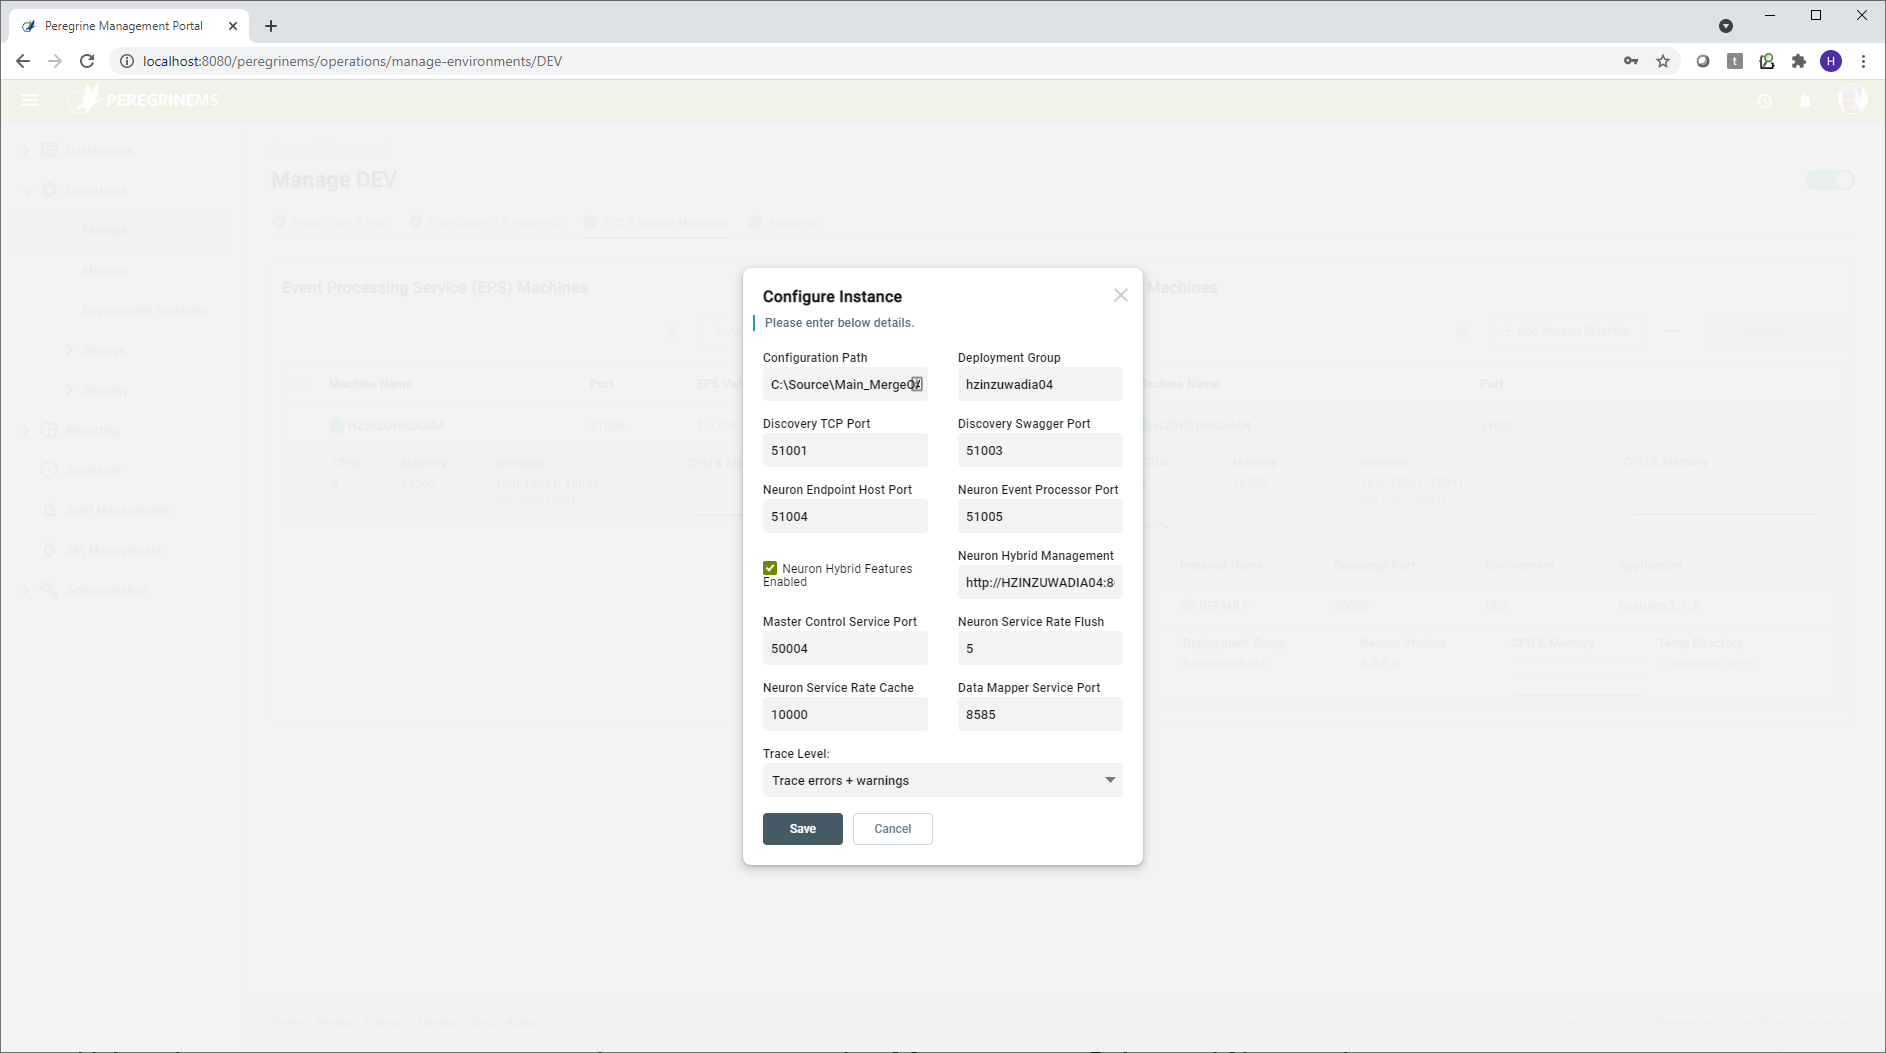
Configuration Path – The location on the Neuron server or File Share where the currently running Neuron solution (application) is stored.
Deployment Group – The Deployment Group in the Neuron solution that is in effect for environment variables and other settings (RabbitMQ, MSMQ, Machines) that depend on the deployment group.
Port Settings
Neuron ESB runs several internal services (REST and WCF) for control of its operations and supplemental services. Following is a description of each of the ports. The default values can be overridden in case the port value is used by some service other than Neuron.
Discovery TCP port – This port is used to control Neuron Operations from Neuron Operations API. PeregrineMS uses this port to retrieve information about the running instance. This is a REST/HTTP port.
Discovery Swagger port – This port is used to make the swagger documents associated with client connectors accessible to the consumers of Neuron Client Connectors. This is a REST/HTTP port.
Neuron Endpoint Host port – This port is used to send commands to Neuron Endpoint Host from Management Suite (such as start, stop, restart of endpoints). This is a REST/HTTP port.
Neuron Event Processor port – This port is used to send commands to Neuron Event Processor from Neuron ESB instance (such as start, stop, restart). Neuron ESB instance attempts to start the Event Processor service when it is started. This is a REST/HTTP port.
Master Control Service port – This port is used send commands to Neuron ESB Instance from Management Suit (such as start, stop, restart endpoints, endpoint hosts etc.). This is WCF TCP/IP binding port.
Data Mapper Service port – The data mapper service provides the mapping between JSON/XML formats when invoked from maps used in business process or service route tables. The data mapper service port is used for sending requests from Neuron ESB runtime to the data mapper service via REST/HTTP calls.
Clear Temp Files
Temp files are created when using some adapters as well as during Neuron ESB operations. Using this option, you can clear out the temp files to free up space and speed up operations. Temp files should be cleared out weekly.
Install Neuron
Using Management Suite, you can launch a Neuron Installation on remote machines, provided you have an account with permissions on the remote machine. When this option is selected, you point to a file share location where Neuron Install Media is located, and the installer is launched on the remote machine.
Apply Patch
Using Management Suite, you can apply patches to Neuron installations on remote machines, provided you have an account with permissions on the remote machine. When this option is selected, you point to a file share location of Neuron Patch Install Media and the patching is performed on the remote machine.
Other Context Menu Items – Neuron Event Processor
Configure
Neuron Event Processor has some settings that you can tune to improve performance under very high loads. You can change the values of these settings when you select this option. Neuron Event processor basically gets the various logs and performance entries that have been published to RabbitMQ and writes them to Elastic Search Indexes. Management Suite monitoring displays all the monitoring information from these Elasticsearch Indexes.
Cache Flush Interval – This is the time interval between writes to Elastic Search.
Cache Size – If the number of entries remaining to be processed exceed the cache size, the Event Processor throttles retrieval of messages from RabbitMQ where Neuron ESB instances are publishing them.
Consumer Count – The number of event processor consumers that run in parallel to retrieve RabbitMQ messages and write them to the Elastic Search.
Elasticsearch Batch Size – This setting controls how many entries are written to Elastic Search in one batch. If you are auditing very large messages than the batch size needs to be decreased. If you have very high load with smaller message, then the batch size can be increased.
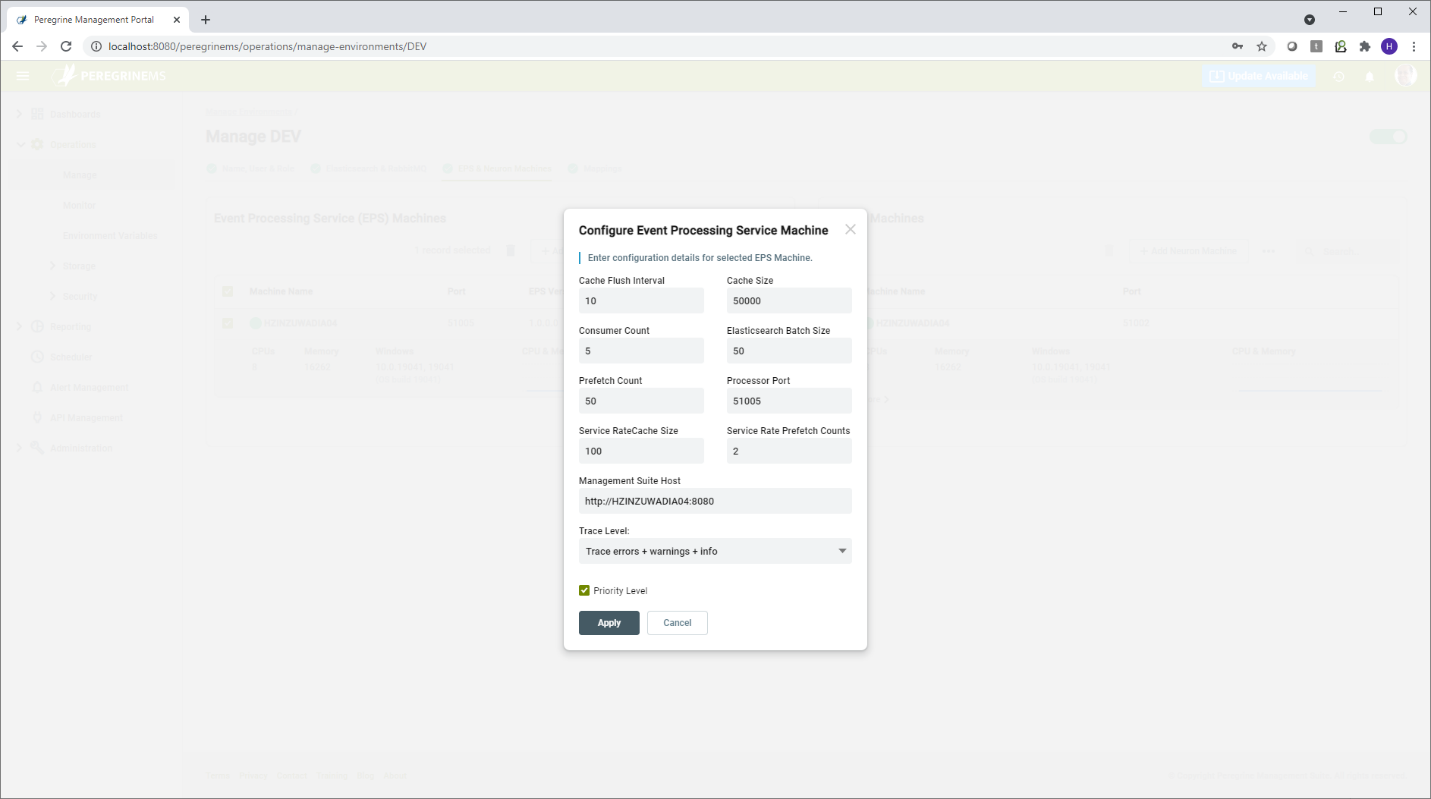
Prefetch Count – This setting applies to Audit messages only. It specifies how many messages are dequeued from RabbitMQ. Higher values of this settings can improve performance but if there is any failure then some messages may end up being delayed or lost.
Processor Port – This port is used to control the Event Processor remotely by PeregrineMS and Neuron ESB runtime. Using this port, commands to start, stop, reconfigure, clear temp files etc. can be sent to the event processor machine by the PeregrineMS. This port is a REST/HTTP port.
Service Rate Cache Size – Service rate can generate many entries under high load, and you may want the Service Rate entries to be prioritized. In that case the Service Rate cache size can be increased if you want to prioritize or decreased if you want other items to take precedence under load.
Service Rate Prefetch Count – This setting is like Prefetch count except that it is specific to Service Rate Information messages. Increasing the Service Rate prefetch count can help with performance under load but the reliability or accuracy of service rate information may be reduced if there are errors and failures.
PeregrineMS Host – This setting is updated automatically when the PeregrineMS provisions the Event Processor while setting up the environment. It is rarely required to change this setting. (like DNS name change of PeregrineMS Host machine.)
Clear Temp Files
Temp files are created during Neuron Event Processor operation. Using this option, you can clear out the temp files to free up space and speed up operations. Temp files should be cleared out weekly.
Storage
Using these pages, you can monitor, backup and purge the storage space for Management Suite and Neuron Instances. Storage space is allocated to SQL server and Elastic Search. You can monitor the disk usage on these pages. You can also configure backup, restore and purging of data using these pages. For optimal performance, old data in Elastic Search and SQL server needs to be regularly archived (backed up and purged).
Backup and purge may be run on-demand, or you may schedule them at recurring intervals. Create the backup and purge jobs for the storage of Management Portal as well as each of the configured environments. When you select backup data, data after the backup remains in the original store. When you purge data, it creates an archive and removes the data.
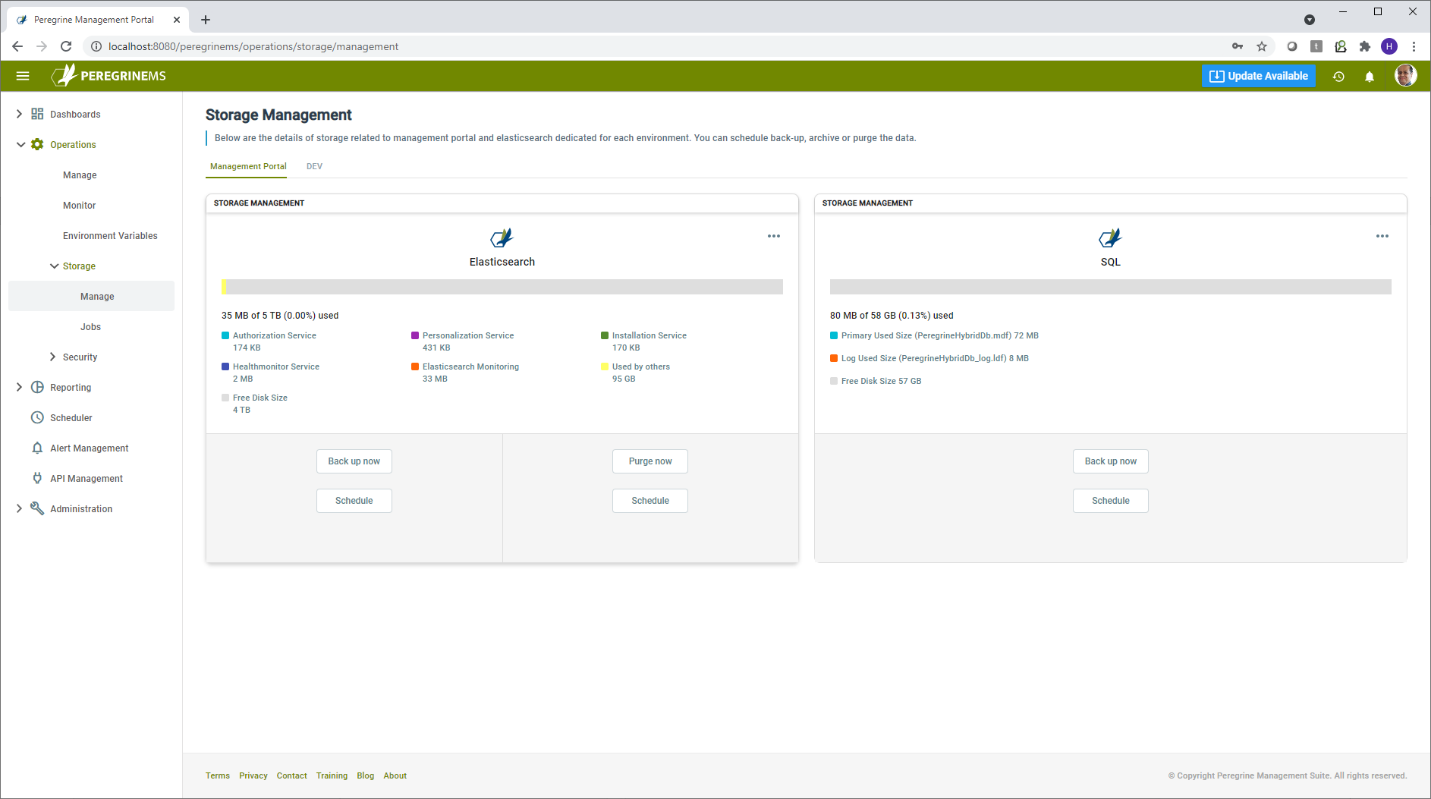
Manage
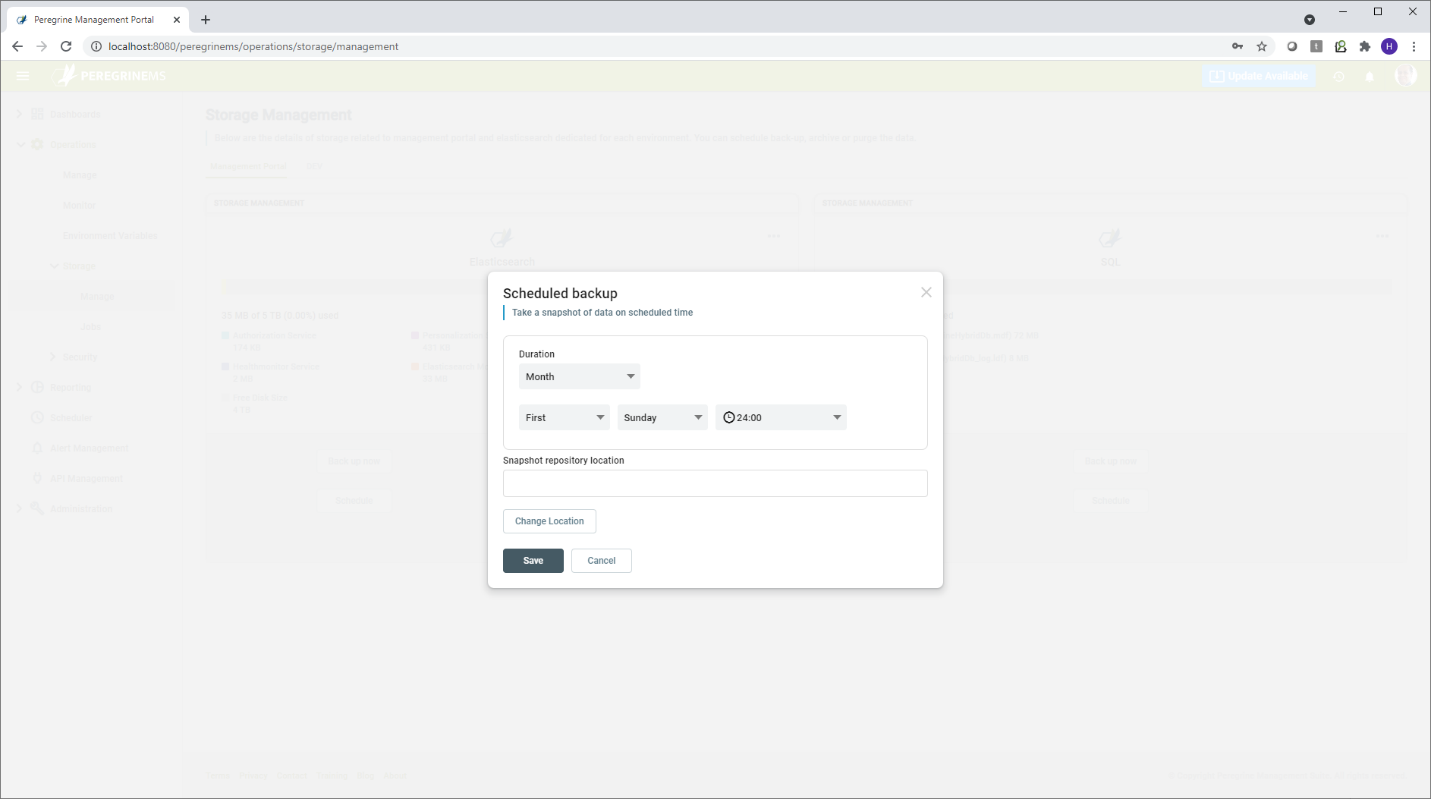
The following screen shows the initial state when the backup jobs are not yet scheduled. Using the schedule button, you can schedule the backup or purge jobs. When scheduling a job, you need to enter the frequency the job runs and the storage location. You can choose between monthly, weekly and daily. The storage location can be a UNC path for Elasticsearch, but it needs to be a locally mapped drive for a SQL server backup.
Once the job is scheduled, you can view/edit details to change the schedule or storage location.
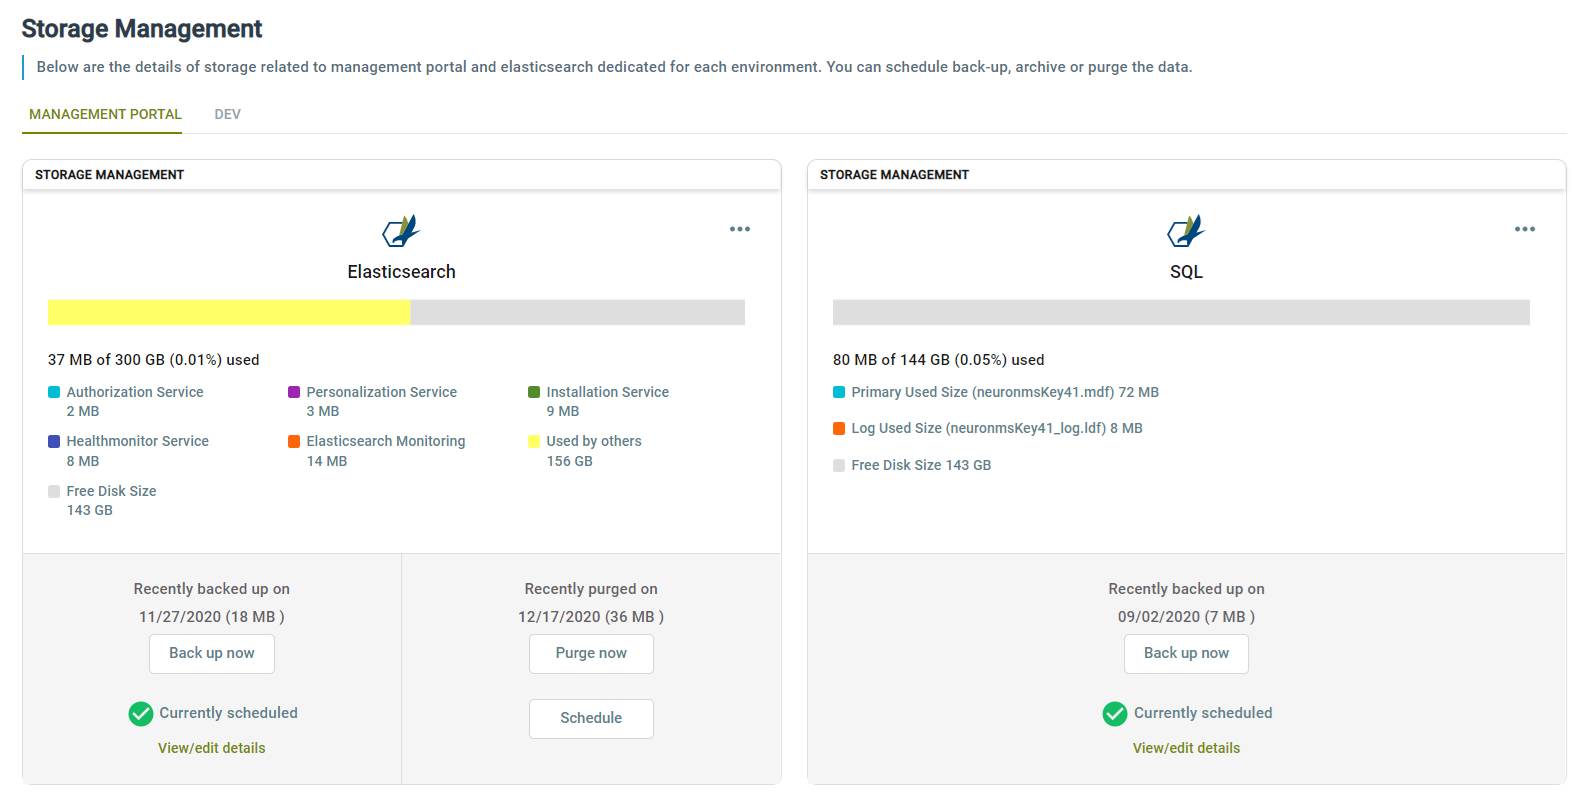
Other actions are backup now to run backup immediately. You can also purge old data using Purge now. You are prompted to select a timeframe to purge from and whether or not to backup that data before it’s purged (i.e., archive). You can also schedule a recurring purge job. Note that the purge options apply only to Elastic Search.
The Jobs item under the Administrator menu refers to the system jobs for backup, purge and archive. This page lists the history of completed or failed jobs. Using this page, you can restore from backup or delete scheduled jobs, history and old backups that you no longer need.
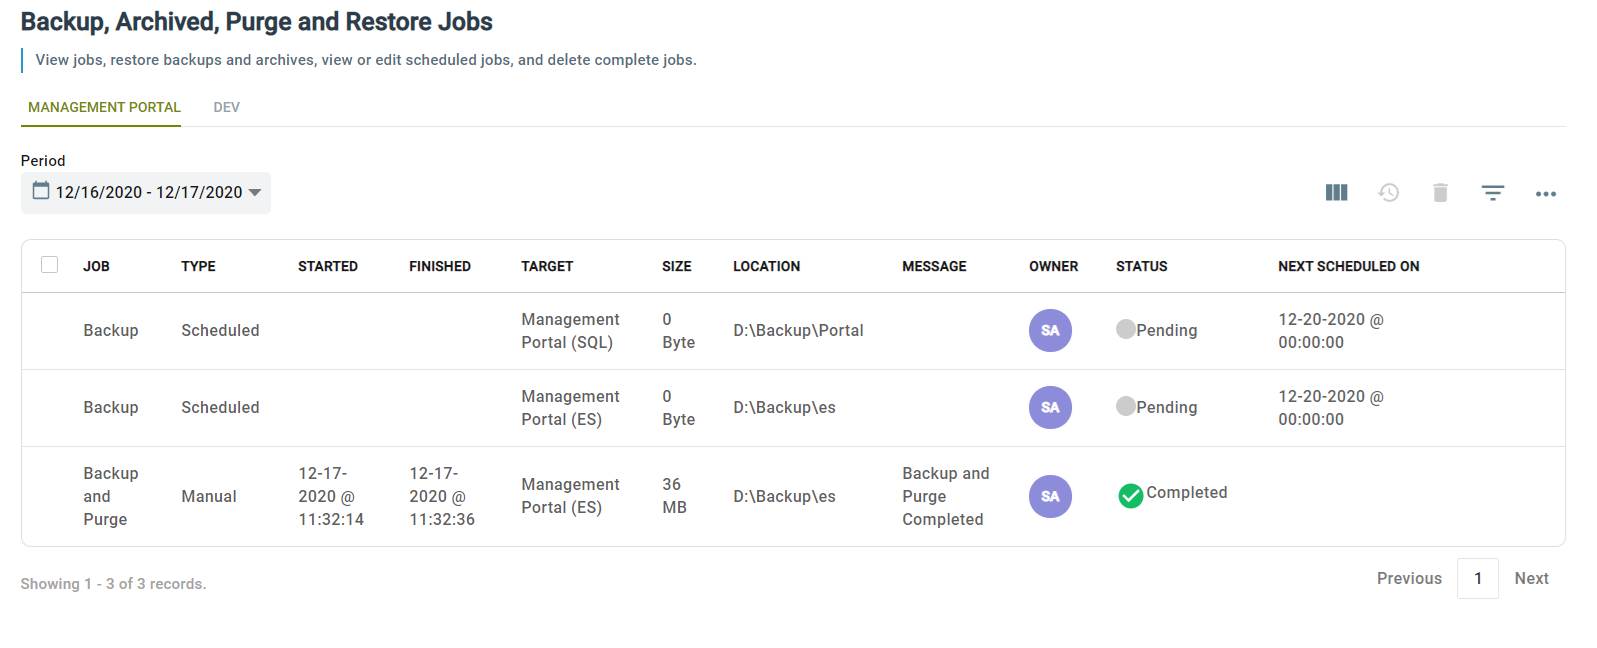
Job – Shows the job Backup/Purge or Both
Type – Scheduled or Manual
Started – Date and time job was started
Finished – Date and time job finished
Target – Whether the job is for SQL or Elastic Search
Size – Size of the backup file created
Location – Location of the backup file
Message – Any message from job execution
Owner – Name of person who created the job
Status – Status of the job, Pending, Completed, Failed
Next Scheduled On – For scheduled job the next time the job is scheduled to run.