Neuron ESB 3.7.5 Released!
Neuron ESB 3.7.5 is being released in conjunction with the release of the Peregrine Connect Management Suite 1.1. As an integral part of the Peregrine Connect Integration Platform, Neuron ESB provides critical runtime facilities and features that collaboratively simplify the design, deployment, and management of an organization’s enterprise integration needs.
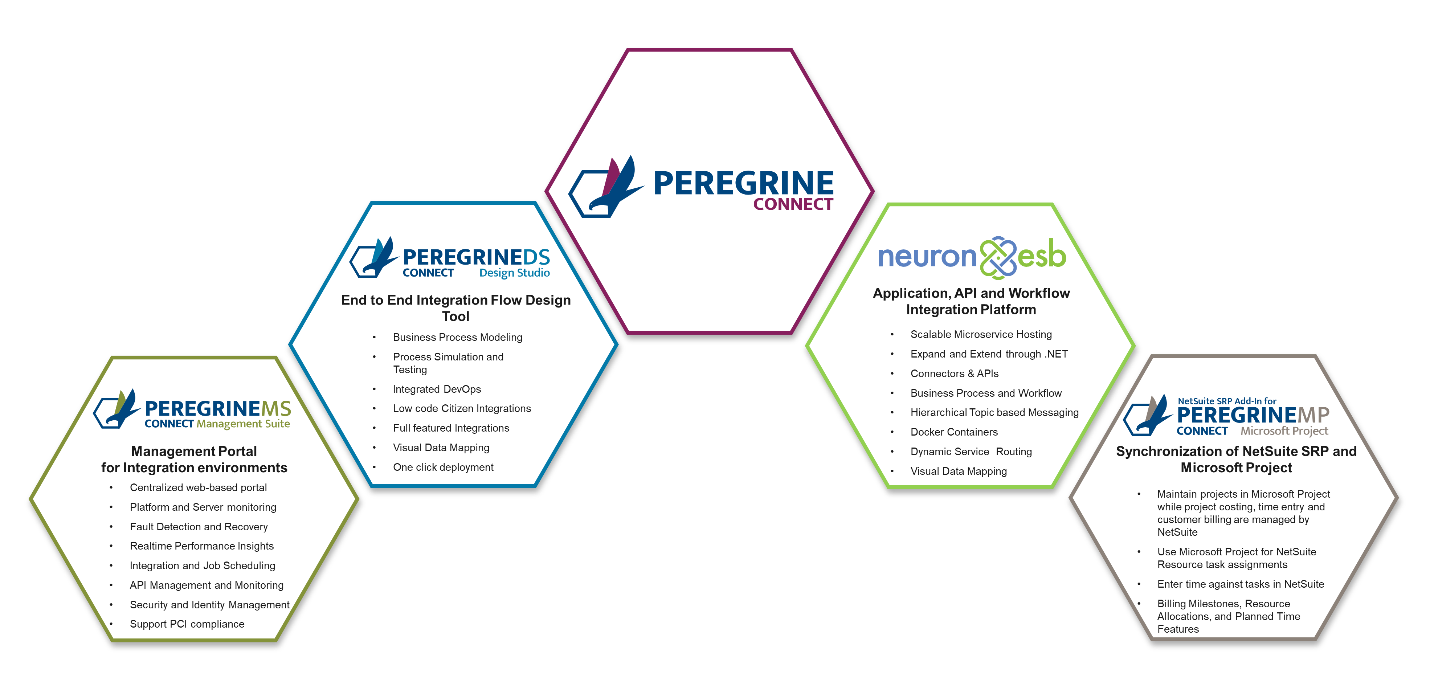
The Peregrine Connect Integration Platform provides a suite of applications that helps organizations meet any integration demand – from on-premise and cloud applications to various data sources and devices. Using the Peregrine Connect Integration Platform any number of workloads can be simplified, deployed, and monitored; from API Management and automated Workflow to scheduled integration flows and Alerting and Notifications.
This release introduces an array of new and complimentary capabilities within Neuron ESB and the Management Suite. Neuron ESB 3.7.5 generates the necessary event data that allows the Management Suite to effectively monitor environments while delivering Alerting and Notifications, API Management, Scheduling, and other features to organizations looking to accomplish their application integration, workflow automation, and API management goals.
If you’re using previous versions of Neuron ESB today, please download the Neuron ESB 3.7.5 setup to update your existing installation. Current customers can obtain either the Patch or the full installation from the Neuron ESB Support website. If you are new to Neuron ESB, you can download the full installation from the Peregrine Connect website.
Neuron ESB 3.7.5 adds some exciting new features to the Peregrine Connect Integration Platform, some of which include:
- Graphical Data Mapping
- Containerization of Endpoints
- Service Routing Tables
- Client-Side OAuth Providers
- Business Process Scheduling
- Wiretap Tracing Neuron ESB Messages
- Rabbit MQ Quorum Queues
All the changes included in the Neuron ESB 3.7.5 release can be found in the Neuron ESB Change Log, which gets installed with Neuron ESB. This article focuses on the major feature additions as well as their Peregrine Connect Management Suite counterparts.
Graphical Data Mapping
Overview
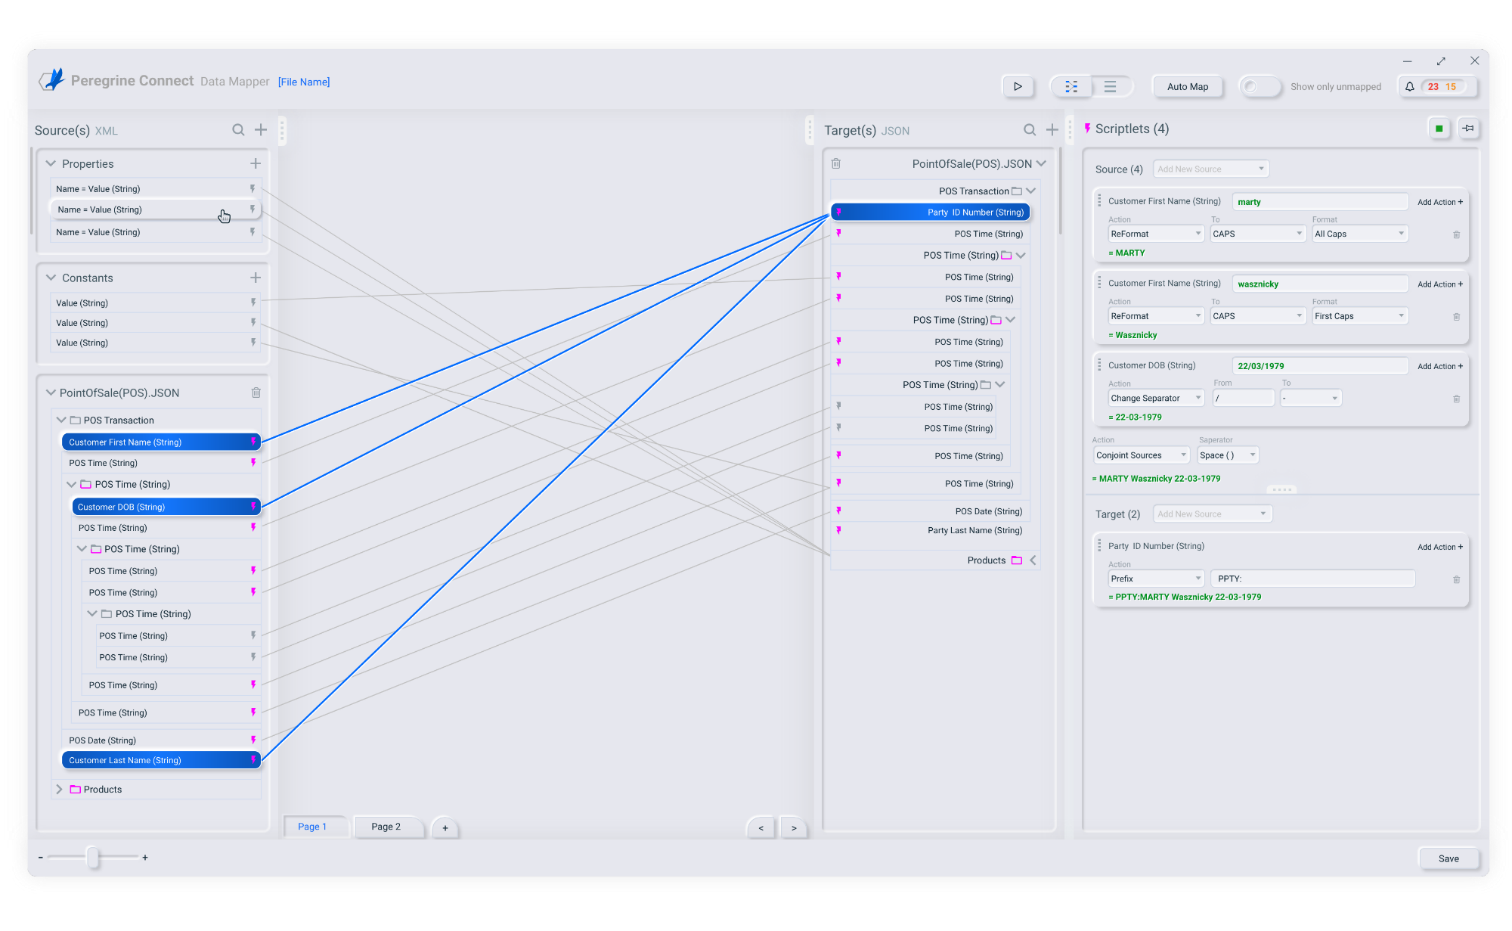
The Peregrine Connect Data Mapper is a new graphical tool that ships with Neuron ESB 3.7.5 to visually create data maps from source document schema or sample to target document schema or sample. It also serves as a tool to extract and define custom Neuron ESB Message properties used in Business Processes, Workflows, Service Endpoints, and Adapters. A Data Map created using the Data Mapper is a JSON structure. It contains the definition of the source and target documents and links between the source fields/custom properties and target fields/custom properties. Environment variables and constants can also be used in a Data Map.
Data mapping is a crucial design step in data migration, data integration, and data transformation projects. It includes mapping data fields from a source format to a target format. Every company deals with massive amounts of data coming from many sources. The data may reside in different formats, and organizations need a powerful, user-friendly tool such as Peregrine Connect Data Mapper to map between data formats. The Data Mapper accelerates the data mapping process and makes it user friendly for business users. It enables businesses to extend their integration and automate/evolve their business processes.
The Data Mapper provides an interactive user interface that simplifies configuring integrations between XML, JSON, and CSV file data sources and targets. You can design your data mapping with the Data Mapper UI canvas and then execute the Data Map via the Neuron ESB runtime engine. Data Maps are stored in the Neuron ESB Solution repository. They can be configured and executed at runtime from Service Routing Tables, Business Processes, and Worfkflows.
Data maps can range from simple to complex based on the type of hierarchical data structure that source or target schemas represent and the complexity of conversion rules that the target application requires for successful data integration. Data maps can also include multiple source documents that will be merged or joined prior to mapping the result to a target document.
With its drag and drop interface, the mapper can be used by non-technical users. Click and drag a source field onto a target field and your mapping is done. If there is a need to apply additional rules on the map, you can use the built-in functions to transform the data per your business rules. Built-in functions include math, string, conditional, and type conversions.
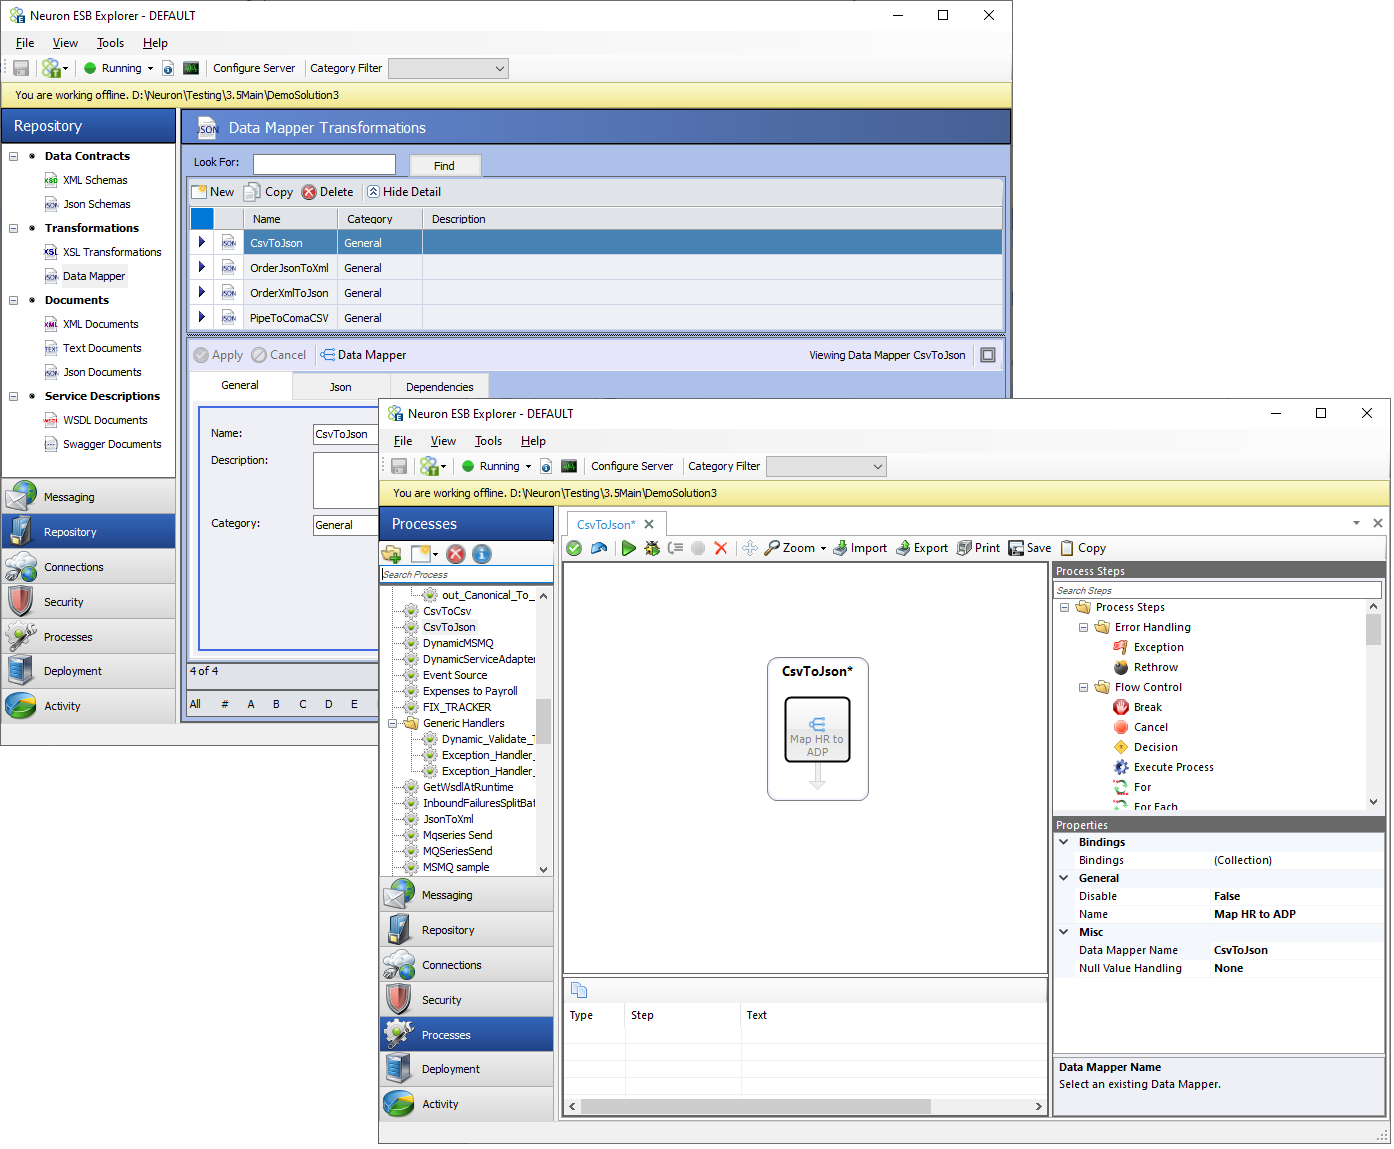
The Peregrine Connect Data Mapper can be configured using either the Repository Menu option as shown below or by double-clicking on a Data Mapper Process Step within a Neuron ESB Business Process or Workflow. Both options will launch the visual Data Mapper.
The Peregrine Connect Data Mapper supports several exciting features with a focus on usability, some of which are listed below:
- End to end Testing of a Data Map
- Testing of individual Field Transformations
- Library of Transformations
- Expressions
- Auto Mapping
- Paging
You can learn more about the Peregrine Connect Data Mapper by visiting Data Mapper Documentation site.
Containerization of Endpoints
Previous versions of Neuron ESB provided organizations a Microservice hosting model. However, Neuron ESB 3.7.5 takes a giant step toward Microservice Deployment by supporting Containerization at the endpoint level.
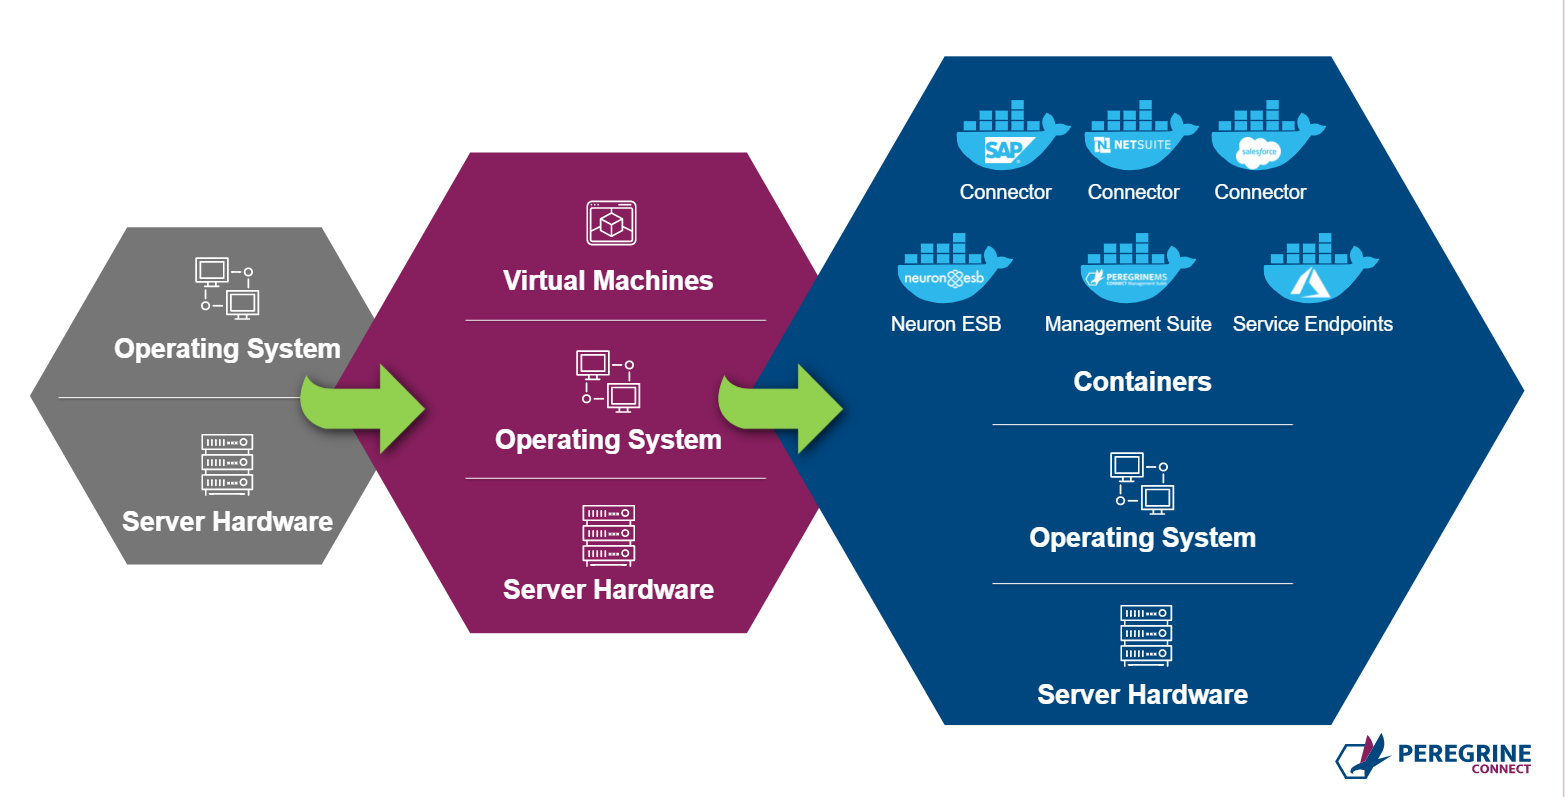
Neuron ESB 3.7.5 has been built on the principal of SOA and Microservices. Hence it is the natural choice to build Microservice-based APIs. In previous versions of Neuron ESB, organizations could easily create REST APIs or SOAP-based services. However, in this release, they can now control the deployment aspect of it as well. Using Neuron ESB 3.7.5, organizations can now choose to run a service (or group of services) as a fully independent service that can be scaled in or out based on consumption using platform services like Docker or Kubernetes.
Some organizations may deploy their applications in a Docker or Docker Swarm host or deploy them to the Kubernetes service. The Neuron ESB runtime and Endpoint Hosts can be deployed individually in Docker to Windows containers on Windows (WCOW). The Neuron ESB database is also capable of being hosted in a Docker container. Neuron ESB 3.7.5 includes an SQLExpress Docker container image for development and testing purposes. However, in production scenarios, organizations are expected to bring their SQL server setup (container or without container) to host the Neuron ESB database. A RabbitMQ container image is also made available with Neuron ESB 3.7.5 to support the Event Processor and Neuron ESB Rabbit MQ based Topics.
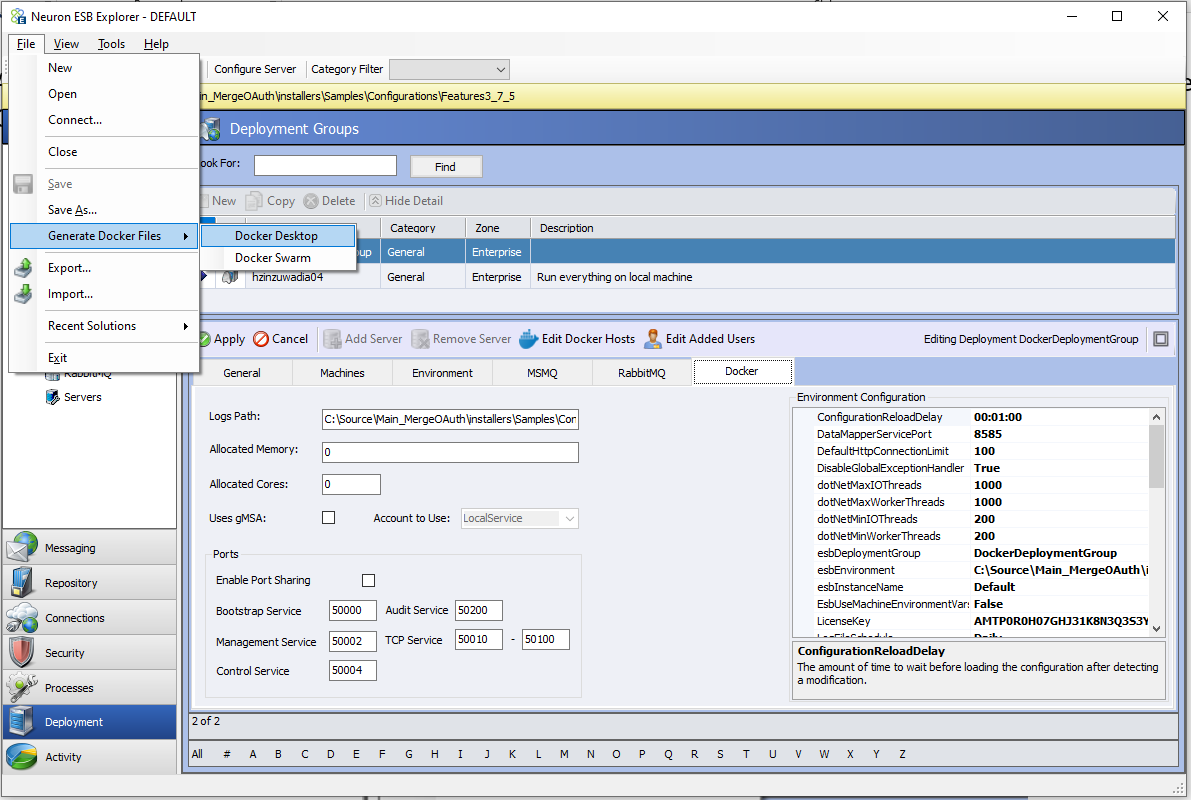
Running Neuron ESB in Docker requires additional configuration to Deployment Groups, Endpoint Hosts, Database Settings, and Security Credentials. Once the solution is configured to run in Docker, the generate Docker files menu option in the File Menu of the Neuron ESB Explorer can be used to generate Docker Compose files from the Neuron ESB Solution. The Docker Compose files can then be deployed to Docker to run a Neuron ESB image that is pulled from Docker Hub.
Neuron Solution
To support the containerization of endpoints, a few new objects have been added to the Neuron ESBSolution. These need to be configured in Neuron ESB Explorer if running Neuron ESB in containers.
Deployment Groups
The “Docker” tab will be visible if the Deployment Group has the “Run in Docker” option enabled. Almost all the configuration for running in Docker is done at the Deployment Group level.
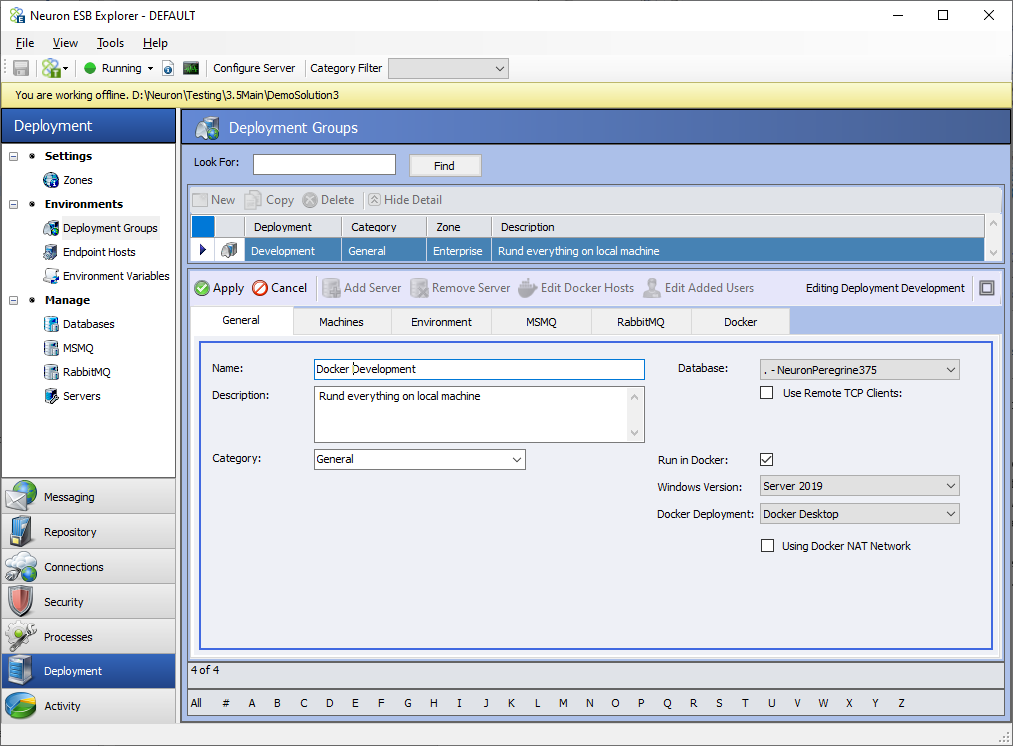
The “Run in Docker” option will cause Docker Compose files to be generated for the selected Deployment Group and any Endpoint Host that runs in the Deployment Group when the “Generate Docker Files” option is clicked in Neuron ESB Explorer’s “File” drop down menu.
There is a drop-down box on the General tab of the Deployment Group to choose which version of Windows Server the desired Docker Host will run on. The correct version must be selected for the correct image to be downloaded at runtime. Another drop-down box shows the Docker Deployment mode with two choices: Docker Desktop and Docker Swarm. If this selection is Docker Swarm, certain features under the Docker tab such as allocated memory and allocated cores are not enabled. If the Docker NAT Network is to be used, the check box “Using Docker NAT Network” should be enabled. The Docker NAT Network is the default network that is installed with Docker on Windows.
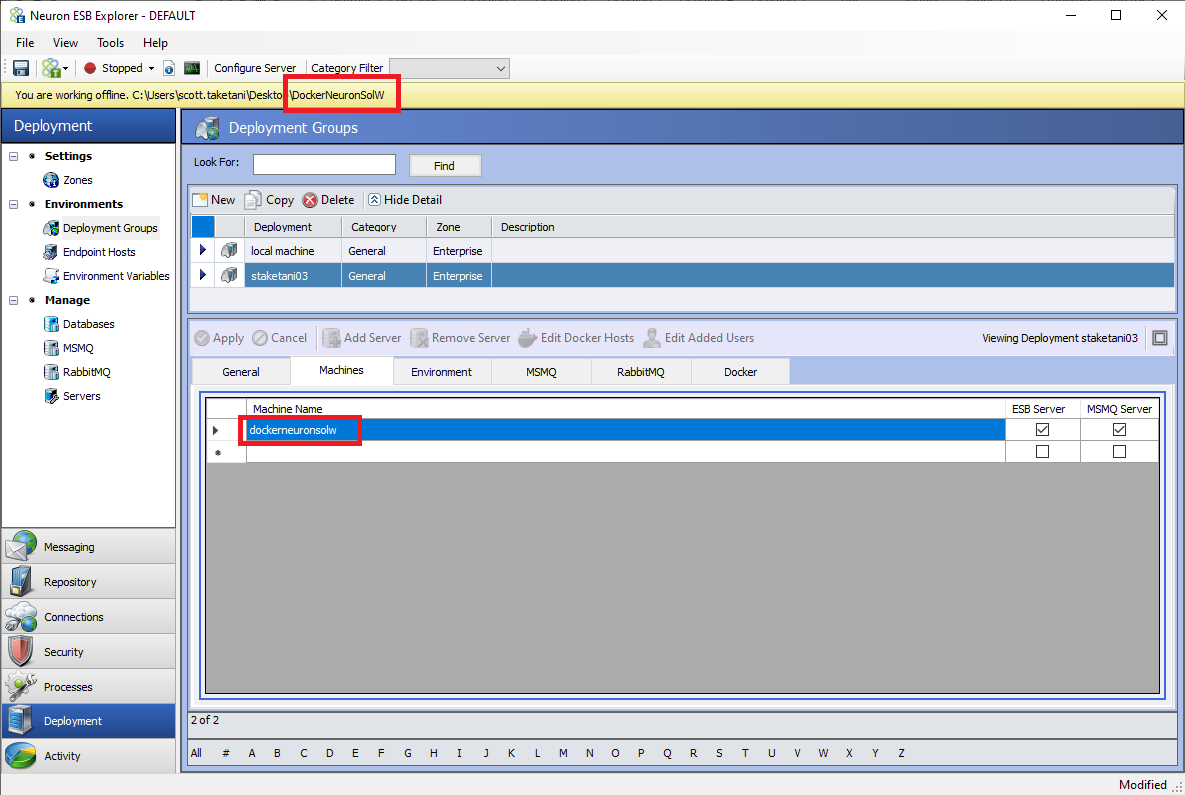
Once the General tab is configured, there should only be one machine listed as an ESB Server under the Machines tab of the Deployment Group as shown below. The ESB Service container’s hostname will be the solution’s name without spaces in the generated Docker Compose files. This name should be entered as the machine name.
Docker Settings
A new tab called “Docker” has been added to Neuron Explorer that is only visible if the Deployment Group’s “Run in Docker” setting is enabled.
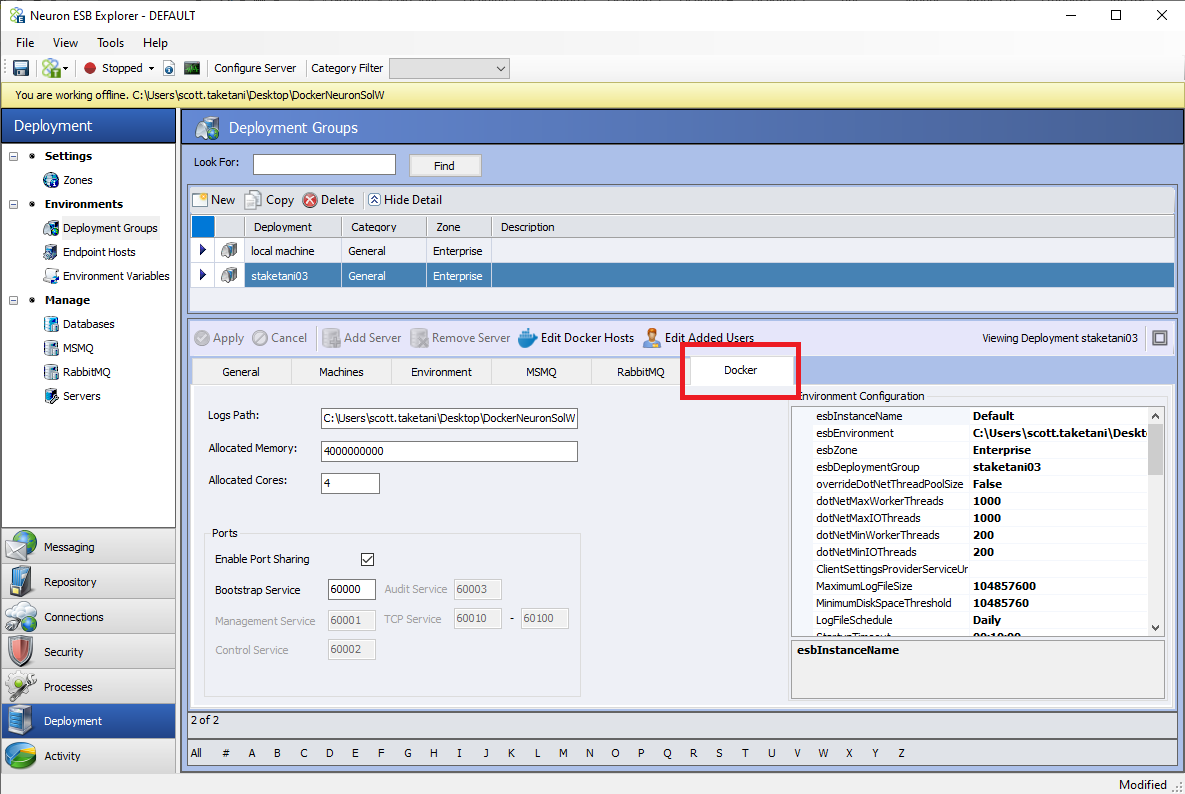
Each setting within the Docker tab is described below:
- Logs Path: This is the directory path local to the Docker Host machine that log files generated by the Neuron containers will be written to. The ESBService’s container will log to this path utilizing the same naming pattern as running in a non-containerized environment. Endpoint Host logs will reside in the same root directory as the ESBService container’s logs except, they will be written to a subdirectory of that root directory called “EndpointHostLogs.”
- Allocated Memory: This is an integer value that will determine how many bytes the ESBService container will be allocated for memory. For information on how to set the Allocated Memory for an Endpoint Host, see the Endpoint Hosts section.
- Allocated Cores: This is an integer value that will determine how many processor cores will be allocated to the ESBService container. For information on how to set the Allocated Cores for an Endpoint Host, see the Endpoint Hosts section.
- Ports: These settings are the same as the port settings in the Zone section of Neuron Explorer. These settings will override the Zone settings when running in a Docker container. That means port settings are configurable by Deployment Group rather than on a solution level when running containerized.
- Environment Configuration: These are the equivalent of the “appSettings.config” file found in the Neuron Instance’s installation directory. For container configuration, you can override all the settings shown here. Refer to the Neuron ESB Documentation for appsettings.
Also, there are two new tool strip buttons called “Edit Docker Hosts” and “Edit Added Users” that are enabled on the Docker tab.
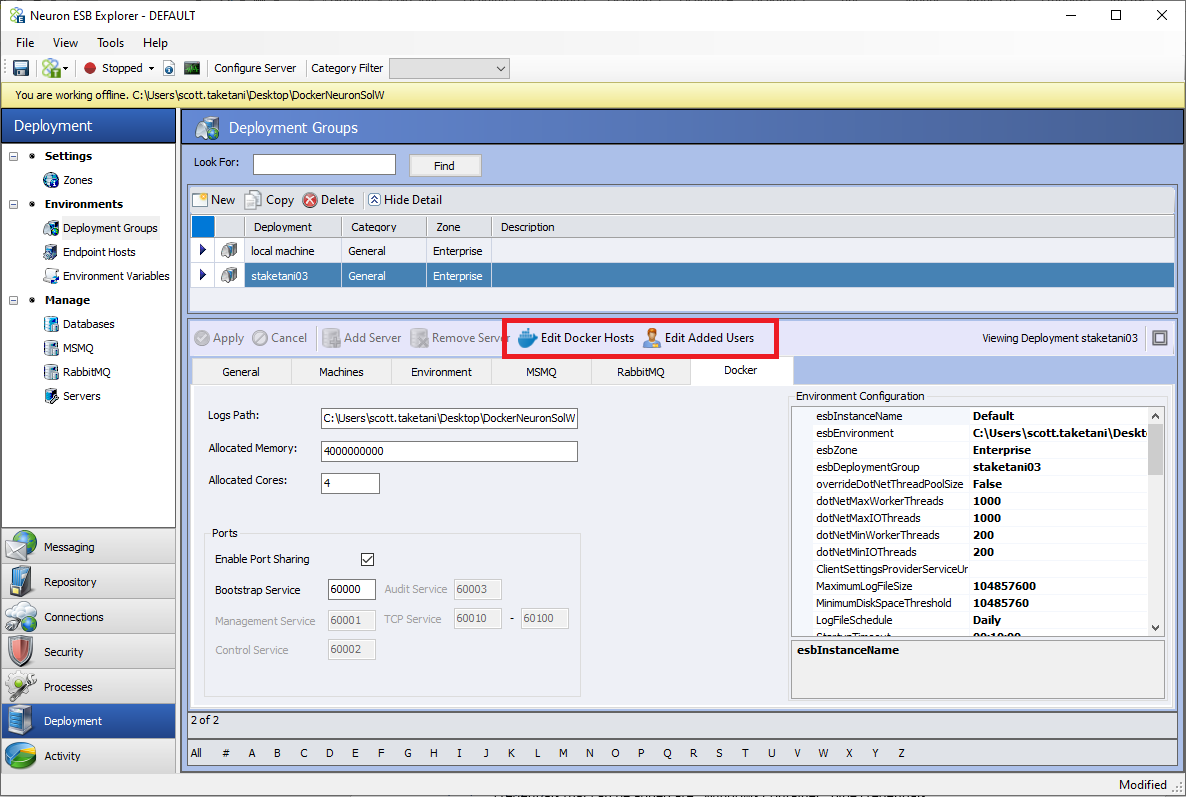
- Edit Docker Hosts: This is where the user should define each Docker Host’s machine name. This is mainly used to determine which machines to query for the Endpoint Health screen in Neuron Explorer.
- Edit Added Users: This is where users can define which credentials to add to the container on startup. The credentials are defined in the Security area in Neuron Explorer. The only type of credentials that can be added are “Windows Container” type credentials.
The purpose of adding these users to the container’s Windows Users and Groups is mainly for connecting with Neuron Explorer in online mode. The Neuron credentials added to the list are added to the chosen Windows Group (i.e., either “Users” or “Administrators”) inside the container.
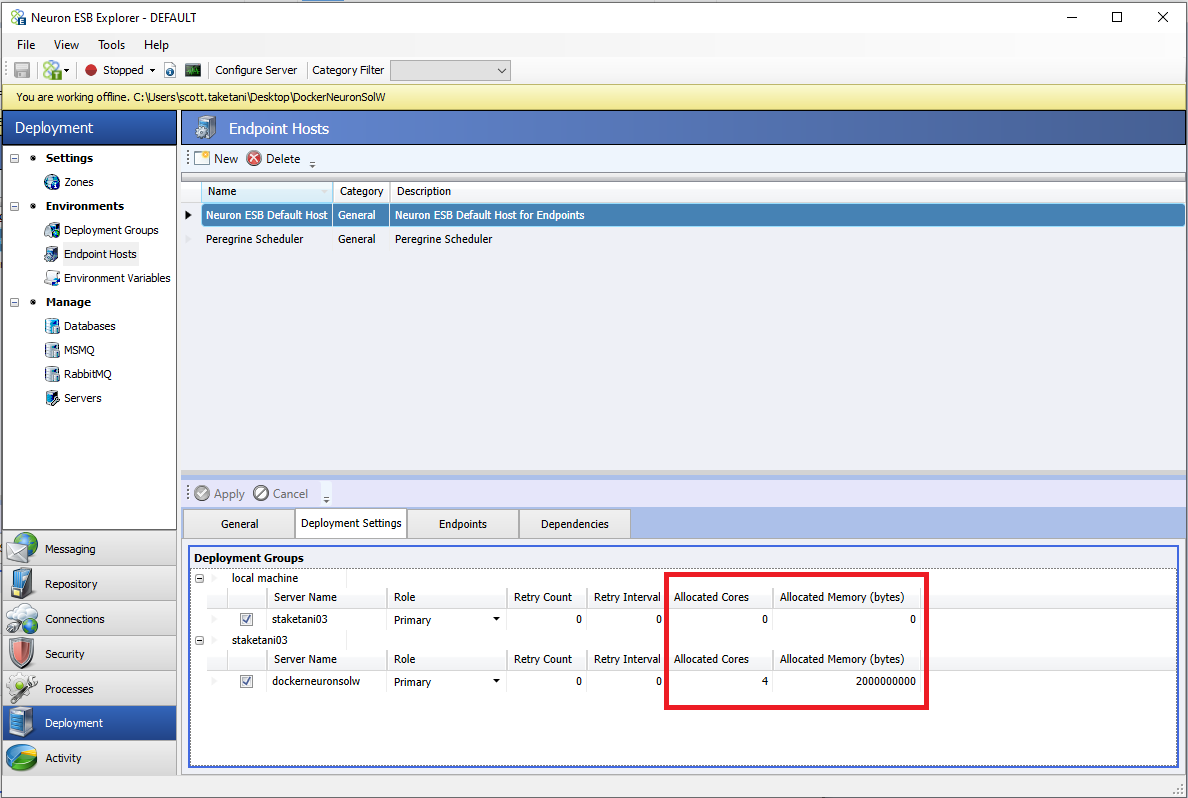
Endpoint Hosts
One of the key advantages of running Neuron ESB in containers is that each Endpoint Host can run in their own isolated, individual container. Organizations can assign any number of endpoints to an Endpoint Host regardless of type. For Endpoint Hosts, there are two new settings defined when mapping to deployment servers. The settings are “Allocated Cores” and “Allocated Memory.” The “Allocated Cores” setting defines how many of the Docker Host machine’s cores are allocated to run the Endpoint Host’s container when running on the mapped Docker Host machine for that Endpoint Host. “Allocated Memory” is how much memory will be available, in GB, to the Endpoint Host container. The Docker Compose file that is generated will contain these settings.
Database
A few new options have been added to the Database settings in Neuron ESB Explorer. These are required because the database server hostname can be different when running in a container alongside the Neuron ESB containers, as opposed to if the database server is runs on a different machine than the Docker Host.
Settings
- Server: This should be the name of the machine hosting the SQL Server instance (if running in a container on a different host machine than Neuron, this should be the host machine’s name and port, if not 1433, that was mapped from the SQL Server container to the host machine).
- Authentication: The authentication method used for the desired SQL Server.
- Bypass Settings Validation on Apply: If enabled, when the Database settings are applied using the “Apply” button in Neuron Explorer, the standard database settings validation is skipped. This is useful when the SQL Server is unavailable when the settings are applied (e.g., the container running the database server is not up).
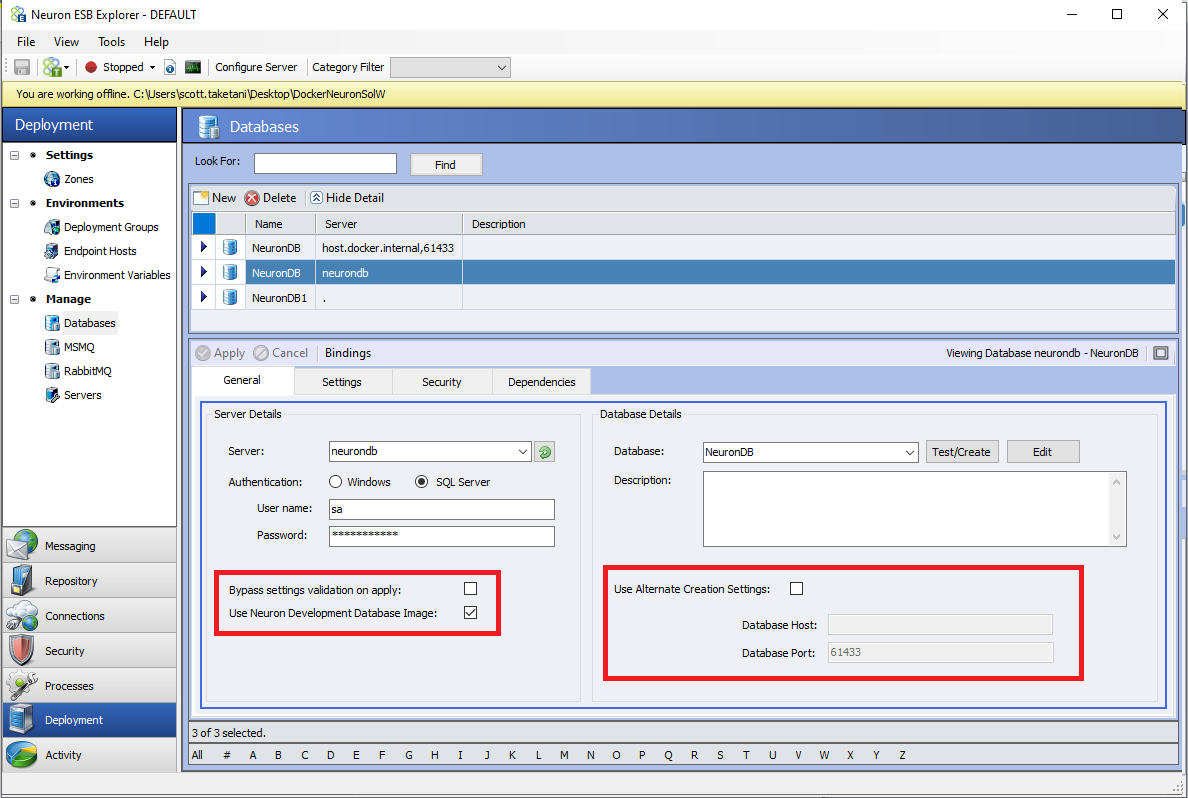
- Use Neuron Development Database Image: see the section below on using the development Neuron SQL Express image for details.
- Database: The name of the database to be used/created.
- Use Alternate Creation Settings: This enables different settings for the SQL Server host and port when using the “Test/Create” button to create the database. This should be used in the situation that the SQL Server hostname supplied in the “Server” text box is different than what should be used to test/create the database from where Neuron Explorer is being used. An example of this scenario would be that Neuron Explorer resides on machine “A” while the SQL Server container and Neuron container are running on machine “B” in the same instance of Docker. This is because the “Server” setting is used during runtime to create the connection string that is used to communicate from the Neuron container to the SQL Server container whereas the Alternate settings are used only when Neuron Explorer is creating the database.
Creating the Database
Normally, database creation is done by Neuron ESB Explorer using the “Server” setting in the connection string. This is fine when Neuron ESB Explorer can reach the database using the same connection string as the Neuron ESB runtime. But suppose the runtime connection string differs from the connection string used to create the database, as in the scenario described under “Use Alternate Creation Settings” above. In that case, alternate settings need to be specified during database creation.
Also, when using the Development Neuron SQL Express image and running that image in the same Docker container host, alternate settings may be necessary for database creation depending on the version of Docker (versions below 2.4.0.0) since it is the same scenario described above.
After saving the database record, go to the deployment group and select this database. Then generate Docker Files from the file menu. This will create a docker-compose file named like <yourdeploymentgroup>_docker-composedb.yaml in the Neuron ESB Solution folder under the “docker\<Deployment Group name>.
You need to host this container image before you can use it to Test/Create a database. For hosting that image, you will need to run the following command.
docker-compose -f <yourdeploymentgroup>_docker-composedb.yaml up (Note: Change the file name to the one that is generated for you.)
Using Development Neuron SQL Express Image
The purpose of the Development Neuron SQL Express image is to make it easier for developers to test a Neuron ESB Solution running in a container. This setting, when enabled, will cause the database settings to be automatically filled in when the “Apply” button is clicked in Neuron ESB Explorer. When the Docker Compose files are generated, if the database being used by a Deployment Group has this setting enabled, a Docker Compose file will be generated for a database container as well. This database container will use a Neuron ESB supplied SQL Express image.
Note that the database itself must still be created once in the Development Neuron SQL Express container. This can be accomplished by clicking the “Test/Create” button in Neuron ESB Explorer with the database container running (and accessible by Neuron ESB Explorer). The database’s data files are contained in the Neuron ESB Solution in the “docker\<Deployment Group name>\Database Files” folder. When using the Neuron provided database container, the “Database Files” directory is mounted in the container to the default directory that would normally contain the data files.
Also note that when using the Development Neuron SQL Express image, any changes made to the specified database will be persisted (as well as any changes made to the SQL Express instance itself…e.g. a login created to access the SQL instance will be persisted if the container is restarted).
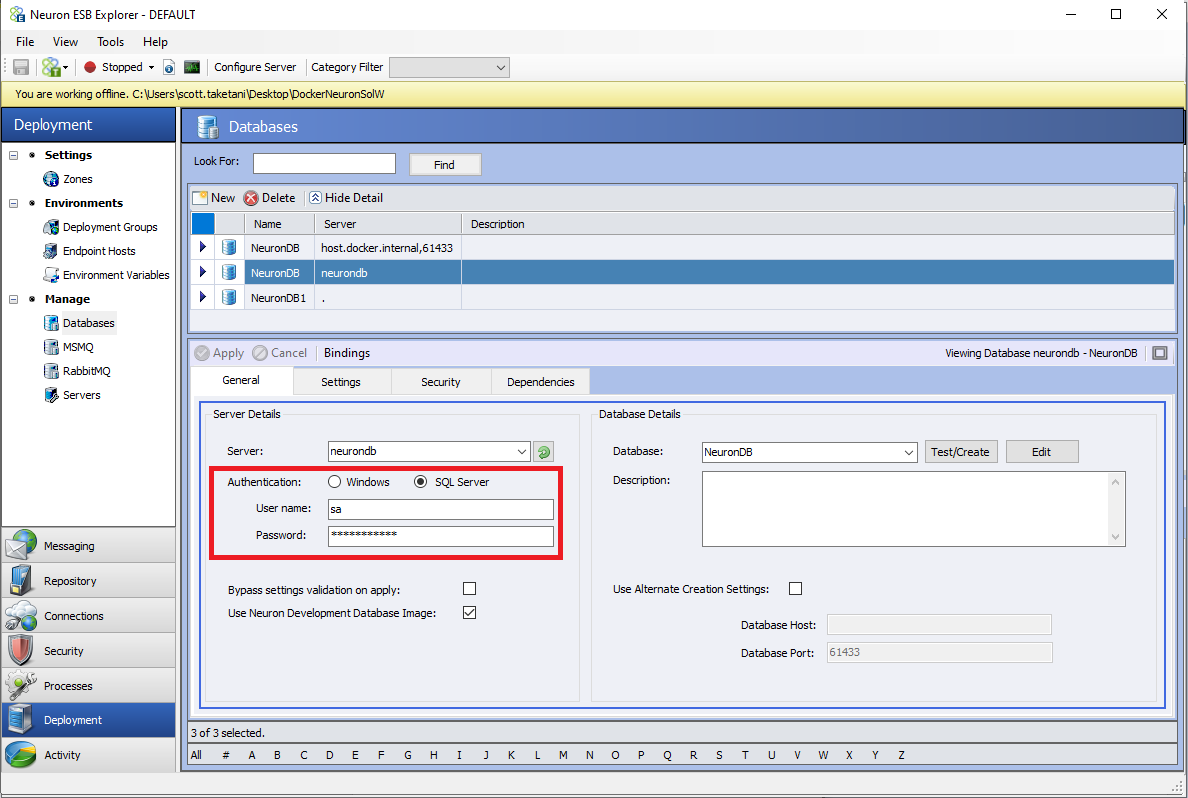
Furthermore, the SA password will be what is set in the database’s settings in Neuron ESB Explorer. The “Username” setting must be “sa”, and the “Password” will be stored in plain text in the Docker Compose file for the Development Database container. This is a reason why the Development Database should only be used in a development/test environment.
Security
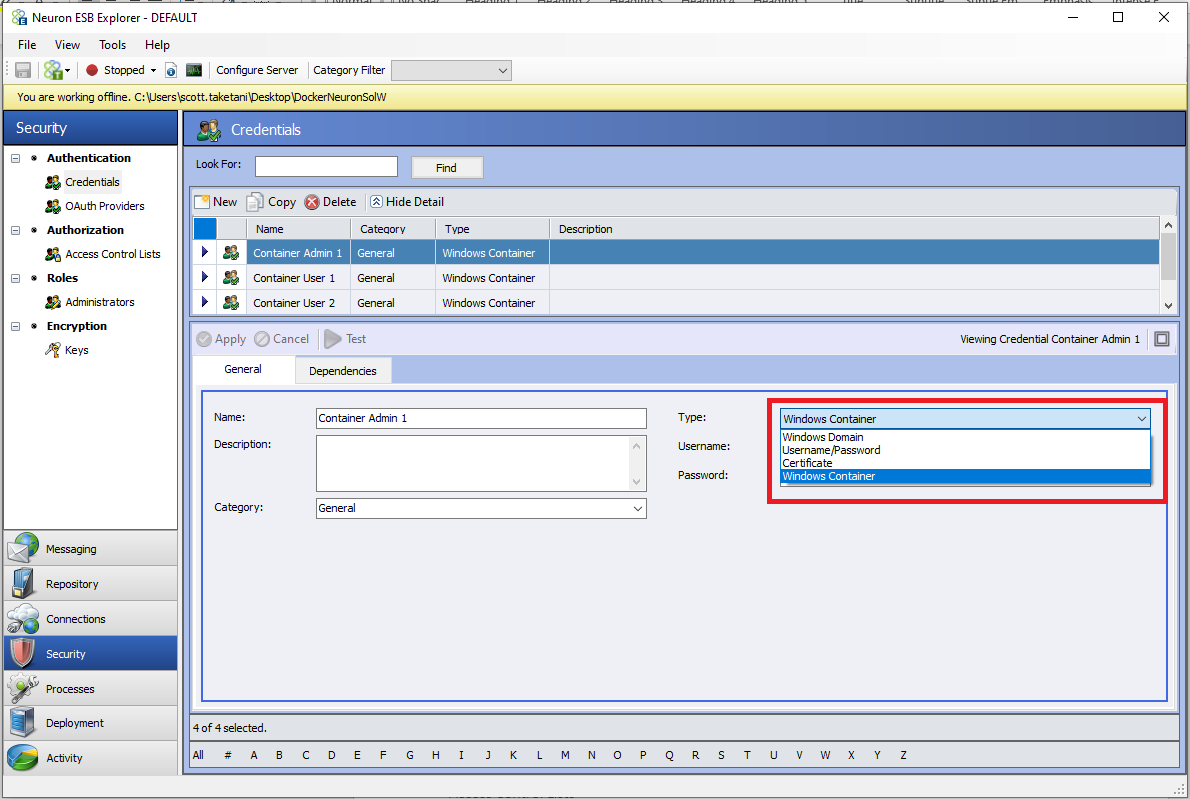
A new credential type has been added to the “Credentials” area of the “Security” tab in Neuron ESB Explorer. The following information in this section applies to a Neuron ESB instance running in a Docker Container.
Credentials
The new credential type that was added is called “Windows Container”. This credential type can be used when running Neuron ESB in a Docker container.
The credential itself is a username and password. This credential type can be used for the following purposes:
- In an Access Control List to secure a Client Connector with HTTP Basic Authentication
- In a Role to secure access to the running Neuron Solution
- To add a local Windows User/Administrator to a Neuron container’s underlying Windows Operating System
Access Control Lists
Access Control Lists utilizing the “Windows Container” type credential can be used to secure a Client Connector with HTTP Basic Authentication in the same manner as other credential types that are allowed for Client Connector authentication.
Roles
By default, there are three Roles defined in a Neuron Solution: Administrators, Users, and Everyone. These are the Roles used to secure access to the Neuron ESB Solution when running in a container. Securing the Neuron ESB Solution will prevent unauthorized users from viewing and or modifying the solution with Neuron ESB Explorer unless their credentials are added to the “Edit Added Users” dialog in the Deployment Group Docker settings.
The way this works is that the selected credentials in the “Edit Added Users” dialog are added as either a local user or administrator in the Neuron ESB Container’s underlying Windows Operating system. This occurs when the ESB Service or Endpoint Host is starting in the Neuron ESB container.
Since the default Roles use the specified local Windows Groups, a user will only be able to connect to the running solution if they know the username password combination of a credential that has been added in the “Edit Added Users” dialog.
To connect to the running solution, users will need to specify the correct credential in Neuron ESB Explorer’s connect dialog. Note that the “Domain” field should be the name of the container’s hostname, which will be the name of the Neuron ESB Solution without spaces (if using the generated Docker Compose files as is).
Client Connectors
When generating the Docker Compose files for a Neuron ESB Solution, any Client Connectors defined to run will cause a port mapping to be added to the Compose file. Thus, the host’s port and the container’s port will be the same (e.g., if the Client Connector URL is “https://0.0.0.0:8001/MyService” then a port mapping of “8001:8001” will be added). This means that the Docker Host must have the defined port for each Client Connector available.
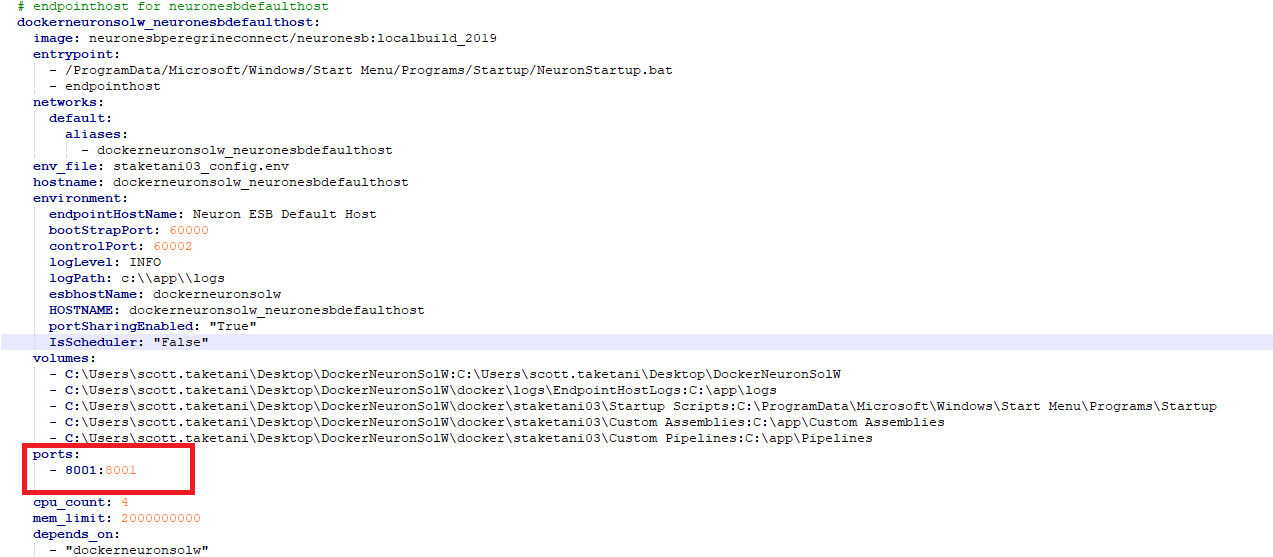
In Docker Compose port mappings, the left side is the port that will be used on the Docker Host machine, whereas the right side is the port that it gets mapped to in the container.
Security
Client Connector’s running in the Neuron ESB Containers can be secured using an Access Control List (for HTTP Basic Authentication only), or a proxy can be stood up in front of the container if transport-level security is desired. In the latter case, the proxy should terminate the TLS/SSL and pass the request unencrypted to the Client Connector endpoint.
If the proxy is a container running in the same Docker Host and uses the same network adapter, the port mapping for the Client Connector should be manually removed from the generated Docker Compose file. In this use case, the proxy container has access to the internal Docker network and should forward the request using the hostname of the container running the Client Connector and the Client Connector’s port defined in its URL.
If the proxy is running on the Docker Host machine (not in a container), the listening port for the proxy and port for the Client Connector must be different. The proxy should forward the request to the Client Connector’s port, and the generated port mapping should remain as is in the Docker Compose files.
Generate Docker Files
Overview
A new “File” menu option has been added in Neuron ESB Explorer that will automatically create the necessary Docker Compose or Docker Swarm (Docker Service) files to run a Neuron Solution in Docker.
Generated Files
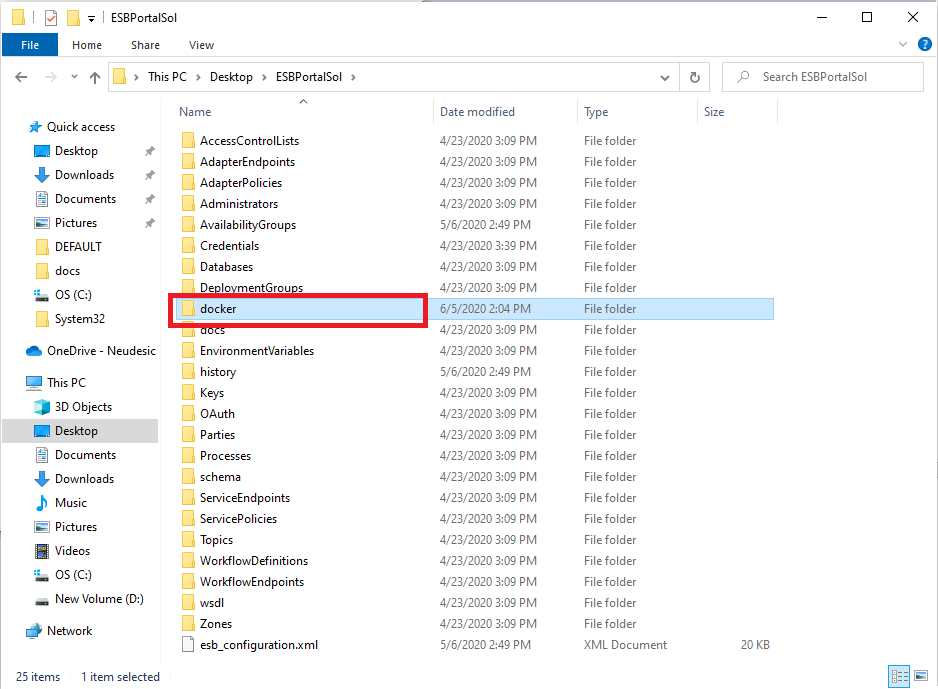
The necessary files generated from the “Generate Docker Files” feature will be located in the Neuron ESB Solution’s “docker” directory. For each Deployment Group that has the “Run in Docker” option enabled, a directory will be created in that “docker” directory. The files to run the Deployment Group are contained within those directories.
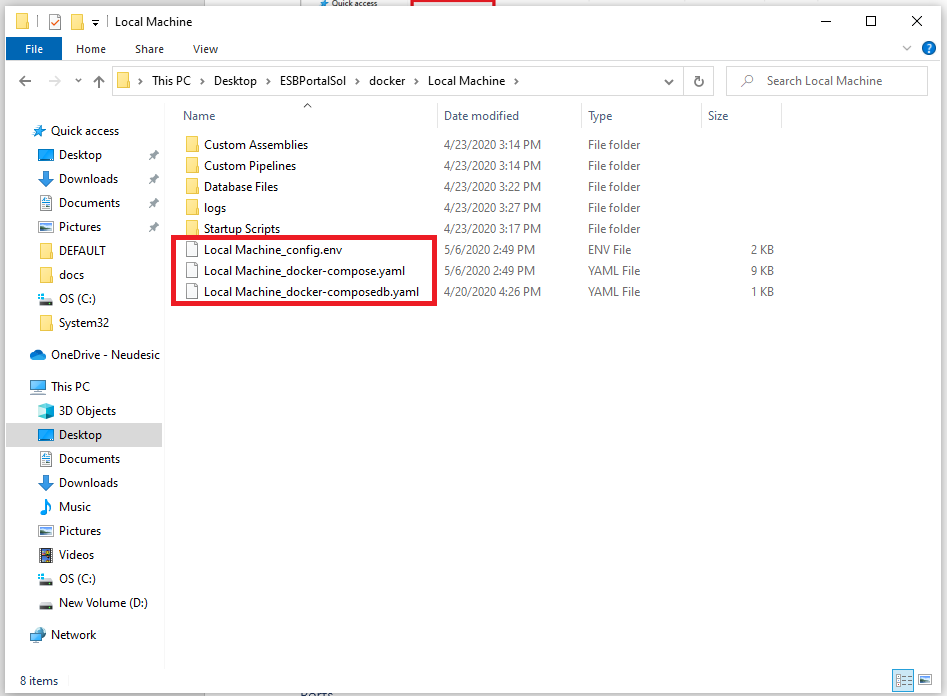
There will be one main Docker Compose file for each Deployment Group. The name of the file will take the name “<DeploymentGroupName>_docker-compose.yaml”. This file contains the Docker configuration that defines Neuron as a Docker service.
There will also be one “config.env” file for each Deployment Group. This file contains the information found in the Docker Settings for the Deployment Group in the Environment Configuration property grid. The information here will be passed into the Neuron ESB containers at runtime. In case of Swarm deployment, this file will be prefixed with Swarm/
An Event Processor yaml file will be created per Deployment Group. The name of this file will be in the form “<DeploymentGroupName>_EPS.yaml.” The Event Processor is used to insert information into the Peregrine Connect Management Suite’s Elasticsearch data store, which the Management Suite uses for reporting Neuron ESB runtime information. Therefore, if using the Event Processor in a container, the container should be started before trying to start an environment from the Management Suite.
An optional file is also created if the database used by the Deployment Group is set to use the Neuron ESB Development Database Image. This file will be used to deploy the Development Database if the user has the option enabled on the database in Neuron ESB Explorer.
Ports
The ports that the Neuron ESB Solution needs are mapped to the Docker Hosts ports. This means that if the Neuron ESB Solution is set to use a port, the port must be available on the Docker Host itself. Due to the way Docker implements ingress to the containers, anything outside of the Docker Host can use the Docker Host’s machine name and port number to connect to the container if that port is mapped.
For example, the bootstrap port for the Neuron ESB Service is 50000. To connect to the solution using Neuron ESB Explorer’s connect feature (if connecting from a remote machine), the user should supply the Docker Host’s machine name as the server, as well as the appropriate credentials (Users and Administrators can be added through “Edit Added Users” in the Docker settings for the Deployment Group in Neuron ESB Explorer).
In the same scenario, but instead of connecting from the Docker Host machine, the server name provided to the connect feature can be “host.docker.internal”, the Docker Host’s machine name, or “localhost.”
Service Routing Tables
Over the years of providing integrated solutions to a various of organizations, some common integration scenarios have emerged. Neuron ESB now provides a zero-code solution for implementing these scenarios using a new feature of Neuron ESB Client Connectors called Service Routing Tables.
Service Routing Tables are a powerful and simple alternative to using Business Processes to create pass-thru and dynamic routing activities within an organization. Service Routing Tables provide a very low latency way of implementing basic scenarios of mocking, mapping, and routing services without the overhead of a Business Process. Though Business Processes are far more customizable, they have overhead because of all the context available in the Business Process to customize message processing.
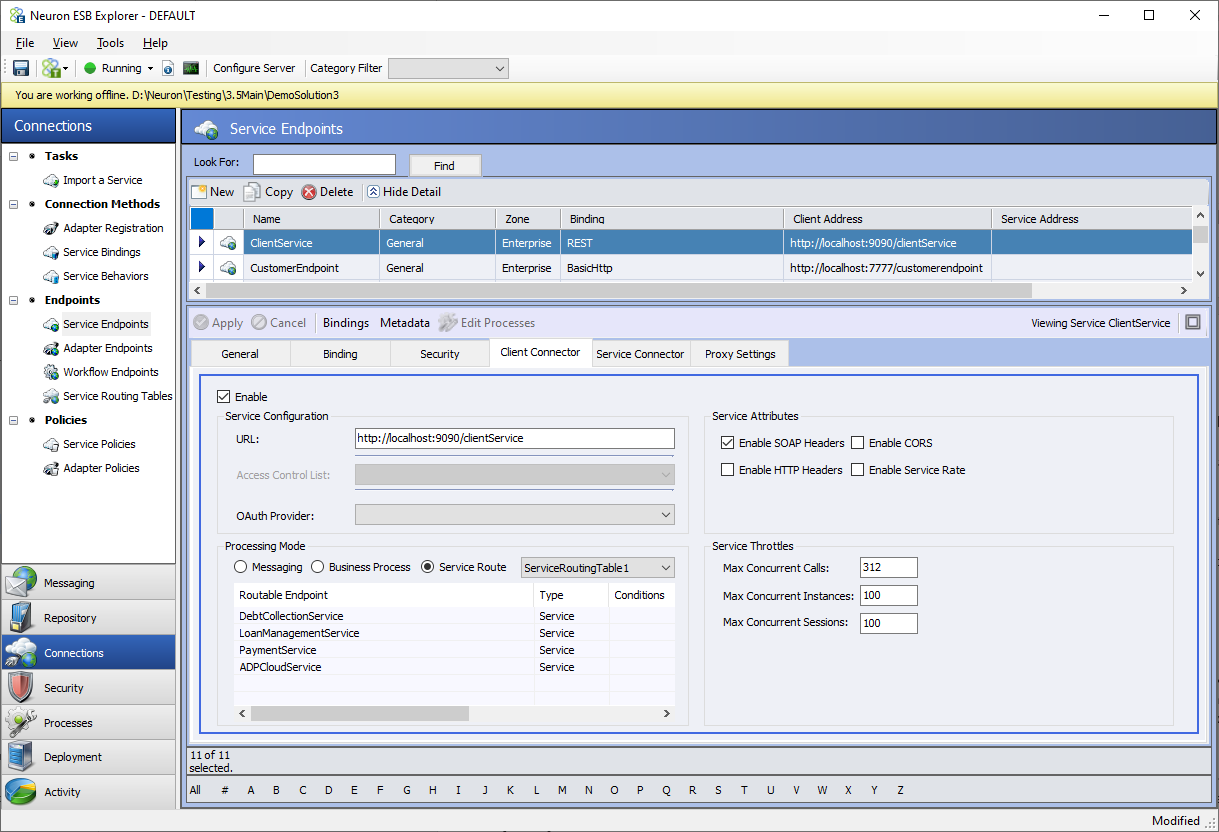
In a Service Routing Table, one or more service endpoints can be included and then the Service Routing Table can be associated with a Client Connector. When configured this way, all calls to the Client Connector are routed to the backend service endpoint configured in the Service Routing Table.
Some of the scenarios that can be configured using Service Routing Tables are listed below:
- Authorization and Access Control
- Dynamic Routing
- Message format conversion
- Stubbing / Mocking or Service virtualization
- Protocol Conversion
- Service Availability and Policy
- Blue-Green Deployment and Testing
- Message Enrichment / Content Masking
- Request Filtering
- URL Rewriting
- Message Transformation
Service Routing Tables are a powerful feature allowing organizations to perform complex operations using a no-code approach. For example, new clients can use javascript friendly REST APIs to interoperate with legacy WCF services or existing WCF clients can upgrade to new REST APIs without changing their code. Other examples can encompass the use of OAuth Tokens and API keys. For instance, standard Query strings like API Keys could be automatically appended to a service endpoint or, route to different endpoints or append alternative paths/query strings based on the scope in the incoming OAuth Token. Countless opportunities exist because of the flexibility we built into the Service Routing Table feature.
Although the Service Routing Table functionality is designed as a simple and low latency solution while providing for many real-life use cases, it may not cover every need. Therefore, it may not suit an organization’s exact needs for the above use cases. In those outlier cases, configuring the Client Connector with a Business Process and implementing the exact logic that’s needed may be the best option. Business Processes provides the ultimate flexibility to manipulate the message and header with a variety of useful steps, including custom C# code.
Configuring Routes
To configure a Service Routing Table, first Service Connectors must be added in your solution. When Service Connectors are referenced with a Service Routing Table the Service Endpoint itself does not need to be enabled nor does the Service Connector need to be enabled for Messaging. Internally, upon startup of the solution, the Service Connector will not be “live”, e.g., hosted in either the ESB Service or Neuron Endpoint Host process taking up valuable processing time or memory. These Service Connectors are called inline within the Client Connector after the route is resolved.
Once Service Connectors have been added to the solution, they can be added to a Service Routing Table. Select Service Routing Tables from the left-hand menu under Connections. Click the New button to get to the screen shown below.
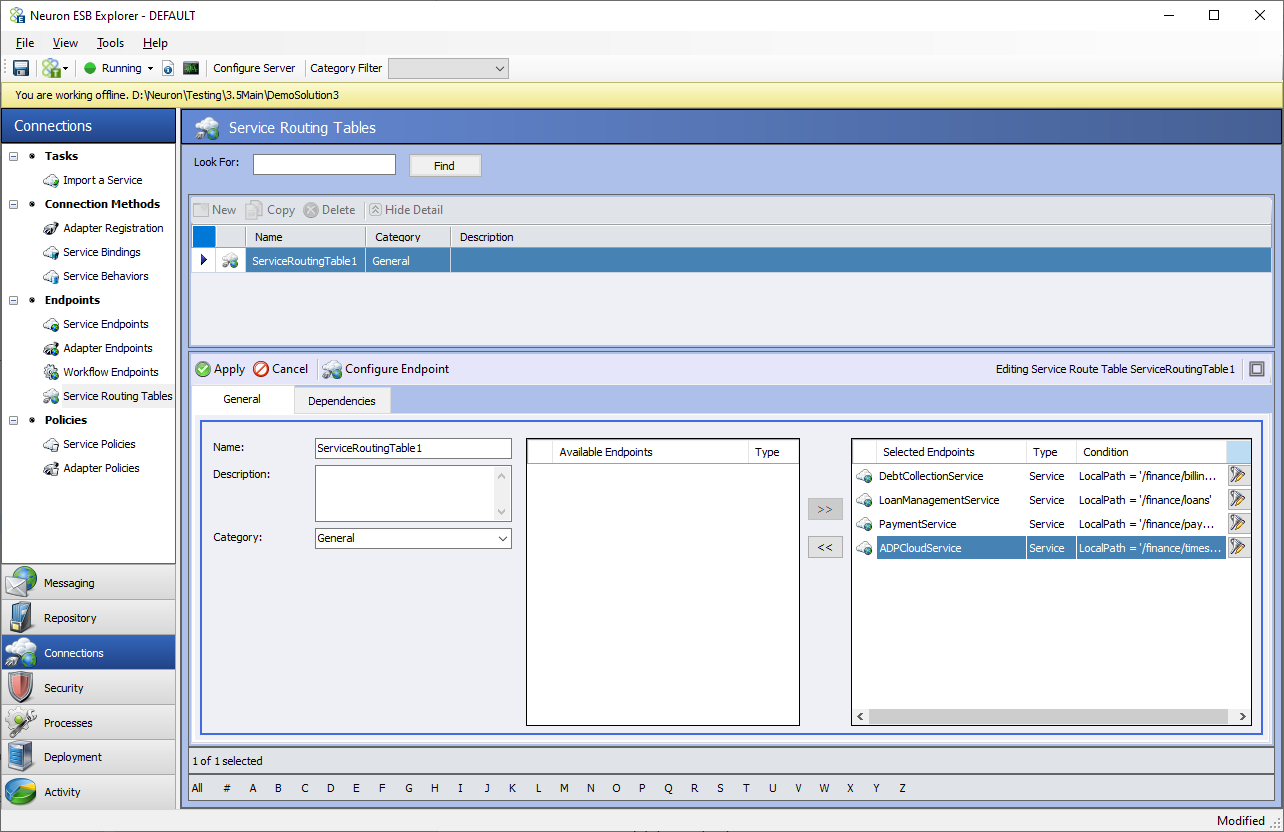
You can see the available Service Connectors under the Available Endpoints in the bottom portion of this screen. From there move the Endpoints you want to include in the routing table using the >> arrow button. You can also remove the Service Connectors by using << arrow button.
Condition Editor
![]() A Service Routing Table can contain more than one service endpoint and multiple copies of the same endpoint. The incoming message will be routed to the first service endpoint that satisfies the Condition configured for the selected endpoint. Clicking on the Conditions icon in the last column titled Condition, the conditions editor can be opened.
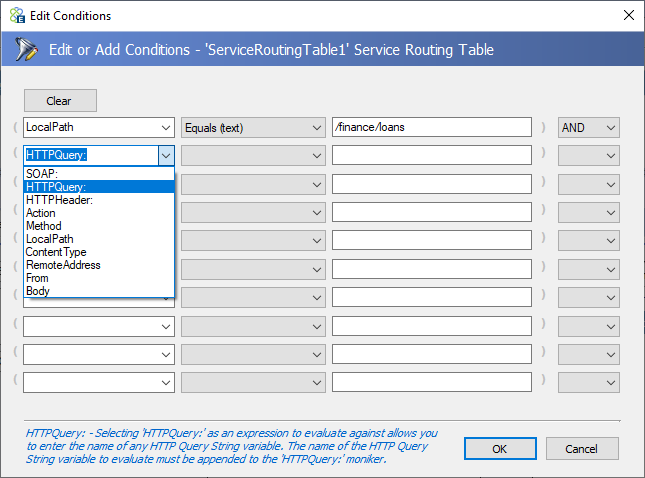
A Service Routing Table can contain more than one service endpoint and multiple copies of the same endpoint. The incoming message will be routed to the first service endpoint that satisfies the Condition configured for the selected endpoint. Clicking on the Conditions icon in the last column titled Condition, the conditions editor can be opened.
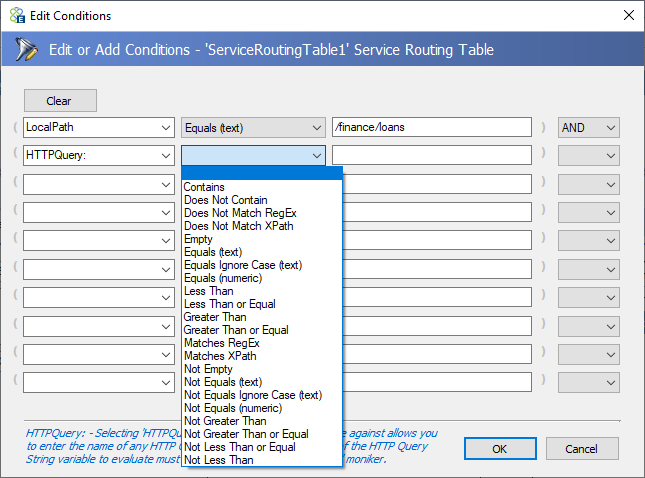
Users can select from a variety of properties or even the incoming message body to check and the condition to match in the first two drop downs. Whereas a free form expression to evaluate can be entered in the third box and a join clause (AND, OR, or XOR) in the last dropdown box.
 |
 |
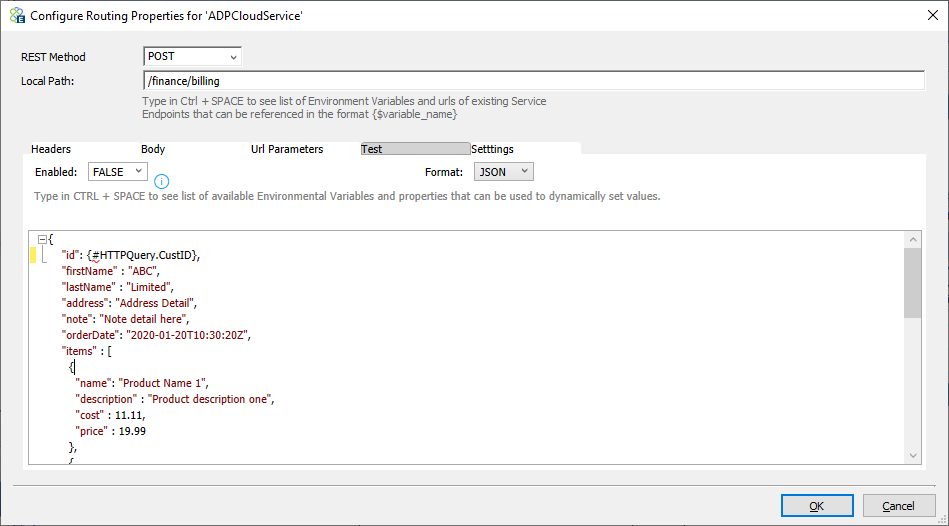
Once the service routing endpoints are added, each endpoint can be configured in the right-hand Selected Endpoints box. Click configure endpoints to display the screen shown below.
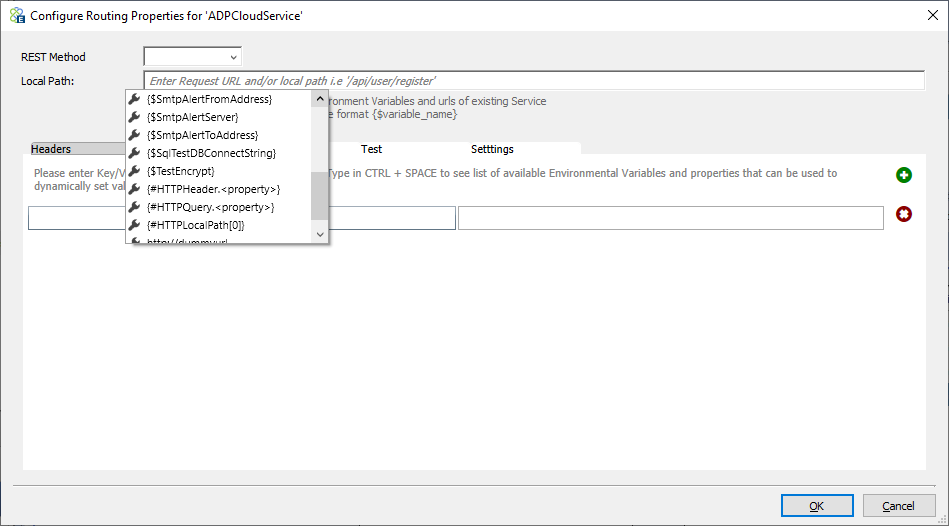
A big part of the flexibility that’s been built into the Service Routing Table feature is the ability to configure almost every property of the Service Connector by using any combination of text, Environment Variables, pieces of the original request body, incoming SOAP or HTTP Headers or HTTP QueryStrings as well as the any part of the local path or even the original URL. In any property where this is supported, users can view the available list of options by pressing the CTRL+Space key combination on the keyboard. In the case of the Local Path property, users can either append to the existing local path, add a new local path, or overwrite the existing URL of the Service Connector entirely.
For Dynamic Routing scenarios, users can add copies of the same Service Connector to the list of Selected Endpoints and then provide a unique condition. The Configure Routing Properties dialog shown above allows the user to apply completely different local paths or URL options to the same Service Connector. In that case, they could do the same with HTTP headers and even send unique request bodies.
REST Method or SOAP Action
If the selected service is a WCF or SOAP service, the SOAP Action will be the first field in the top row, whereas if it is a REST service the first field in the top row will be Method. For a SOAP service, the SOAP action is a required field, and for REST service, the Method is a required field.
Local Path
The second field is the local path. The local path may include a partial URL to be appended to the base service URL or contain the full-service URL with the local path appended. In the local path and SOAP Action, the CTRL+Space key combination can be used to select some token substitution as shown above. These tokens and/or text can be concatenated to create the final property value.
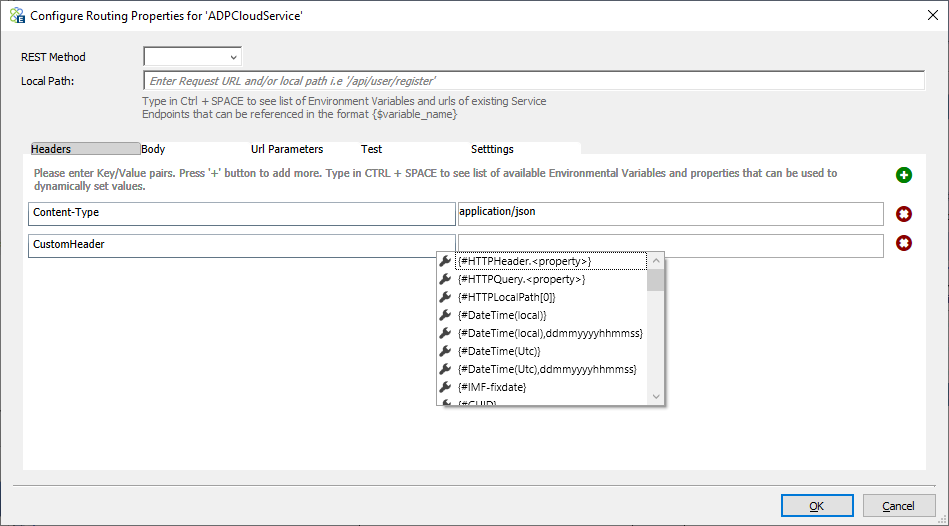
Headers
Users can enter one or more key-value pairs in the headers section, and these headers will be added as HTTP headers. When adding headers, users may use token substitution in the value column. Neuron ESB Environment Variables, Neuron ESB Message properties, Constants, HTTP Query, and Header properties will appear in the drop-down list. You can use the icons for + and x signs to add /remove key-value pairs in this table.
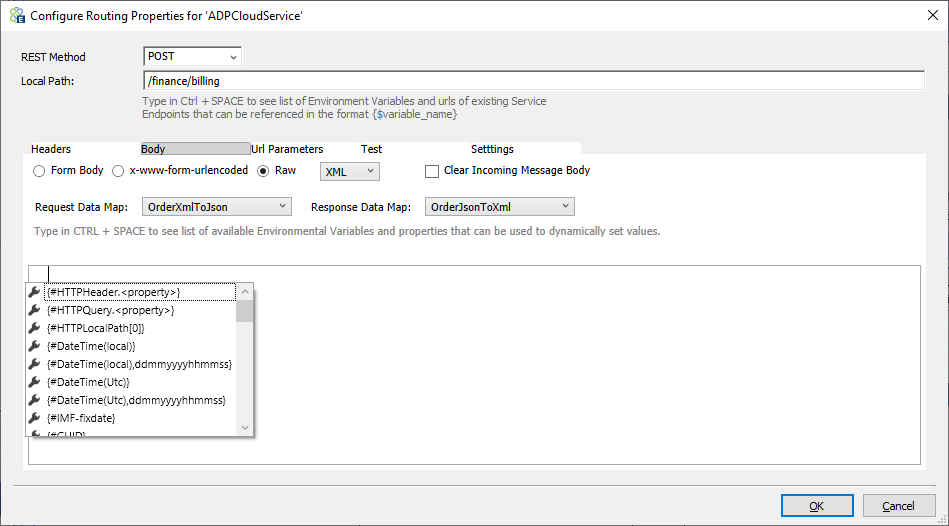
Body
Next, you can customize the message body. For example, you can choose to transform the incoming message using a Data Map, or you may choose to compose a new message based on existing properties.
The Message body can be Form Body, x-www-form-urlencoded, or raw body. In case of first two options, a grid of key-value pairs like the headers section will appear, whereas for raw body a choice of Text, XML, or JSON in the drop-down will be presented. Users can also clear the Message body (if case you are using the REST and GET method, this is required).
Optionally a request Data Map and a response Data Map can be applied to incoming / returned messages. All the existing Data Maps in the solution will appear in the dropdown selection.
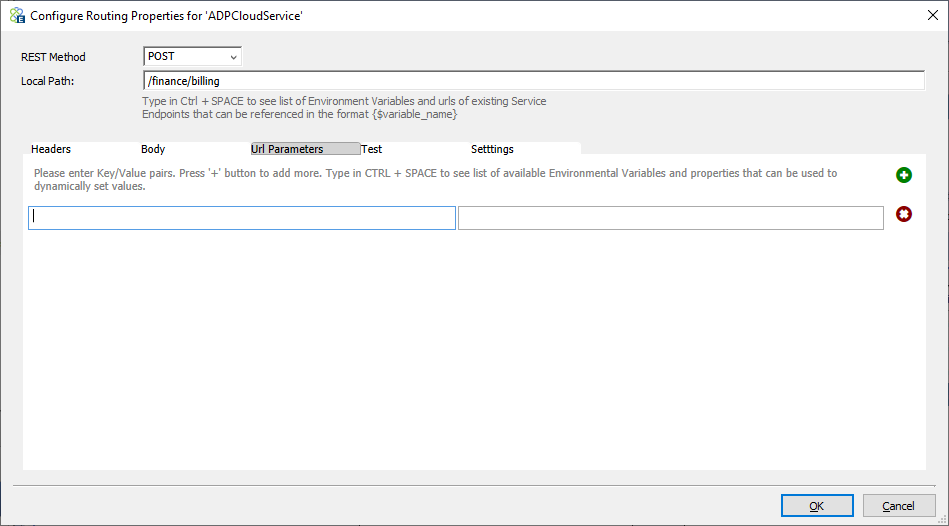
Url Parameters (Query strings)
This is very similar to the Headers section. Key-value pairs entered here are appended to the service endpoint URL as query strings in the format “?key1=value1&key2=value2” etc. Users can use token substitution with various options to assign the value of query strings.
Test
Sometimes users need the Service Routing Table to return a canned response if the service endpoint it is going to connect to is not yet available. This can be useful if there is a need to mock out services in a specific environment where the service itself is unavailable, or a need to unit test against specific message bodies expected to be returned by the service. In that case, the Test tab can be used to define a test response to be returned instead of calling the service endpoint configured.
Users can disable or enable this feature by selecting an option from the drop-down box. However, a Neuron ESB Environment Variable can also be used to configure the Enable/Disable feature. This can be useful for instance if the Test feature should be enabled in one environment (e.g., TEST/QA) but not enabled in the Production environment. Users can use the dynamic token substitution to construct the message body.
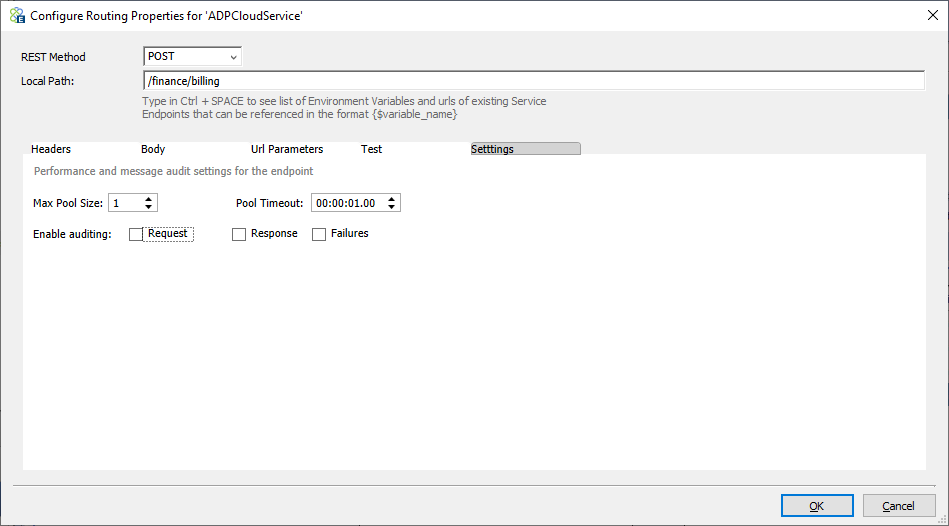
Performance and Audit Settings
On the last tab of configuring the service endpoint, users can choose to Audit requests, responses, or failures during the execution of the Service Routing Table. Users can also adjust the value of pool size and timeout depending on load and performance requirements.
Creating a connection pool provides low latency because of the savings in overhead of creating the service connection. However, too many service pool connections can exhaust TCP connections on the server, so the pool size must be balanced against the maximum number of open connections. Pool timeout lets users control how long the request can wait to get a pooled connection when the server is too busy.
Neuron ESB is a zero-code solution for many common use cases in the implementation of Service-Oriented Architecture. Neuron ESB features are distilled and tuned from years of experience and customer feedback. Service Routing Tables add brand new capabilities with a few clicks to enable low latency high-performance SOA solutions. To learn more, check out the training/tutorials and documentation at https://www.PeregrineConnect.com.
Wiretap Tracing Neuron ESB Messages
Frequently, it is necessary to capture the in-flight messages for testing and debugging purposes. In some other cases, its required for specific business activity monitoring in real-time. The existing Neuron ESB capabilities can be done by rewiring the Business Process to include the message Audit process step. Alternatively, the solution can be configured for verbose logging to capture some of these details. A third option for WCF services is to use WCF Tracing. These options are useful in development and test environments, but they are not recommended for production time tracing.
Neuron ESB version 3.7.5 adds capabilities for capturing in-flight messages into searchable Elastic Search Index when used in connection with the Peregrine Connect Management Suite. In Service Oriented Architecture, this capability is referred to as Wiretap pattern. This has been added because some customers need this capability to be turned on and off in production without modifying the configured solution and restarting the Neuron ESB runtime service. Also, auditing and tracing everything can grind performance to a halt. The Wiretap capability offers a solution to this requirement. The Wiretap Tracing can be turned on or off for specific periods of time and for specific steps/points in a Business Process or Service Route Table.
This feature is only available when a Client Connector is calling a Business Process directly or is configured with a Service Routing Table. A configuration file is created using the new Trace Configuration Utility. The configuration file specifies exactly what messages to capture and how much detail to capture for these messages.
Users may specify which Client Connectors to include for wiretapping and for how long. Along with each Client Connector, the exact points in the process or service route where to capture the messages can be specified. In addition, conditions can be added, user defined custom properties to extract from messages, schema, and sample document. The captured messages are stored in an Elastic Search Index that is setup when the Peregrine Connect Management Suite Environment for the Neuron ESB instance is configured. These messages can later be searched and analyzed using various data analysis tools. Users can even add their own extension assembly, which will receive wiretapped messages. In this assembly, users may modify or forward messages to other enterprise monitoring systems.
The following sections show how quickly tracing can be setup for one or more Client Connectors. Tracing provides many options that can be fine tune with what and how much to capture. The result of the configuration is saved into a configuration file in the current Neuron ESB Instance folder. This configuration is also referred to as the Tracking Profile.
Basic Wiretap configuration
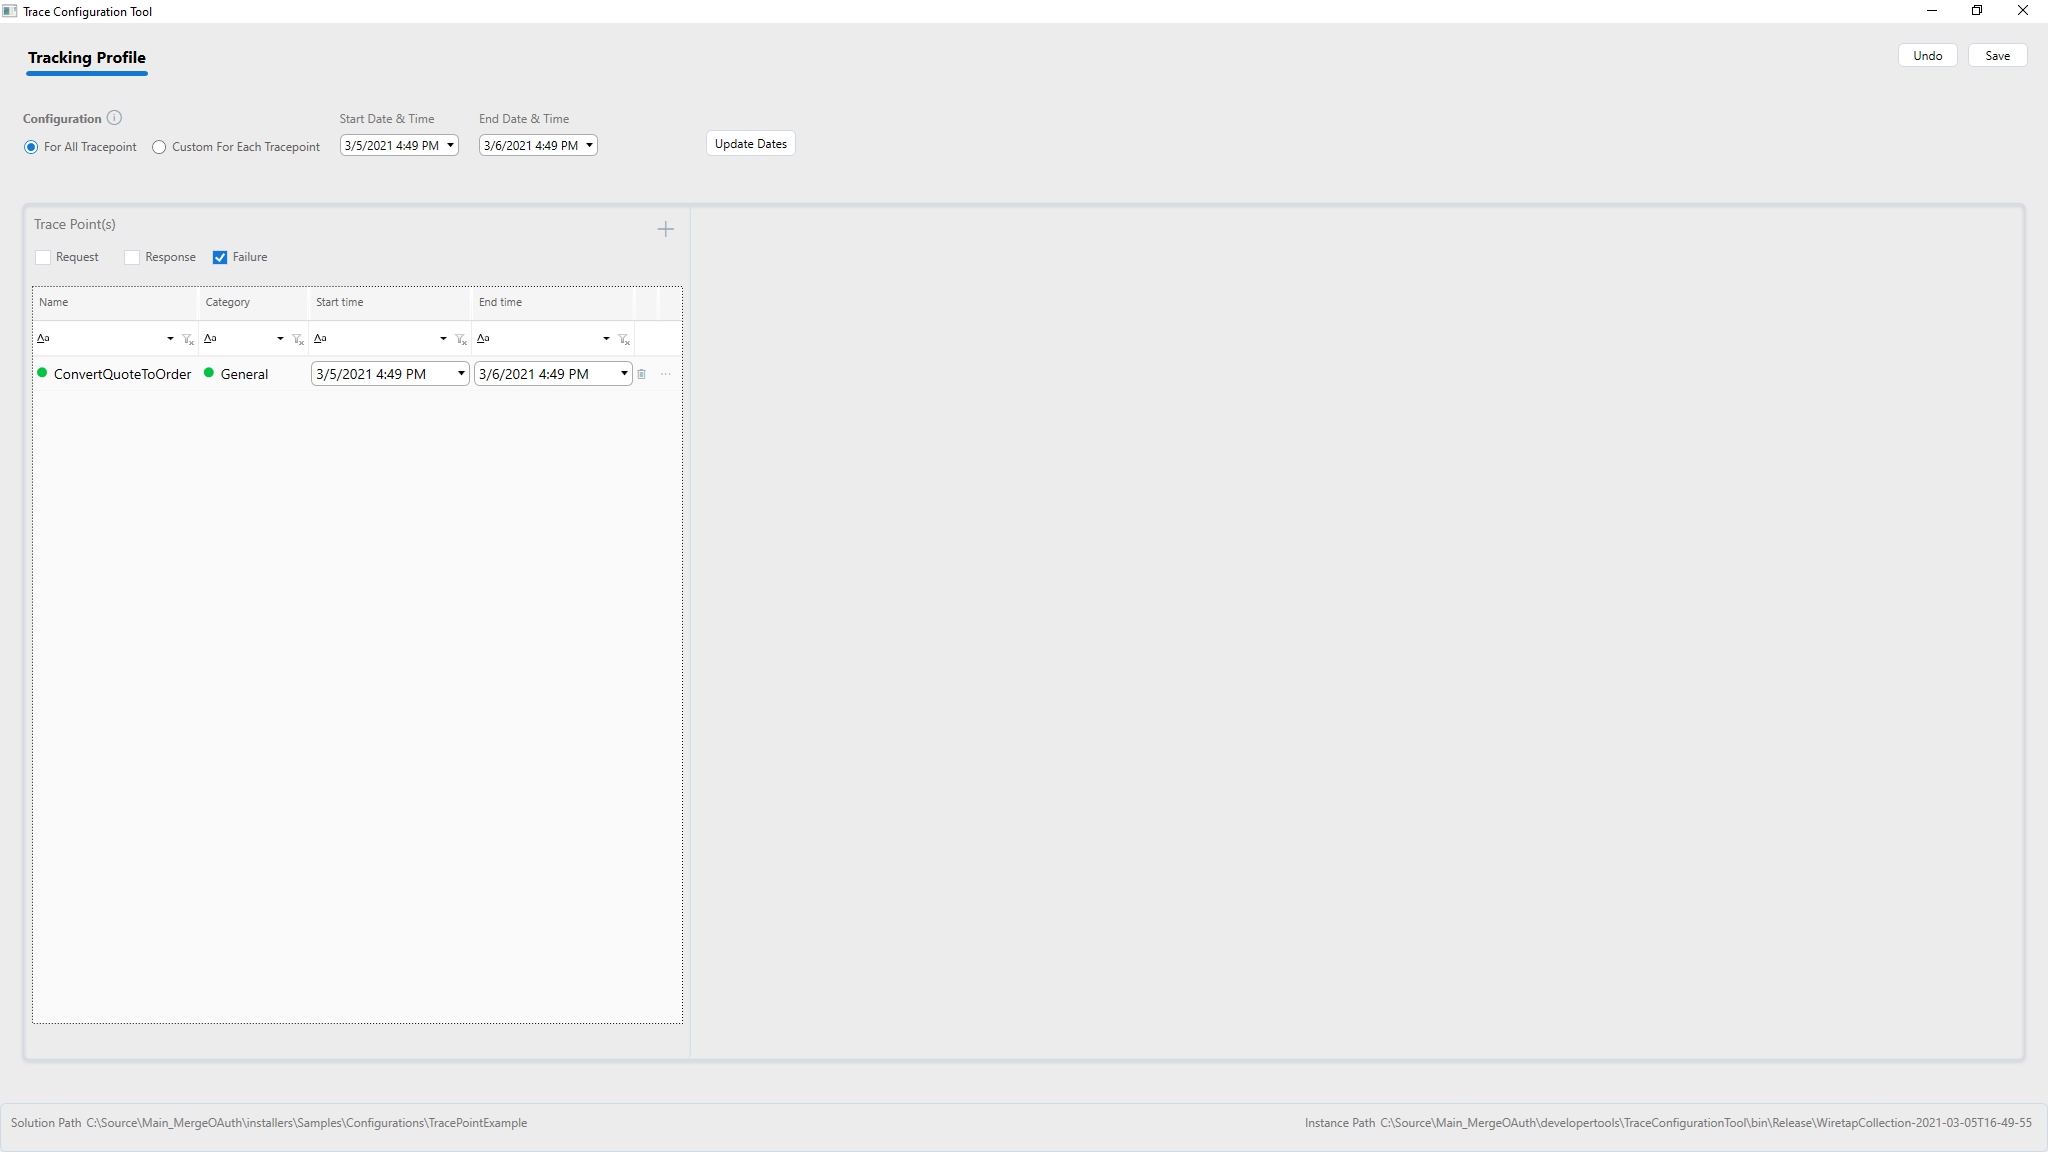
Basic Wiretap configuration to capture messages for Client Connector is straightforward. Launch the TraceConfigurationTool.exe from the Neuron ESB Instance Folder. The tool reads the currently configured solution and loads Client Connectors defined in the solution for configuration.
For basic configuration the radio button For All Tracepoints is selected under Configuration. With this setup,
Users can simply specify start date/time, end date/time and select the Client Connectors they want to trace by adding the plus button in the grid under Trace Points(s). Request, response, failure or any combination thereof can be selected.
If updating an existing configuration and the start and end dates need to change, the values can be changed on the date & time boxes in the top row and click update dates to update dates on all the selected Trace Points.
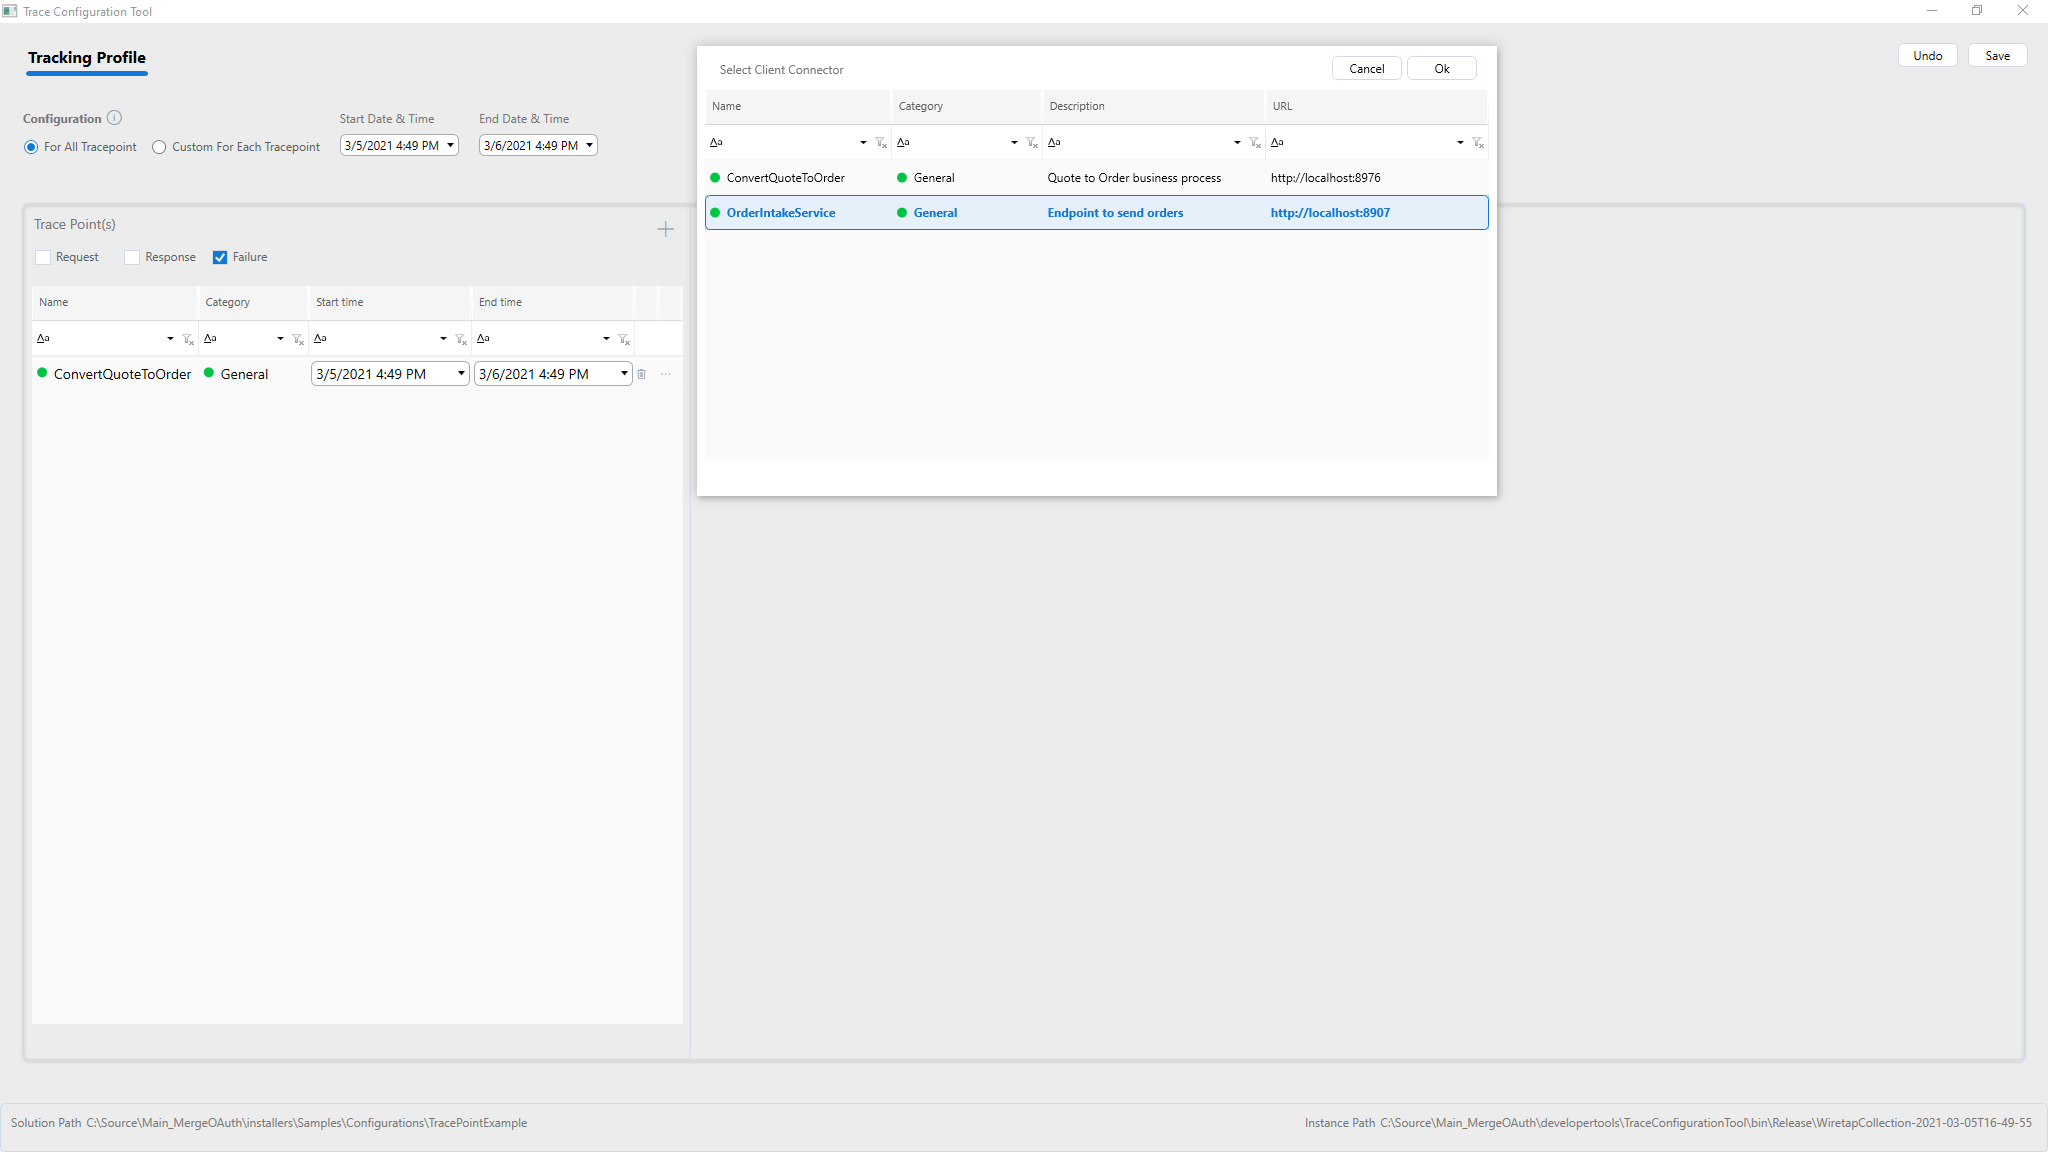
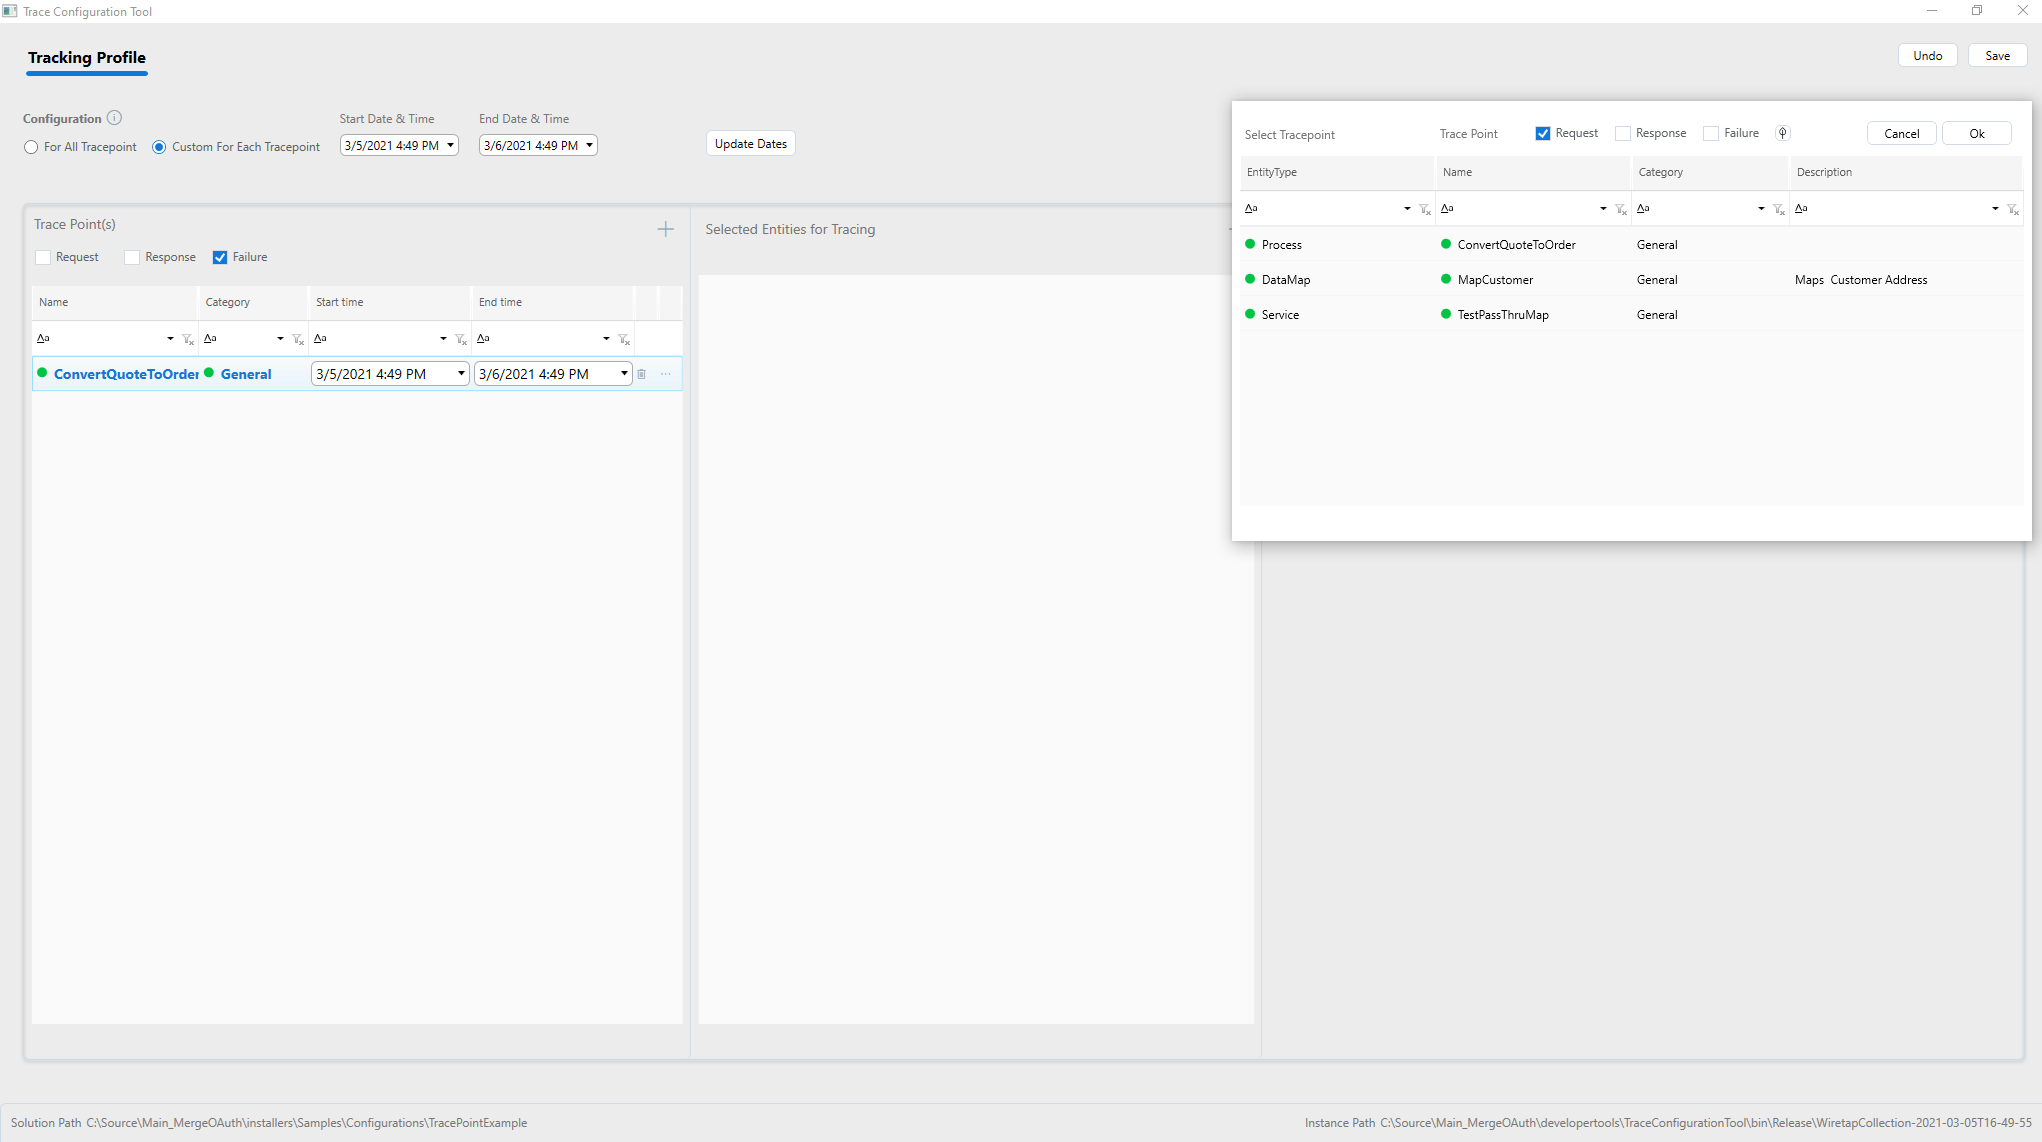
Adding a Client Connector
Highlight the Client Connector to add for Tracking and click Ok. For each client connector, select checkboxes to trace requests, response, or failures in the first part of the grid on the left-hand side of the screen below.
Configuring Wiretap for Business Processes
A more detailed configuration can be used to capture messages based on conditions or at specific points in the associated Business Process.
Selecting the Custom for each Tracepoint Radio button allows the entities associated with the Client Connector to be configured for message tracking. If the Client Connector is associated with a Service Routing Table, the selection is restricted to the service endpoints in the Service Routing Table. If the Client Connector is associated with a Business Process, the selection shows all the major Process steps in the Business Process. The major Process steps include the following:
- Adapter Endpoint
- Service Endpoint
- Data Mapper
- XSLT Transform
- Execute Process
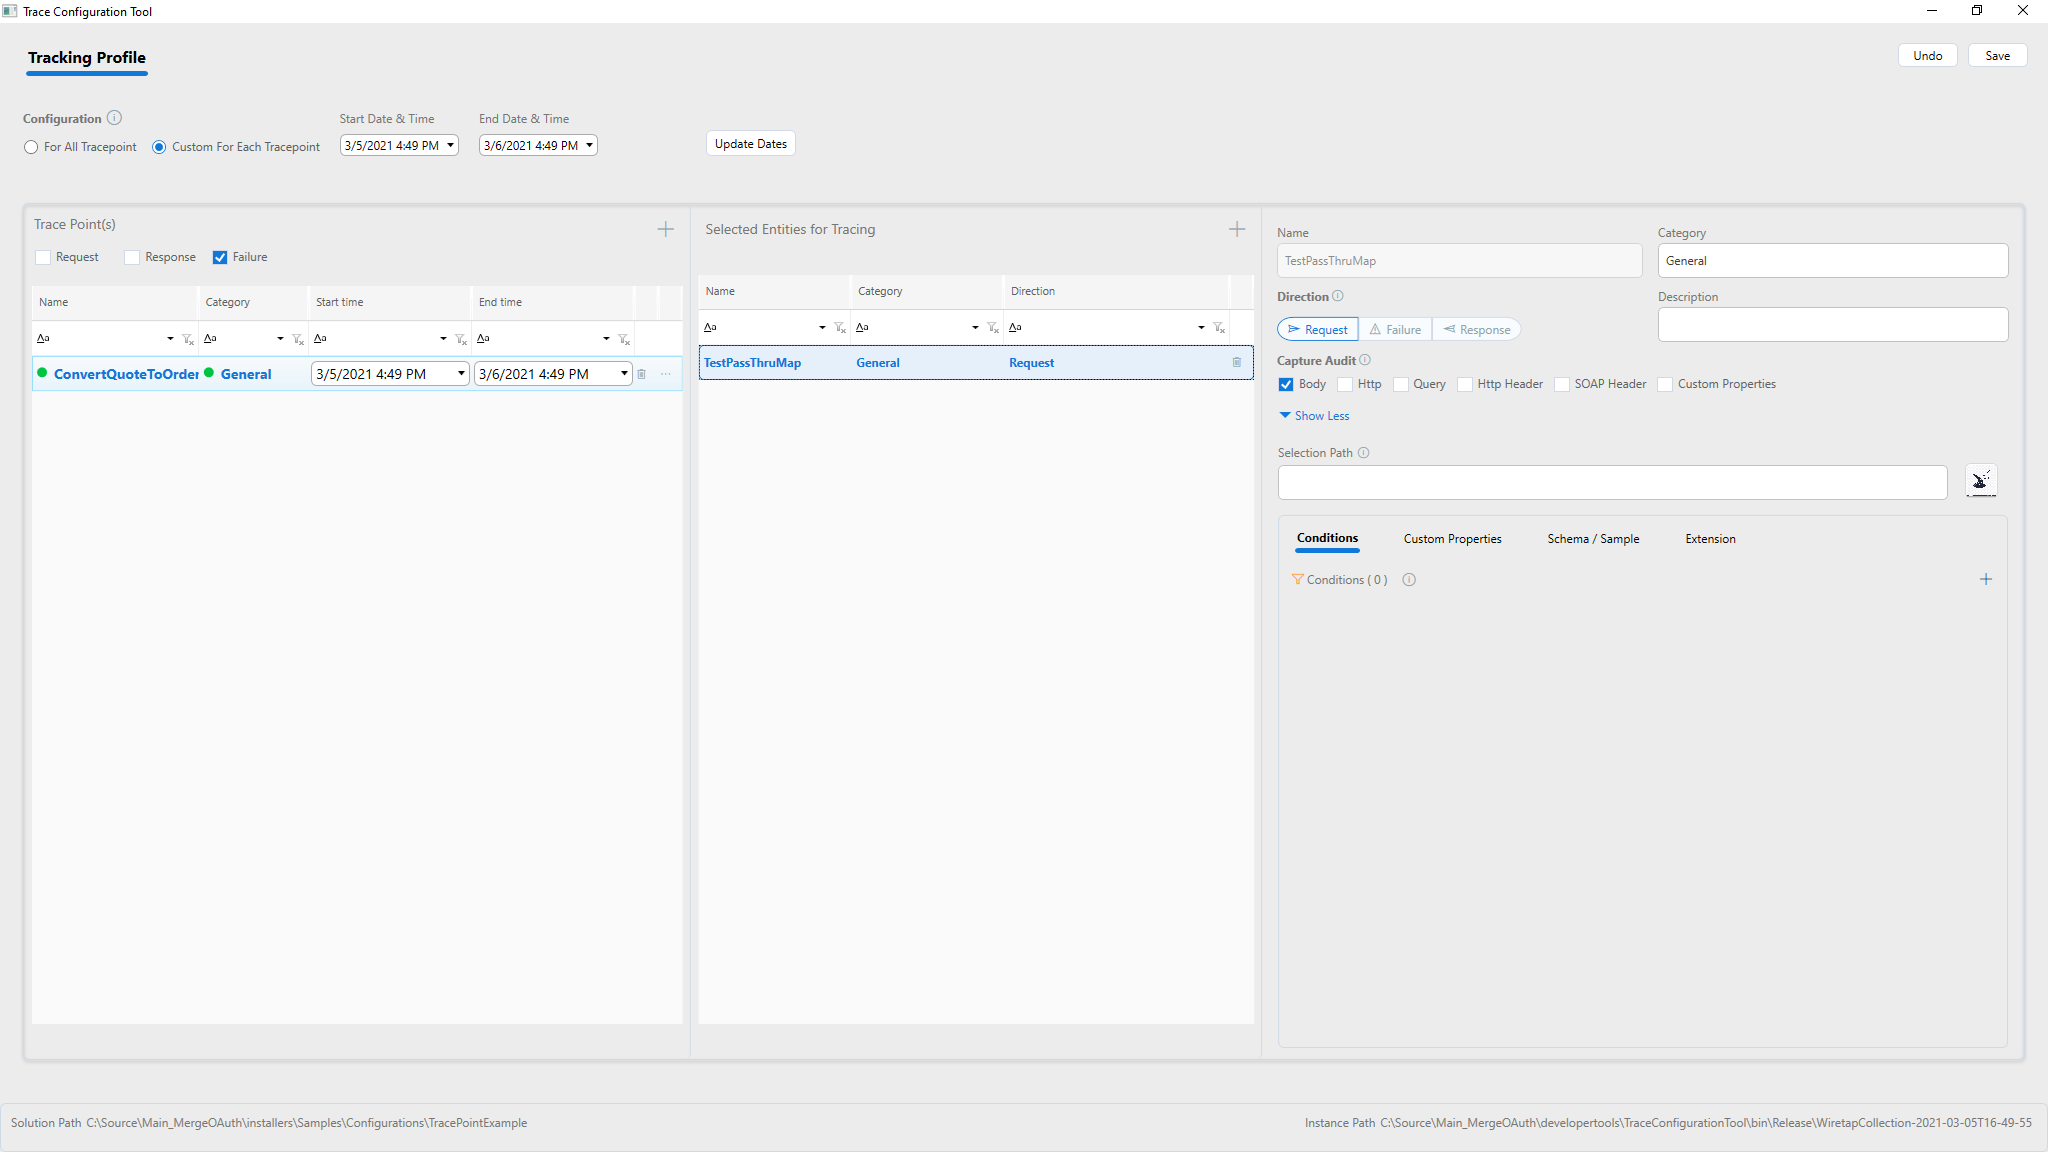
Each Process step can be configured whether to capture messages from Request, Response or Failure. If needed all of them can be captured by addomg multiple entries for each Process step and change the Direction radio button to Request, Response, or Failure. What to capture can be specified using the checkboxes to indicate capturing body, http headers, query strings, etc. Capture only the minimum needed so as control the size of the indexes and save storage space.
Customize what to capture
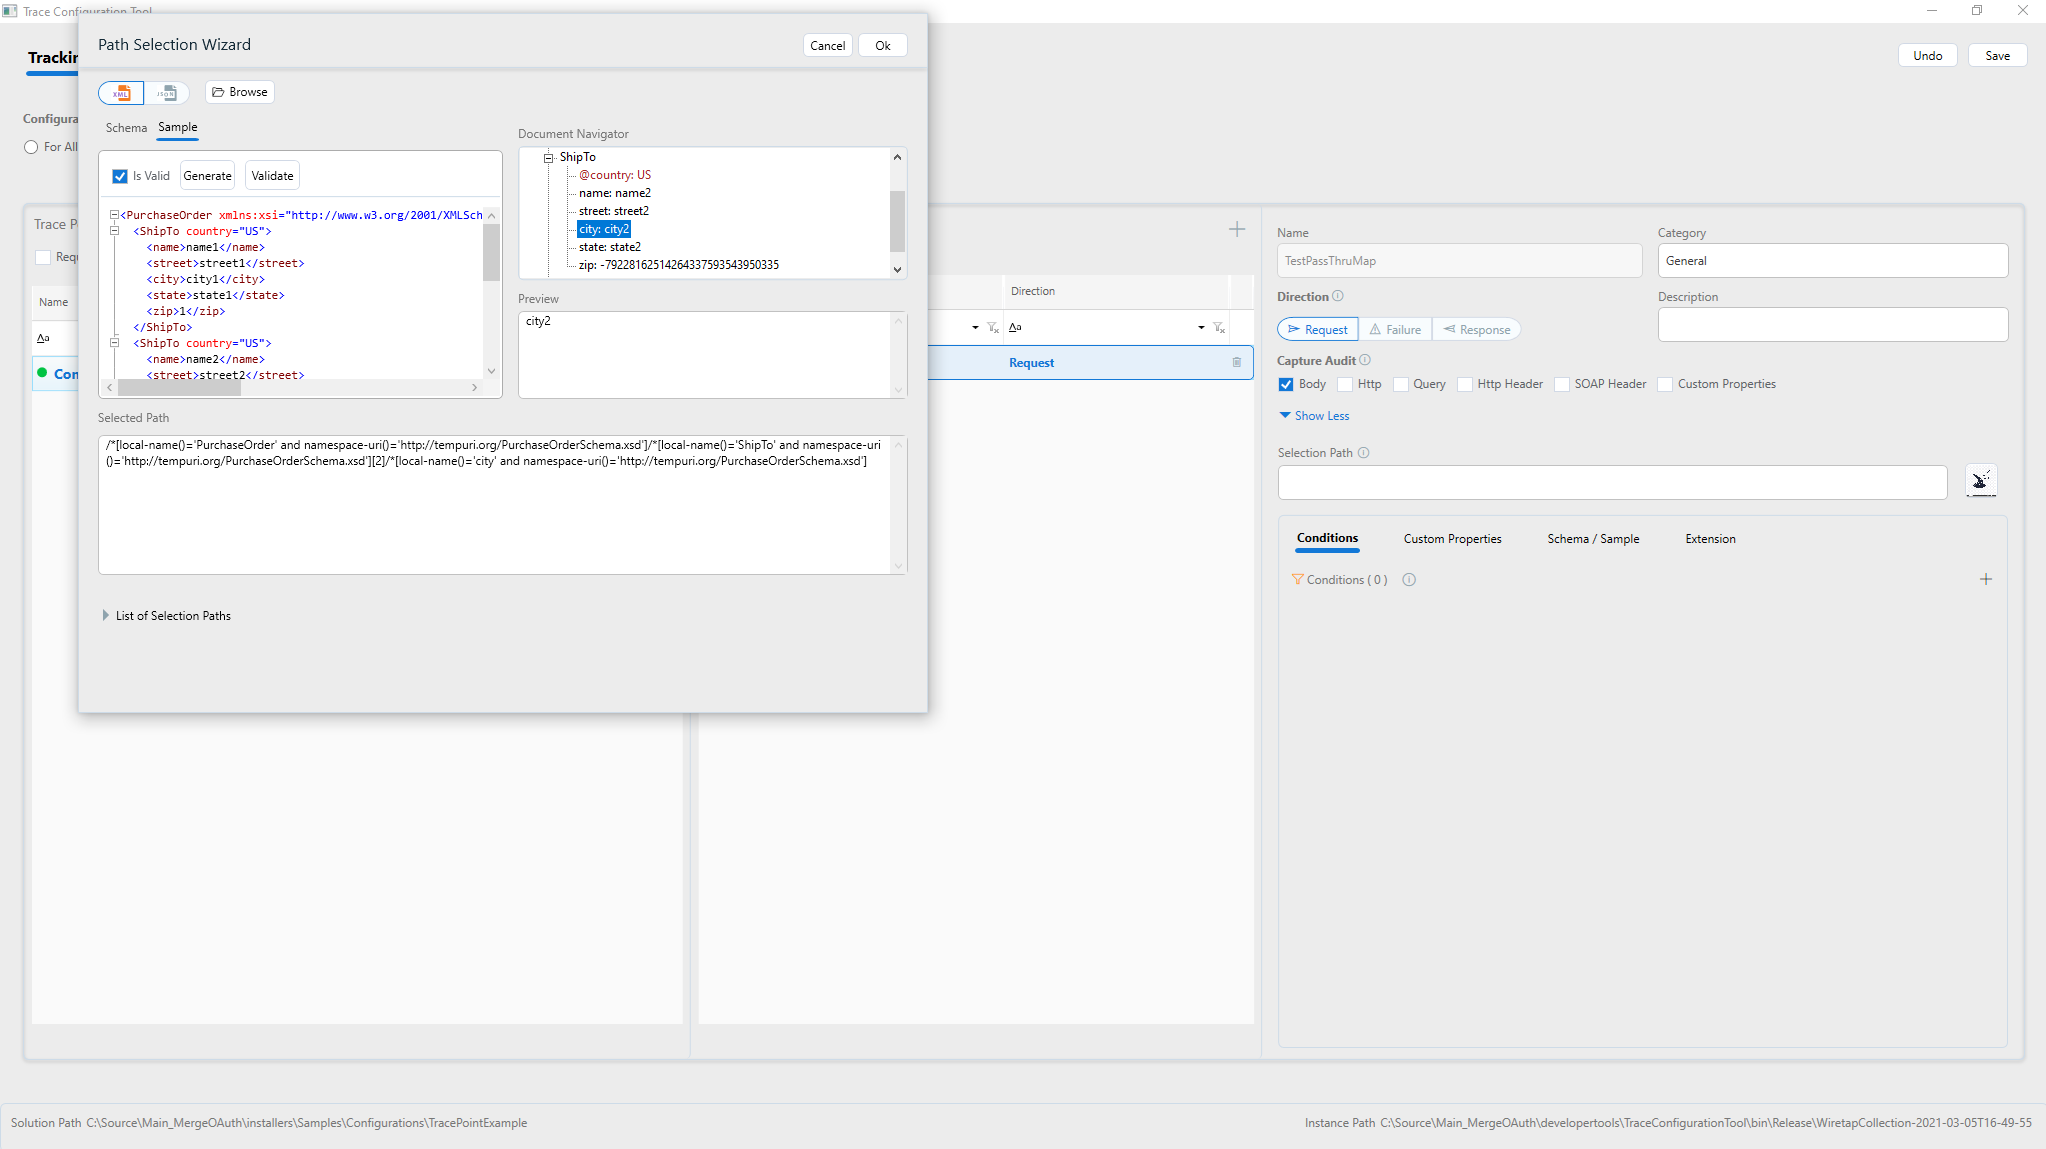
When body is selected, a further selection path can be provided from the message using XPath or JSON. Only parts of the message body that are selected by the XPath or JSON Path specified. To aid in creating the selection path, a tool is provided for visually selecting the XPath or JSON Path from sample message/schema.
Add conditions for tracking
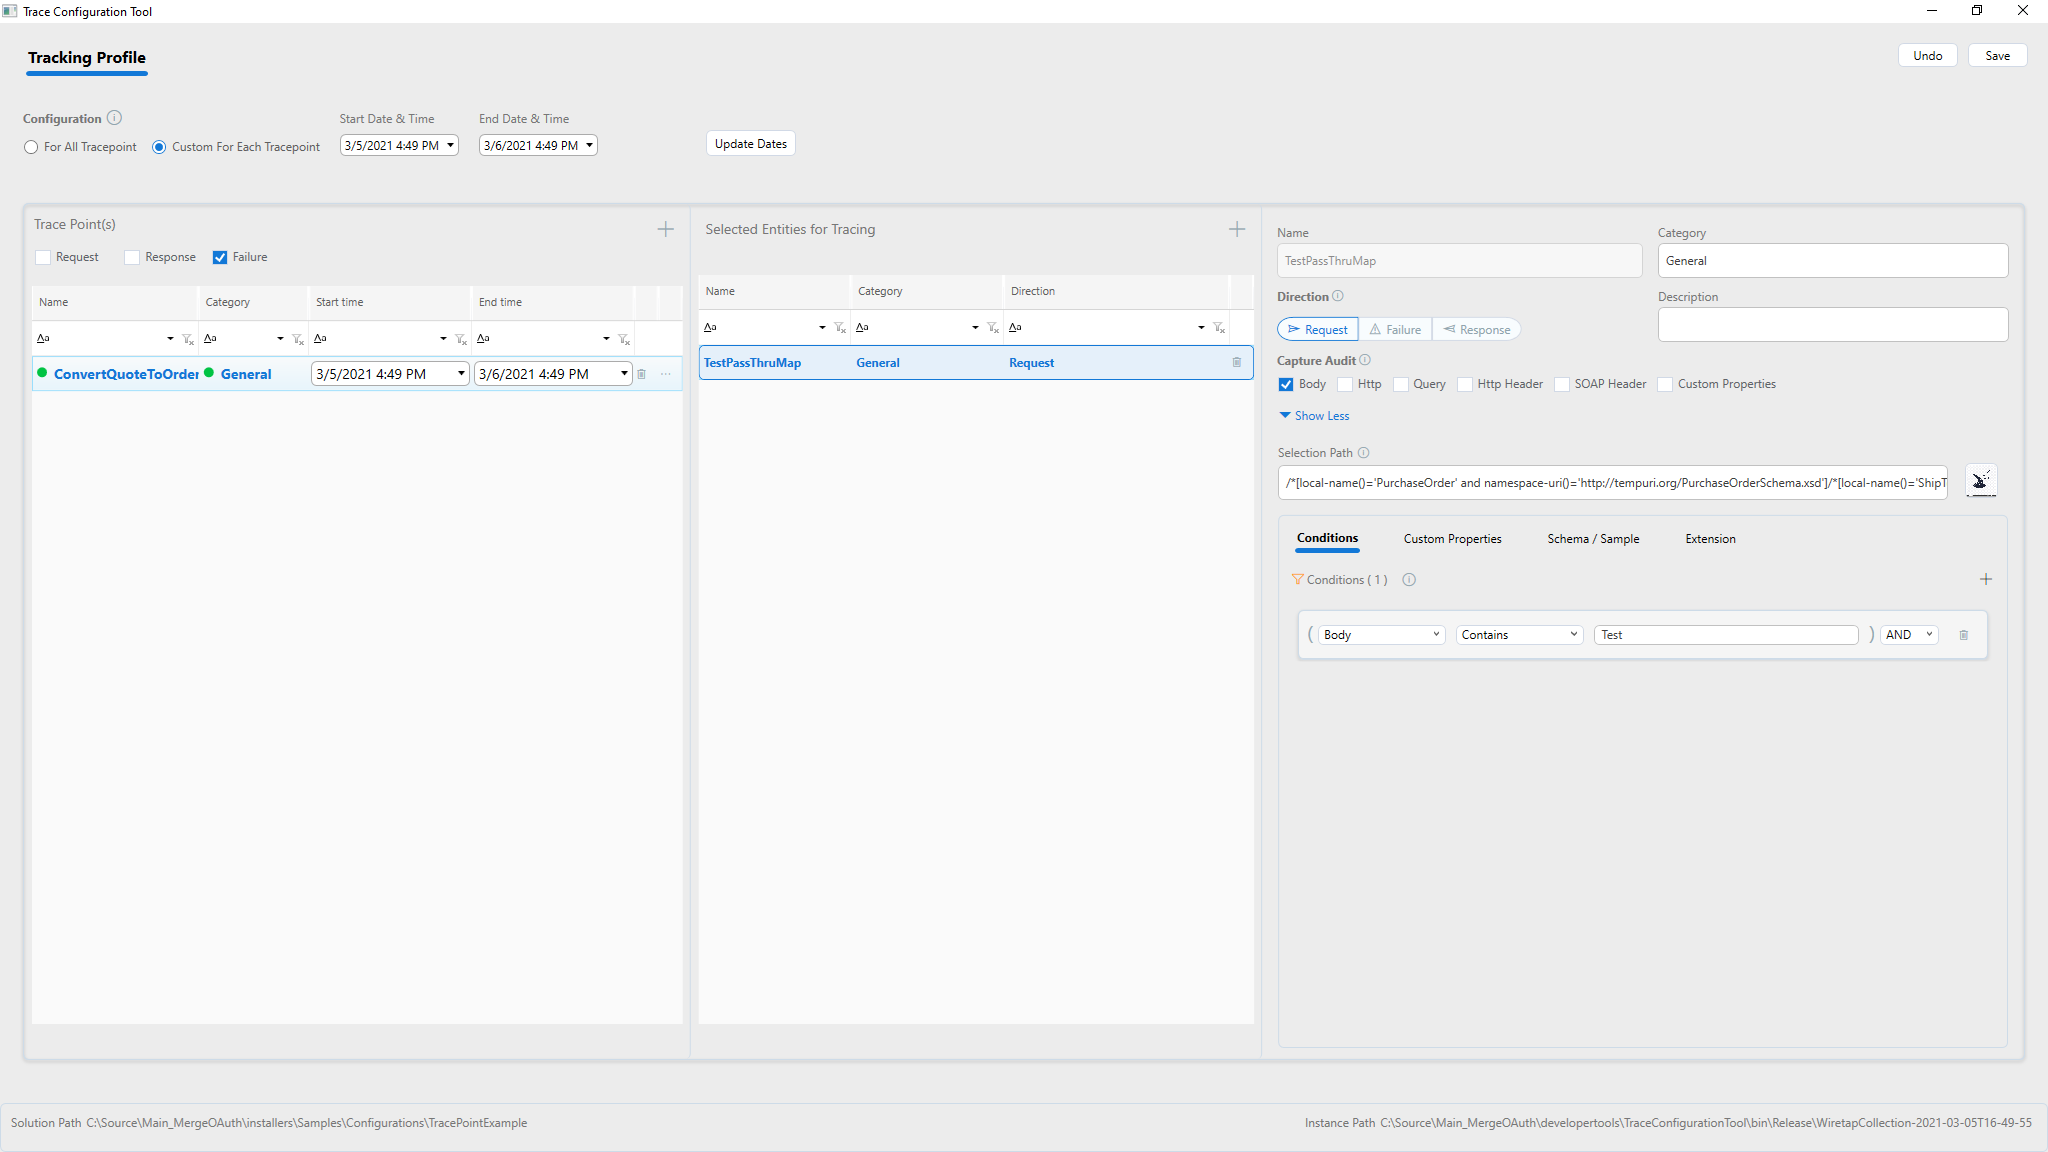
Using the Conditions tab under the expanded details of service endpoint for tracking, one or more conditions can be specified. Only messages that satisfy the condition will be stored in the tracking index.
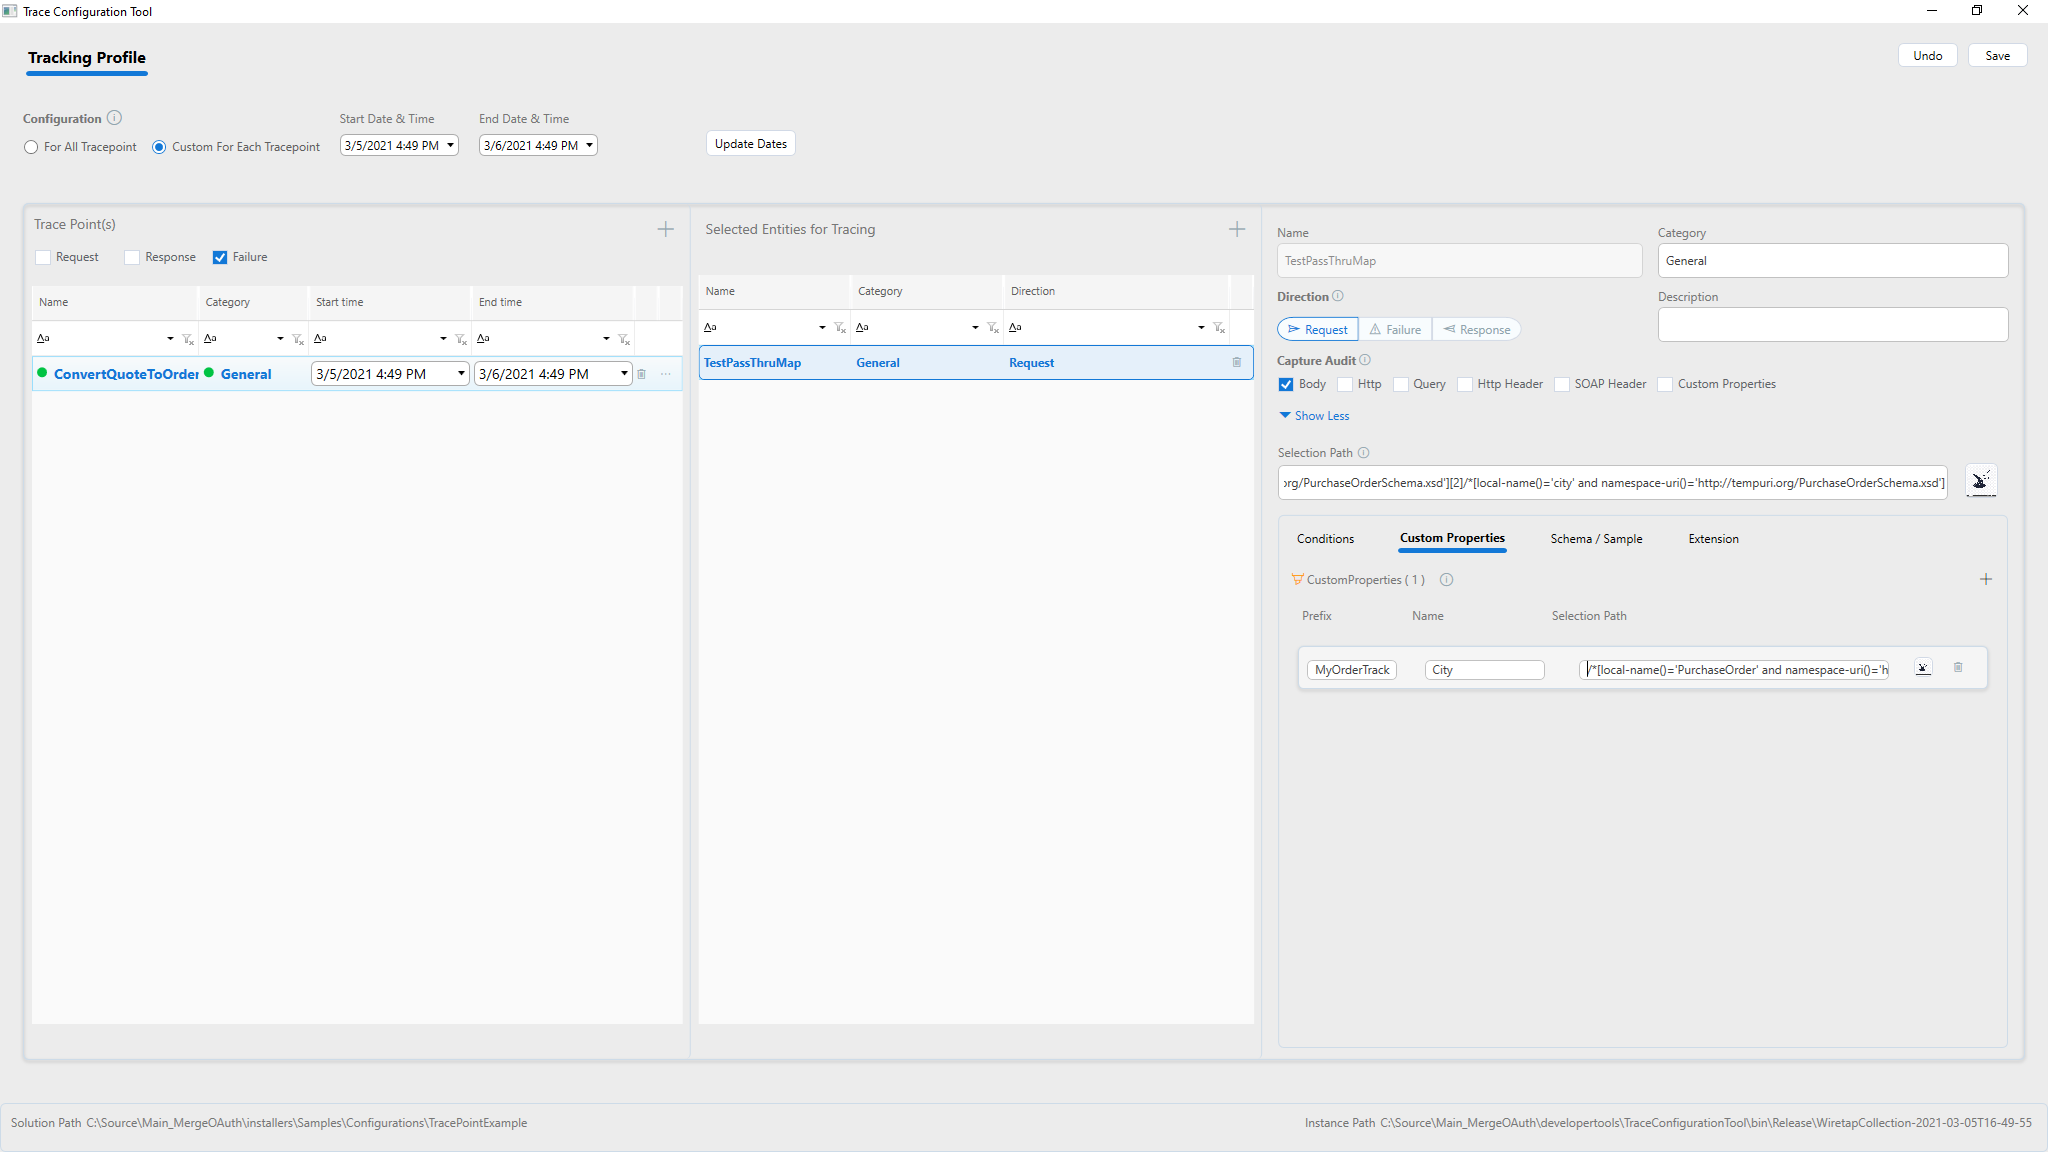
Add custom specific properties
Using Custom Properties allows the capture of specific items into its own entry in the tracking index. Using Custom Properties this way makes it easy to analyze data out of the index searches.
Associate schema and sample document
When a schema and sample document is associated with the captured message, the unstructured data in the message body can be used along with the schema by using advanced analysis tools like Kibana and Logstash. An additional extension for Business Activity Monitoring is coming soon, and it will utilize this information to provide visual data analysis.

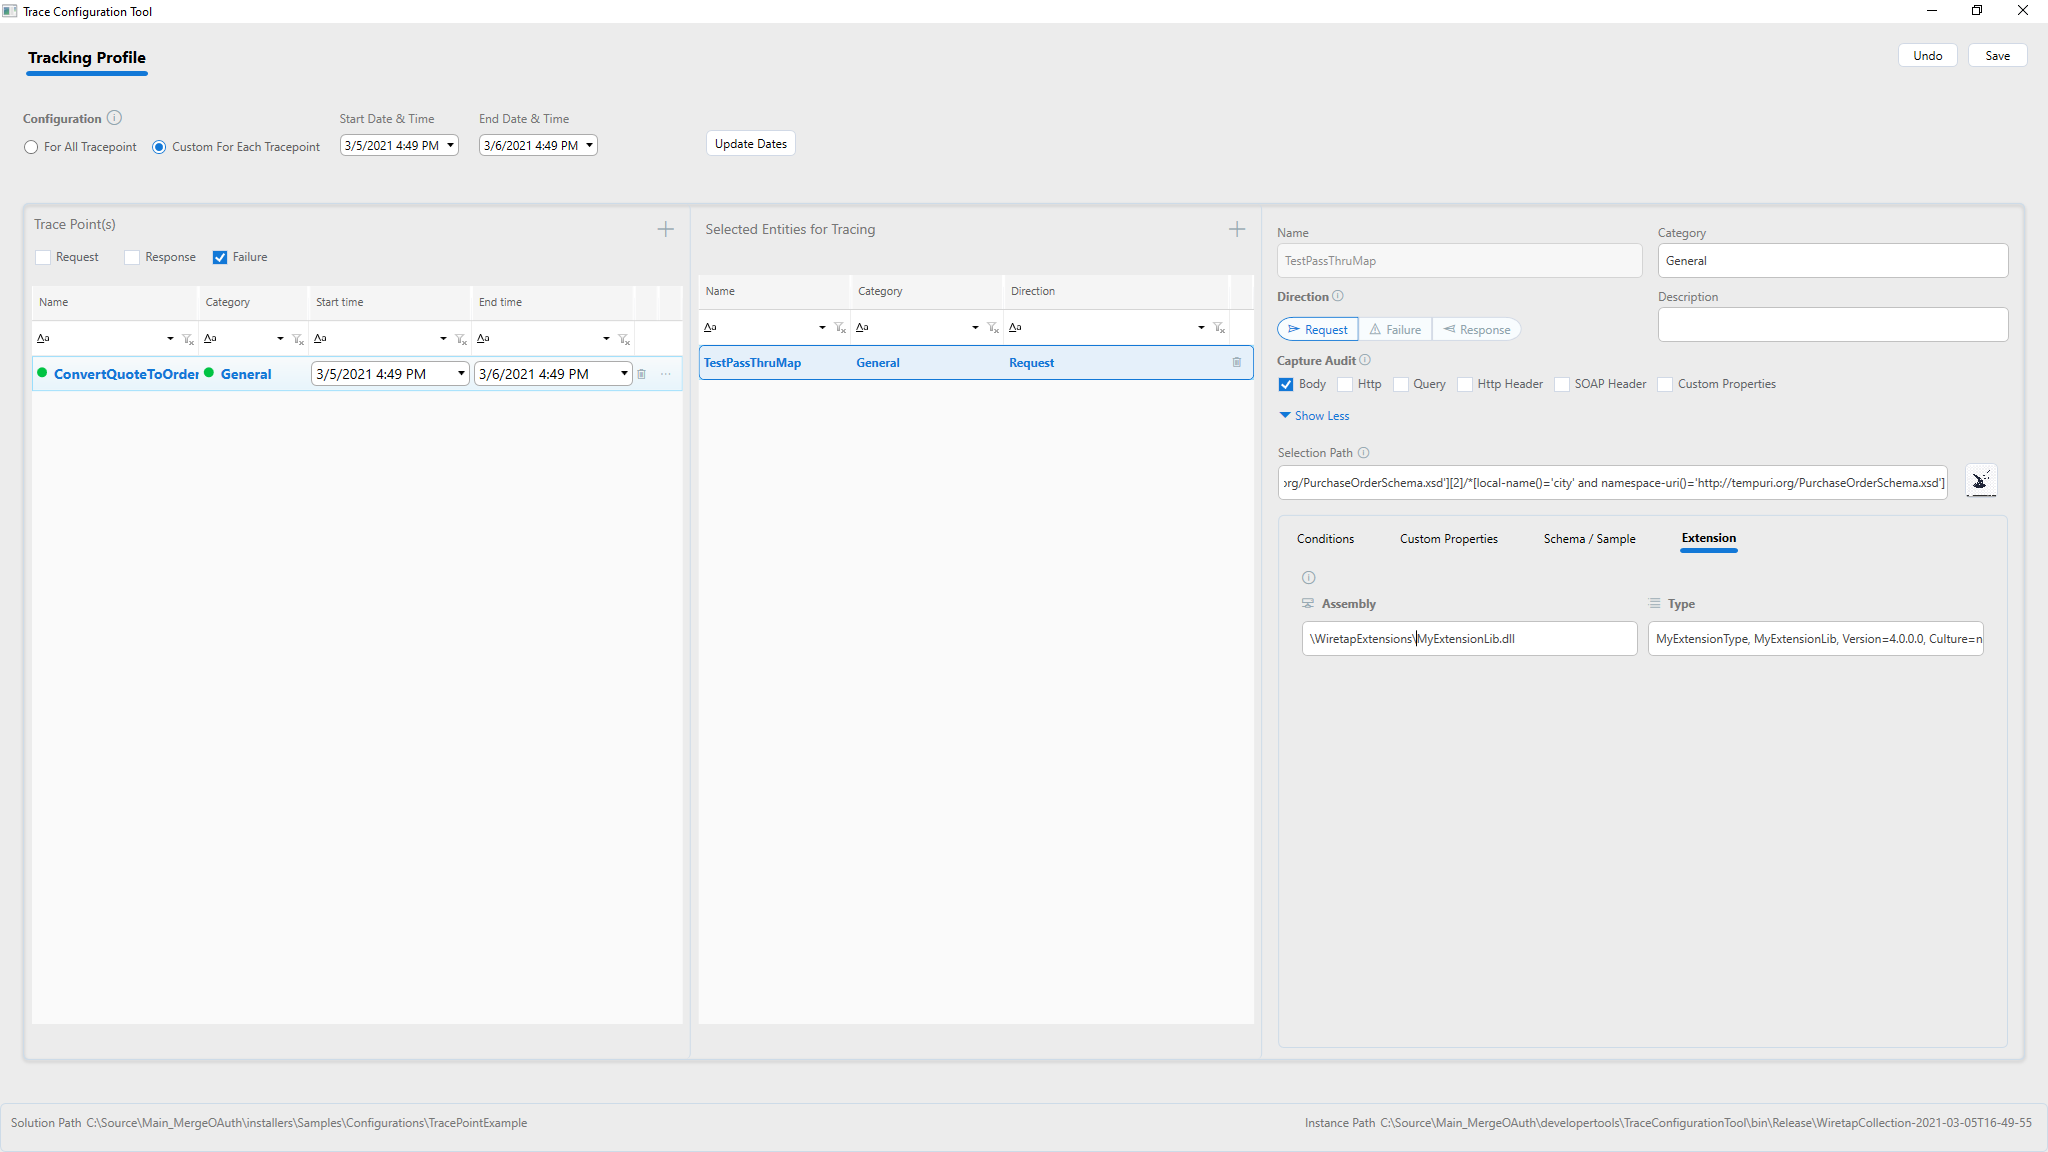
Wire up your custom extension
A custom extension can be added to capture and modify the message that is logged. This is useful for compliance scenarios. The captured messages will be run through the extension before being logged. This way the extension can scrub or mask the private information if desired (e.g., credit card numbers, social security numbers, etc.). Refer to Wiretap Extension whitepaper for more details.
Configuring Wiretap for Service Routing Tables
For Service Routing Tables, the configuration is similar except that capture requests/responses or failures can be captured for each service endpoint in the Service Routing Table associated with the selected Client Connector.
Editing Wiretap configuration
When opening the TraceConfiguration Utility from the instance folder, it opens the configured wiretap configuration. The dates may be changed, Client Connectors may be added/removed, and configuration properties can be changed and save. If starting from scratch, find and delete the Trace configuration file in the instance folder. By default, this file is located under the wiretapcollection folder. The exact location is based on the setting in appsettings.config file in the instance folder.
After that, when you TraceConfiguration Utility, a new configuration is created.
Either the Endpoint Host or the Client Connectors previously configured will have to be restarted after any changes to the configuration.
Enable / Disable Wiretap
To disable or enable this functionality, either change the start and end dates on each Client Connector or delete the configuration file. Either the Endpoint Host or the Client Connectors previously configured will have to be restarted after any changes to the configuration.
Wiretap load considerations
The Wiretap feature should be used with a limited time and for selected number of Client Connectors as needed. Since processing all the tracked messages consumes processor, memory, bandwidth, the load, message size, and latency requirements must be considered when using this method of tracing messages. Do not use this method for auditing messages regularly. For that purpose, use the Audit process step or the Audit functionality on the Service Routing Table settings.
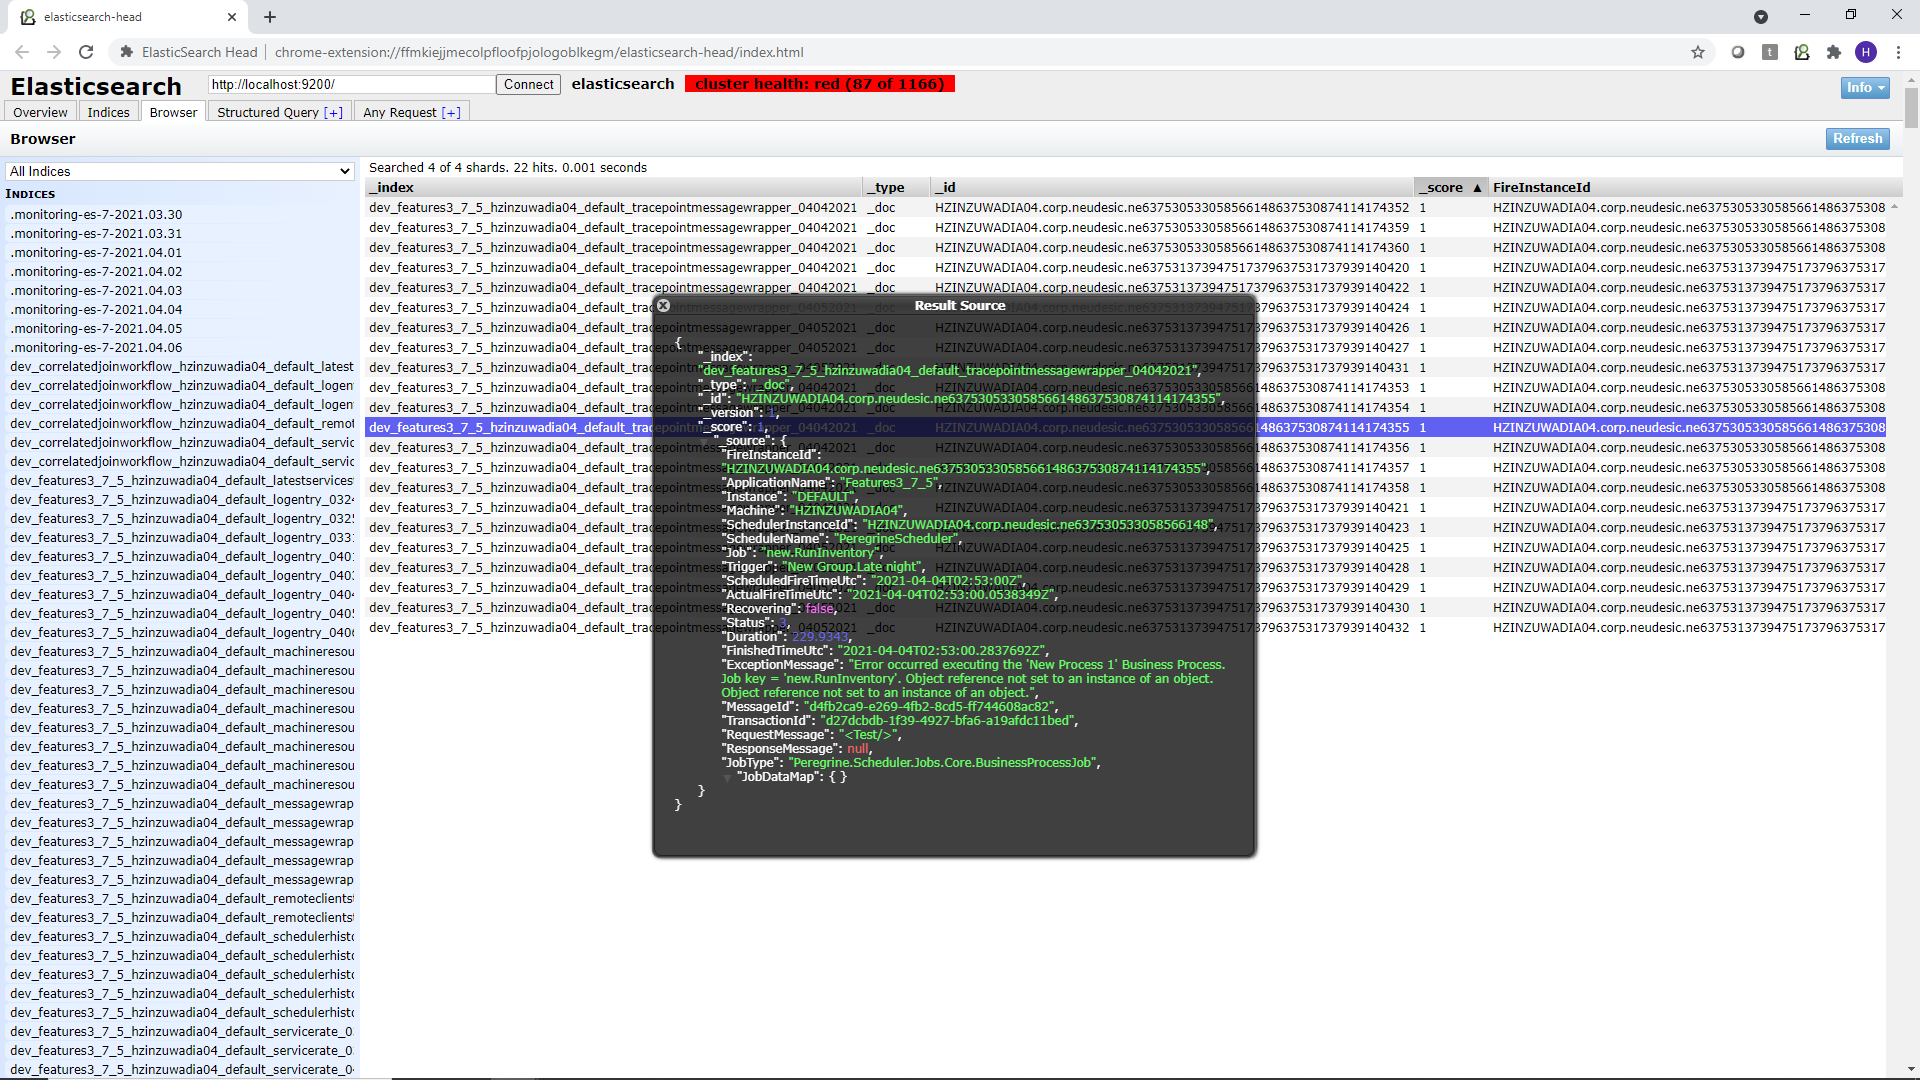
Viewing Captured Wiretap information
The information captured using the Wiretap feature is stored into Elastic Search Indexes named
DeploymentGroup_Application_Machine_Instance_tracepointmessagewrapper_mmddyyyy
You can use a tool such as Elastic Search Head to query these indexes, as shown in the screens below. Elastic Search Head is a Google Chrome extension that you can download and point to your Elastic Search Server.
Client-Side OAuth Providers
Previously, securing access to Neuron Client Connectors relied on the options offered by WCF, such as Basic, NTLM, Windows, Digest, and Certificate based authentication. Modern REST services use new standards called Open ID connect and OAuth for access control and authorization. These standards are cross-platform and cross-application standards providing great interoperability in both Intranet and Extranet environments.
Now the Neuron ESB client connectors with REST binding have an option to secure them with an OAuth provider. The OAuth providers can be any of the popular identity providers such as Azure, Amazon, Google, Okta, Thinktecture identity server, etc.
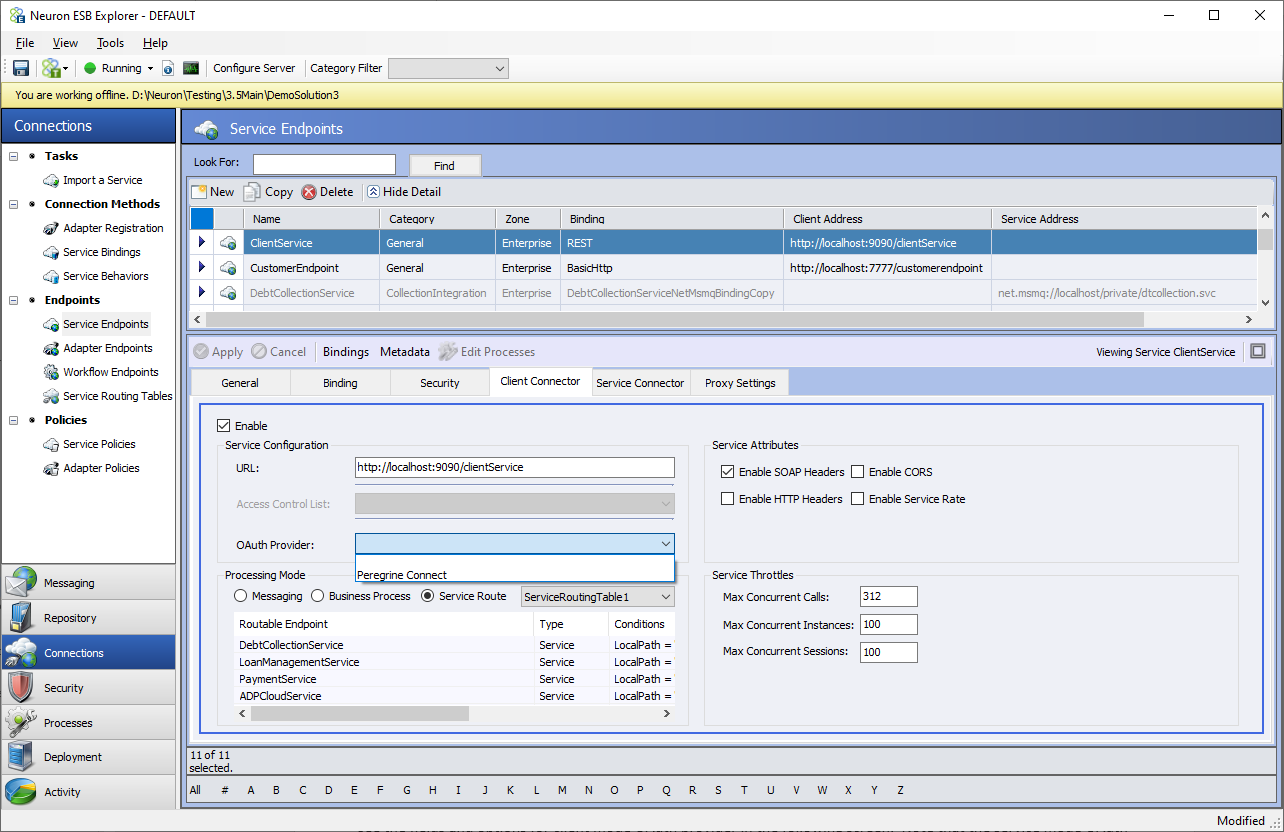
When a Client Connector is secured with OAuth, every caller needs to obtain a token from the Identity Provider and include that in the Authorization Header in the format Bearer <token>. The Neuron ESB runtime validates this token and makes the token as well as Application Id and Consumer Id available in the message context as custom HTTP headers. These properties can then be used in Neuron ESB Business Process to make decisions based on them.
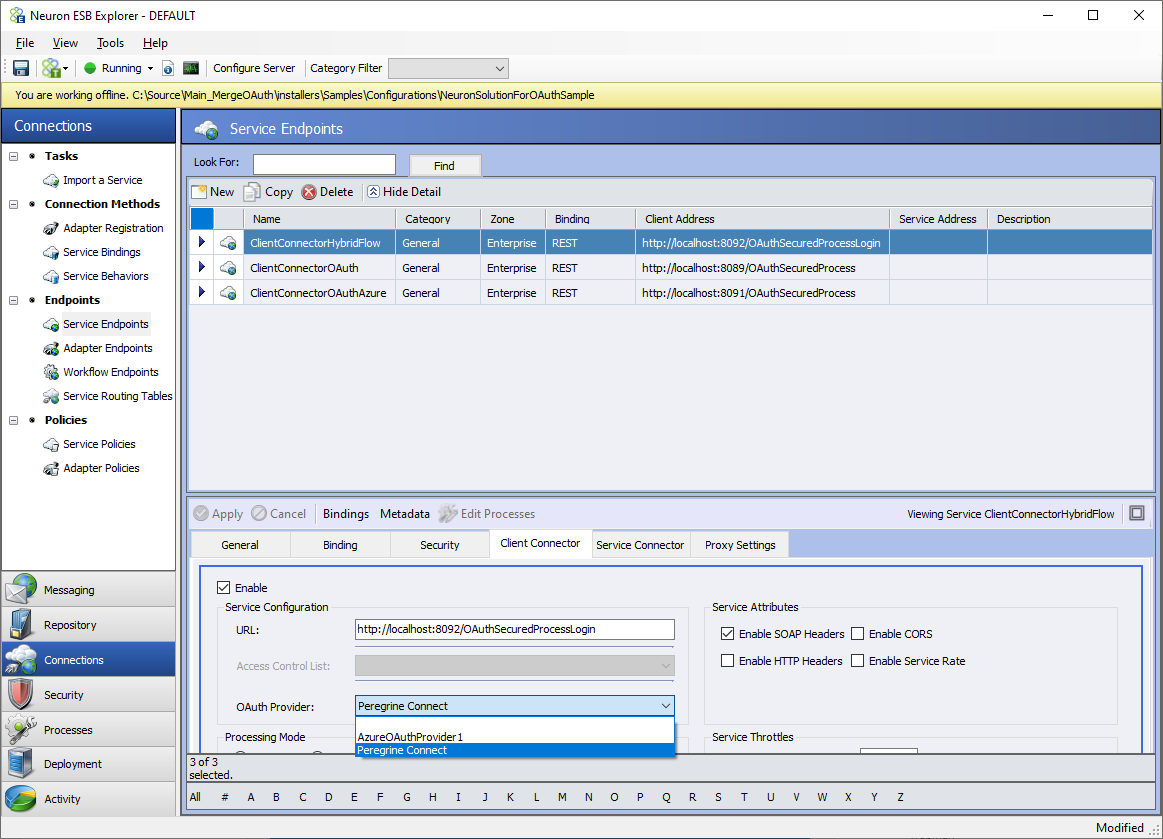
If you are using Peregrine Connect Management Suite, the built-in Peregrine Connect OAuth Provider can be used. If using this provider, the only thing that needs to be configured in the Neuron ESB Explorer solution is the OAuth Provider property on the Client Connector tab. This property should be set to “Peregrine Connect” as shown below. After that, the rest of the OAuth configuration is done within the Peregrine Connect Management Suite. The details for that setup can be found in the API management section of Peregrine Connect Management Suite 1.1.
The following sections detail how an external OAuth provider other than Peregrine Connect can be provisioned.
Adding or Editing an External OAuth Provider
An external client mode OAuth Provider must be added before it can be used to secure a Client Connector. This can be done by navigating to the Security section of the Neuron ESB Explorer and then selecting the OAuth Providers menu under the Authentication section. The screen below displays the fields and options for a selected client mode OAuth provider.
https://www.peregrineconnect.com/article/introducing-oauth-support/
In the screen below, start with changing the radio button for Provider mode to client and then select the provider from the drop-down box as shown. There are three options for Azure, AWS, and Thinktecture Identity Server respectively.
Azure and AWS are special because they add some tweaks to the OAuth implementation. In case of Azure there is an additional policy configuration for Business to Consumer websites. In the case of AWS, there is no provision for Introspection Endpoint. The Thinktecture Identity Server provider is the most generic implementation, and it works with many other providers such as Okta, Google, etc., including the on-premise implementation of the open-source Thinktecture Identity Server.
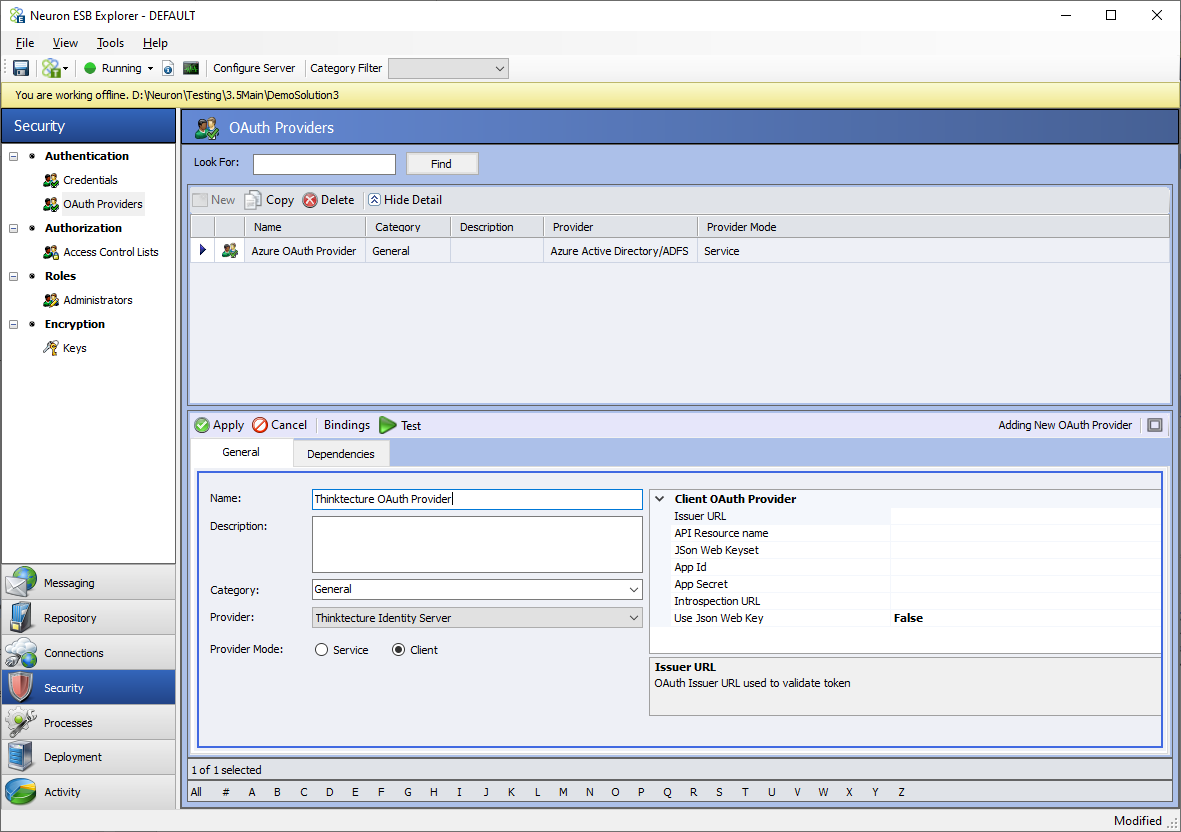
A name, description, and category can be assigned to the external OAuth provider like all other Neuron ESB artifacts. The remainder of the configuration properties for the providers can be found in the grid below.
| Field Name | Description | Applies To |
| Issuer URL | This is the URL that will identify your unique provider in Azure, AWS or any other Generic cloud base identity server provider and the Identity Server Host in case of On-premise server. | All providers |
| API Resource Name | This is the unique name assigned to one or more client connectors group that you are secure with the same scheme. Also known as application name. | All providers |
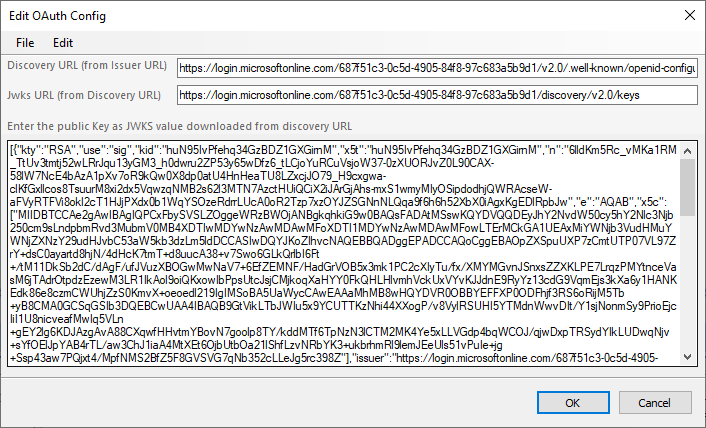
| JSON Web Keyset | Set of public keys to be used for decrypting encrypted messages by the OAuth server with their private key. This value can be generally downloaded from the well-known endpoint of the Issuer URL. When you click … the button next to the field value, you can open the dialog box to copy this value from. Example screen shot is shown below. | All providers |
| Policy | In the case of Azure Active Directory B2C this is an additional setting to identify your subscription. | Only Azure |
| App Id | App Id and App Secret are used to validate token using the Introspection method. Consult Identity Server documentation for details. | Only Thinktecture Identity Server |
| App Secret | Only Thinktecture Identity Server | |
| Introspection URL | This is the URL used by Neuron Runtime to validate the token that is presented in the Authorization Header. | Only Thinktecture Identity Server |
| Use JSON Web Key | When set to true, Neuron Runtime will not validate using Introspection URL but rather use the JSON Web key to validate token. Works in scenarios where Neuron runtime doesn’t have Internet Access. | Only Thinktecture Identity Server |
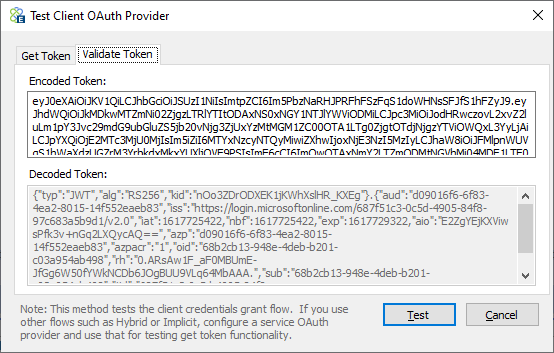
Testing External OAuth Provider
The external OAuth provider can be tested by using the Test button, as shown below.
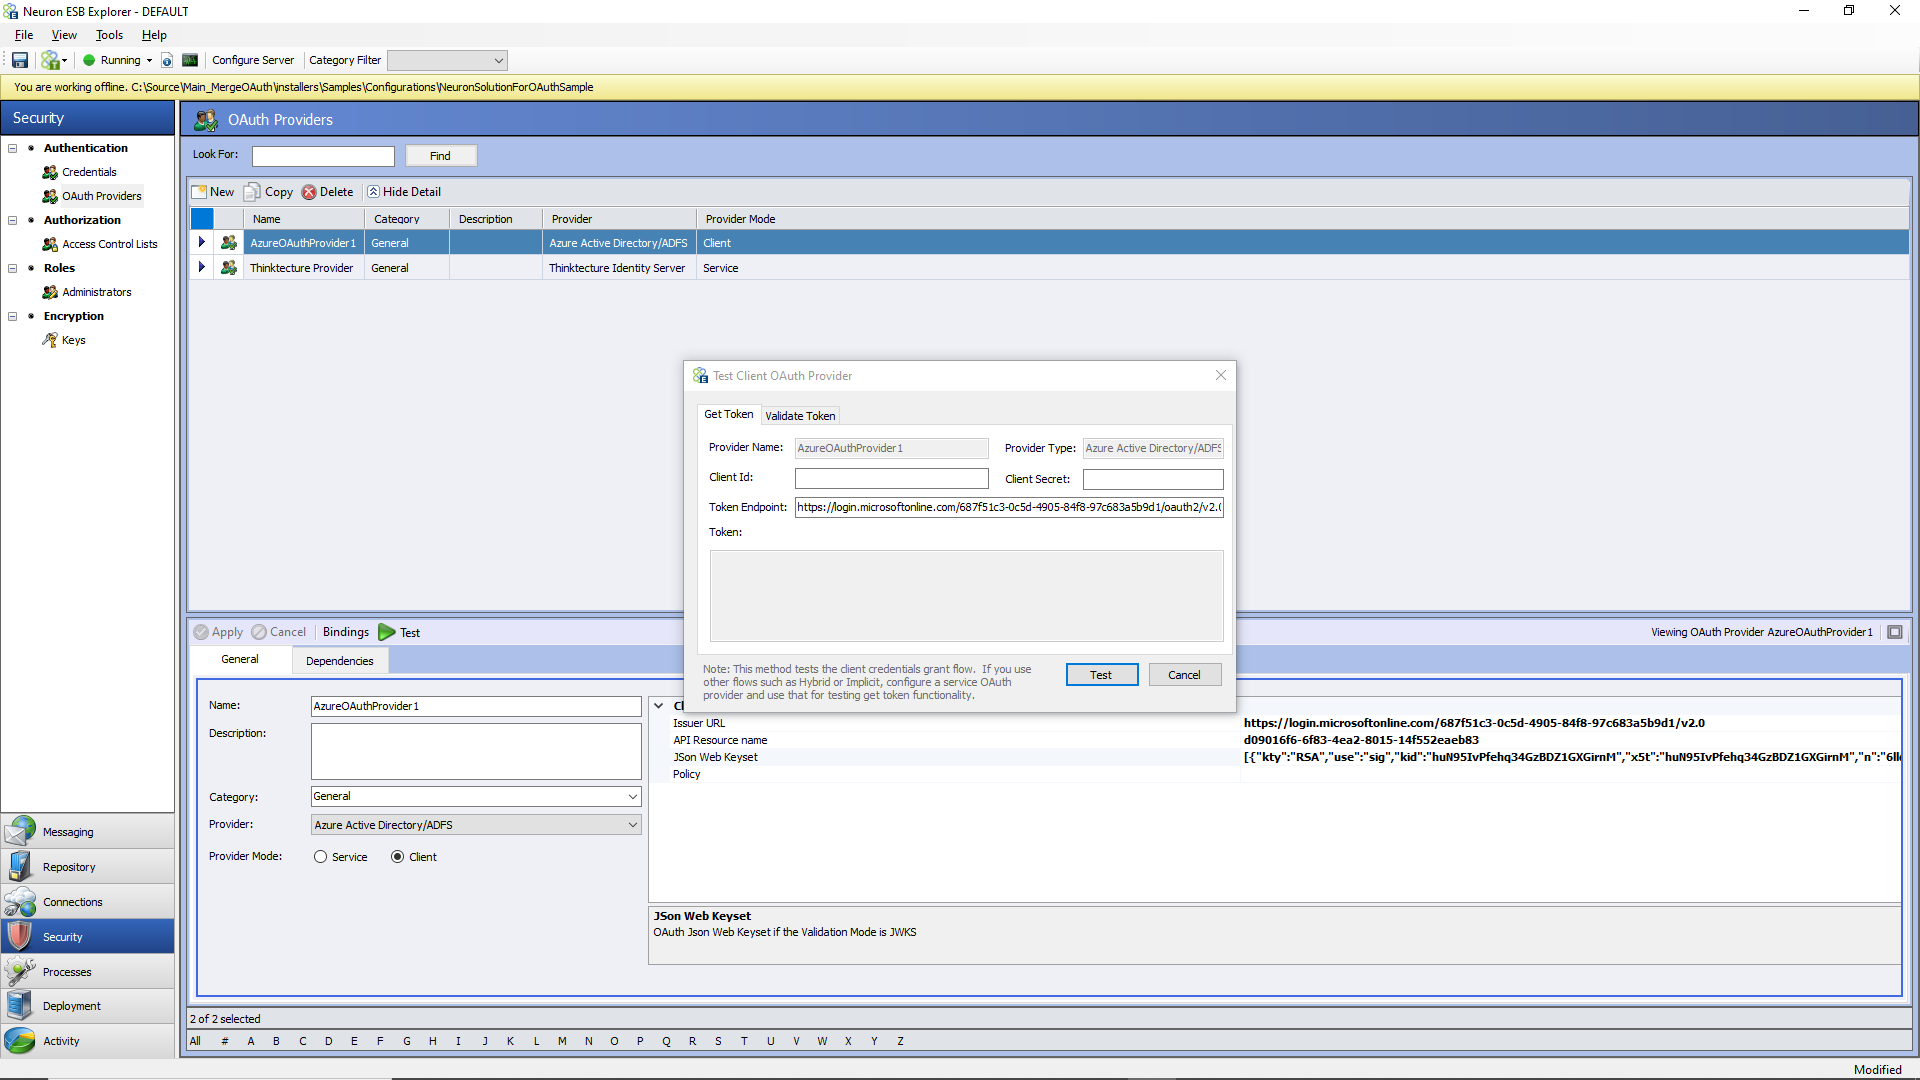
On the “Get Token” tab, a client id, client secret, and token endpoint from the provider must be entered so that a token can be issued and returned using the first part of the above screen and clicking the Test button. Once the token is returned, it will be visible in the Token property window shown below.
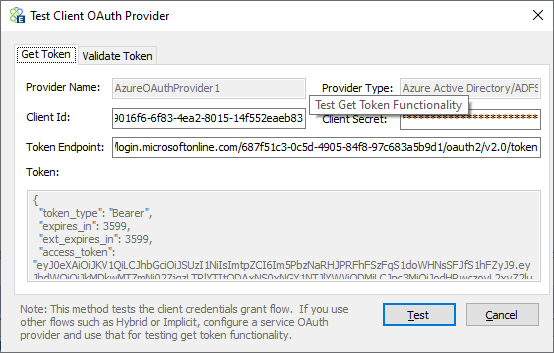
To validate the token, copy the token’s text from the Token property window, navigate to the “Validate Token” tab, and paste the contents of the token into the “Encoded Token” text box, and the decoded text of the token will appear in the “Decoded Token” text box below it.
Using OAuth Provider with Client Connector
Once a client mode OAuth Provider has been configured it can be assigned to a Client Connector. Having a REST binding with Security Model set to “None” or “Transport None” is a pre-condition to use an OAuth provider with a Client Connector.
Assigning OAuth Provider
The following screen displays the Client Connector portion of the Service Endpoint Screen to select the OAuth provider. The OAuth provider box will show all the configured OAuth providers and built-in Peregrine Connect OAuth Provider. Do not select the Peregrine Connect OAuth provider if the Peregrine Connect Management Suite is not being used.
Select the OAuth provider, apply and save the Service Endpoint.
Removing or changing OAuth Provider
To remove the OAuth provider associated with the Client Connector, change the drop-down box to no selection select another OAuth provider. Remember if the OAuth provider is changed, the consumers of Client Connectors will have to change the way they obtain their tokens.
Using Tokens in Business Process
Neuron ESB runtime places three new headers in the HTTP Headers of the ESBMessage that is passed on into the business process. They are Token, ConsumerId, and OAuthAppId.
Read Token contents
The structure of the token may vary slightly based on the provider. Test your implementation to get the exact structure. The following shows a typical OAuth token.
{
"nbf": 1617456481,
"exp": 1648560481,
"iss": "https://hzinzuwadia04:8080/authsvc",
"aud": "Portal",
"client_id": "clientforesbservices",
"jti": "C18704D59E3C6D4F2E9A0346B9ADC12A",
"iat": 1617456481,
"scope": [
"Portal"
]
}
Implement Logic based on Scopes
The values of the token contents, Consumer Id, and App Id can then be used in Business Process steps to check their contents and make decisions based on the Token Contents, Consumer Id, or App Id. In addition, the Tokencontains scopes and audience. These properties can be checked to restrict certain steps of the Business Process or filter the results based on some security rule.
Client OAuth Samples
To make Client-Side OAuth easier to understand, Neuron ESB Ships with a new sample demonstrates the ability to use Client-Side OAuth Providers. The sample is comprehensive in that it walks the user through configuration and setup as well as accessing the Token information within a Business Proceess. The sample can be accessed through the Sample Browser of the Neuron ESB Explorer. Its documentation can be found here:
https://www.peregrineconnect.com/documentation-kb/securing-client-connectors-with-oauth-sample/
Business Process Scheduling
An exciting new feature that ships with the Neuron ESB 3.7.5 in conjunction with the Peregrine Connect Management Suite 1.1 is the Job Scheduler. The Peregrine Management Suite Job Scheduler uses the Quartz job scheduling framework (https://www.quartz-scheduler.net/documentation/) that lets organizations schedule Neuron ESB Business Processes to be executed later, either just once or periodically. In the Job Scheduler, users can add new jobs, triggers, remove old ones, and create complex schedules for executing any job. Examples are e.g., tasks that run daily, every other Friday at 7:30 p.m., or only on the last day of every month or year. When the Job Scheduler is stopped due to an unexpected event, it will store the jobs in the Neuron ESB database. They will also survive Job Scheduler and runtime restarts and maintain their state. When the Job Scheduler is restarted, it will run all the jobs it should have run while it offline.
The Job Scheduler includes several features, including:
- Support for Custom Jobs
- Scheduling any Business Process
- Reporting History
- Calendars
- Triggers
- CRON expressions
- Passing Messages and custom data to Jobs
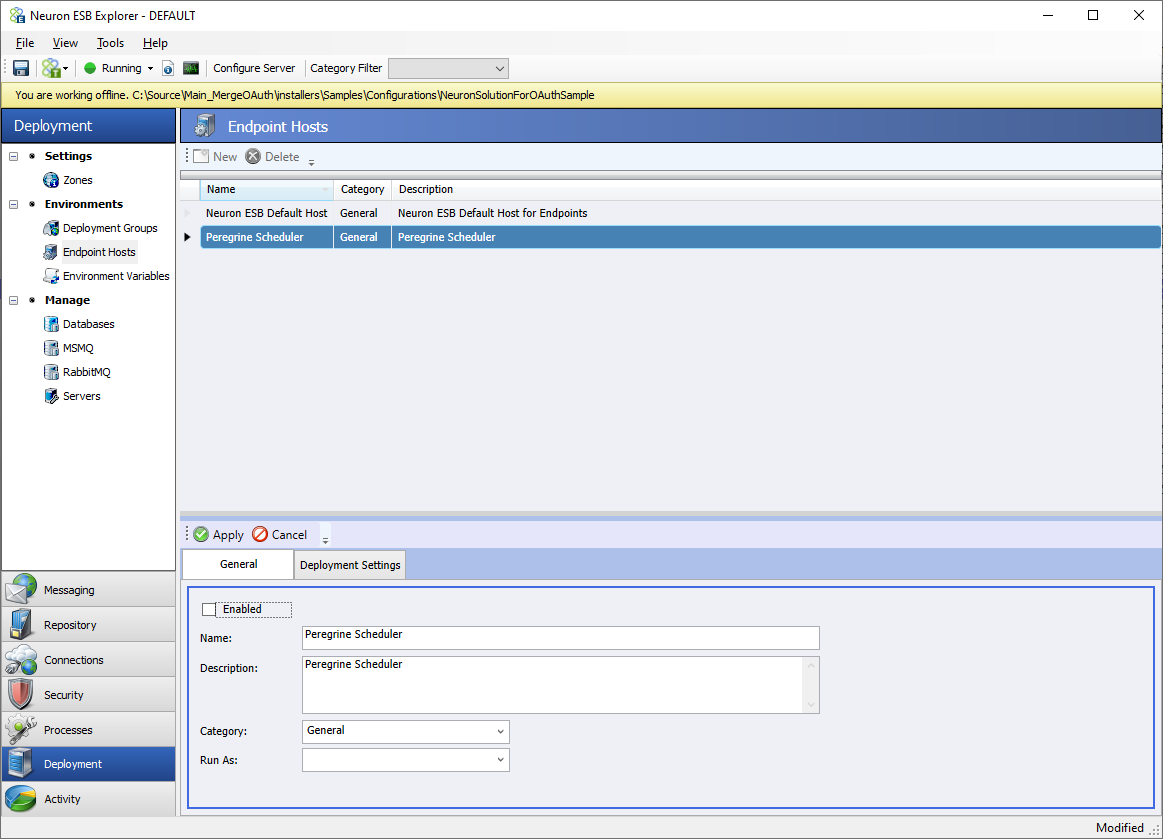
While the Peregrine Connect Management Suite is used to configure Business Processes to run as scheduled Jobs, the actual runtime for the Scheduler is shipped with Neuron ESB 3.7.5 in the form of a special, dedicated Neuron Endpoint Host named “Peregrine Scheduler.” This Endpoint Host can not be deleted, but it can be disabled.
Both Neuron ESB 3.7.5 and the Peregrine Connect Management Suite are required to use the new Job Scheduler functionality.
It is often a requirement of integration that data sources be queried for updated information regularly. This can be for many reasons, and most developers can think of at least three right off the top of their head.
Neuron ESB ships with a number of adapters and allows for the development of custom adapters. When used in conjunction with their polling and availability functionality, can easily accomplish this task. However, what happens when you wish to have the same polling on a schedule functionality for web services? What about when you need to have an adapter stop polling on specific days such as holidays and don’t want to shut down the adapter manually? This is where the Job Scheduler comes into play and provides you the flexibility and functionality to address these scenarios.
The Job Scheduler allows any Business Process within a Neuron ESB solution can be scheduled as a Job. Scheduled Business Processes are not limited in functionality in any way, nor do they need to be appended with a Cancel Process Step. That means that adapter and service endpoints can be called within them. Even messages can be published to Topics and later processed by Workflows.
The Job Scheduler also injects custom properties and messages that can be defined at the Job level. Once defined in the Job Scheduler, they can be accessed and modified at the Business Process level. Information modified during the Business Process execution is accessible to subsequent executions of the same Business Process job.
For instance, the code snippet below shows how a property named “ConnectionString” can be retrieved from the Job Scheduler and used within a Business Process C# Process Step.
//Parse the value returned by web service
dynamic currencyObj = JObject.Parse(context.Data.Text);
Decimal AUDRate = System.Convert.ToDecimal(currencyObj.rates.AUD.Value);
Decimal USDRate = System.Convert.ToDecimal(currencyObj.rates.USD.Value);
Decimal GBPRate = System.Convert.ToDecimal(currencyObj.rates.GBP.Value);
Decimal CADRate = System.Convert.ToDecimal(currencyObj.rates.CAD.Value);
string connString;
//Get the connection string from Job Data Map of Scheduler.

Context.Instance.Scheduler.Properties.TryGetValue("ConnectionString",out connString);

if (string.IsNullOrEmpty(connString))
  throw new ApplicationException ("Connection String Job Property is required to save currency data");
//Make the database call to save the data.

using (var conn = new SqlConnection(connString)) //@"Server=.\SQLEXPRESS;Integrated Security=true;Database=JobSchedulingDemo;"))
{
  var cmd = new SqlCommand("insert into dbo.CurrencyRates (timestamp, Base, Date, USD, AUD, CAD, GBP) values (@timestamp, @Base, @Date, @USD, @AUD, @CAD, @GBP)", conn);

cmd.Parameters.AddWithValue("@timestamp", DateTime.Now);
cmd.Parameters.AddWithValue("@base", "EUR");
cmd.Parameters.AddWithValue("@Date", DateTime.Now);
cmd.Parameters.Add("@USD", System.Data.SqlDbType.Decimal).Value = USDRate;
cmd.Parameters.Add("@AUD",System.Data.SqlDbType.Decimal).Value = AUDRate;
cmd.Parameters.Add("@CAD",System.Data.SqlDbType.Decimal).Value = CADRate;
cmd.Parameters.Add("@GBP", System.Data.SqlDbType.Decimal).Value = GBPRate;

conn.Open();

cmd.ExecuteNonQuery();

conn.Close();
}
Additionally, the properties of the last job run can be accessed and modified within a Business Process, as shown below in the C# editor.
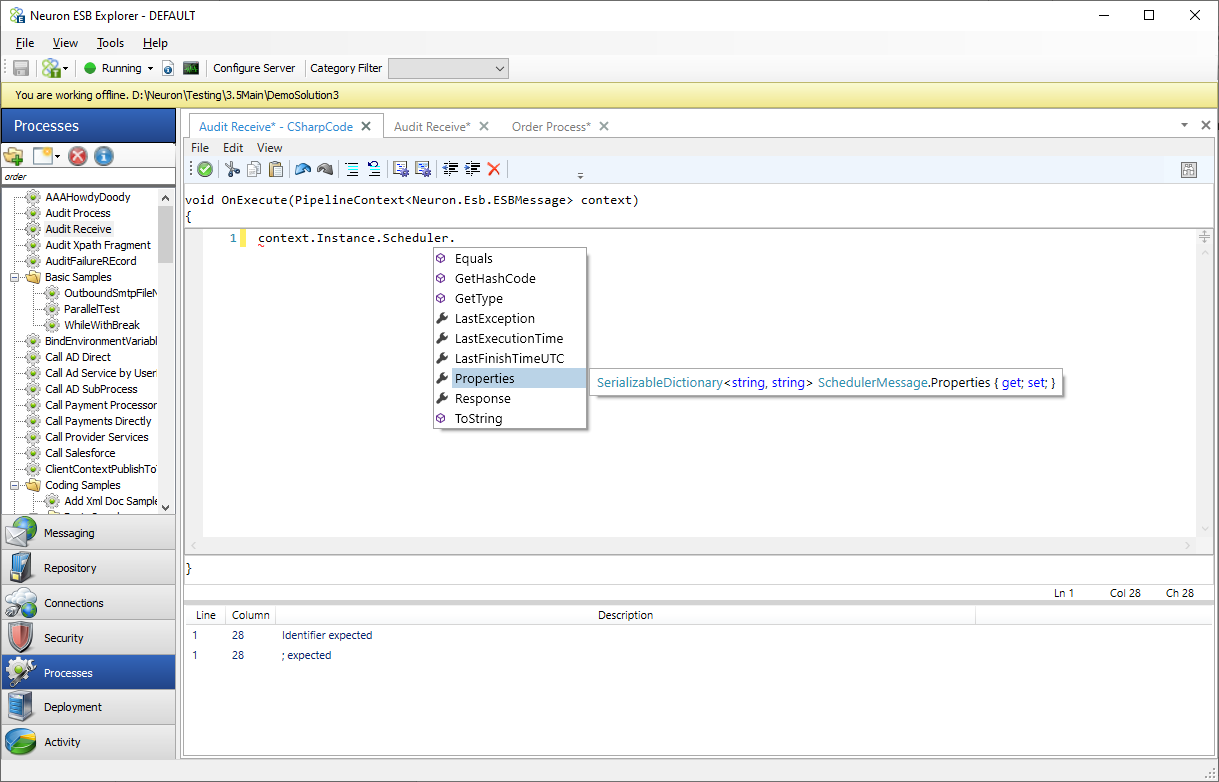
There are many reasons why users may want to modify the Job Properties or add a Job Property from a scheduled Business Process. For example, in the previous code snippet the Last AUD rate could be added as a custom property by adding it to context.Instance.Scheduler.Properties as shown below.
context.Instance.Scheduler.Properties["AUDRate"] = 2.45;
Taking this approach, the last AUD Rate would always be available to the Business Process anytime it was executed.
The Job Scheduler is a powerful piece of technology shipping with Neuron ESB 3.7.5 and the Peregrine Connect Management Suite. To learn more about the Job Scheduler, please review the Peregrine Connect Management Suite Job Scheduler documentation and the samples we ship.
Rabbit MQ Quorum Queues
Neuron Topics using RabbitMQ as the transport now includes support for the Quorum queue type. The Quorum queue type offers increased data safety and equal or better throughput for the underlying topic’s queues when compared with classic, durable, mirrored queues.
Quorum queues are implemented by RabbitMQ using a durable, replicated FIFO queue based on the Raft consensus algorithm (more information on Raft can be read here: https://raft.github.io/). They are desirable when data safety is a top priority and should be used as the default option where replicated queues are desired.
More information about RabbitMQ and their Quorum Queue implementation can be found here: https://www.rabbitmq.com/quorum-queues.html
Requirements
- A RabbitMQ server(s) with minimum version 3.8.0
- A RabbitMQ cluster with at least 3 RabbitMQ nodes
- A Neuron ESB installation with minimum version 3.7.5.327
Setting up the Neuron Solution
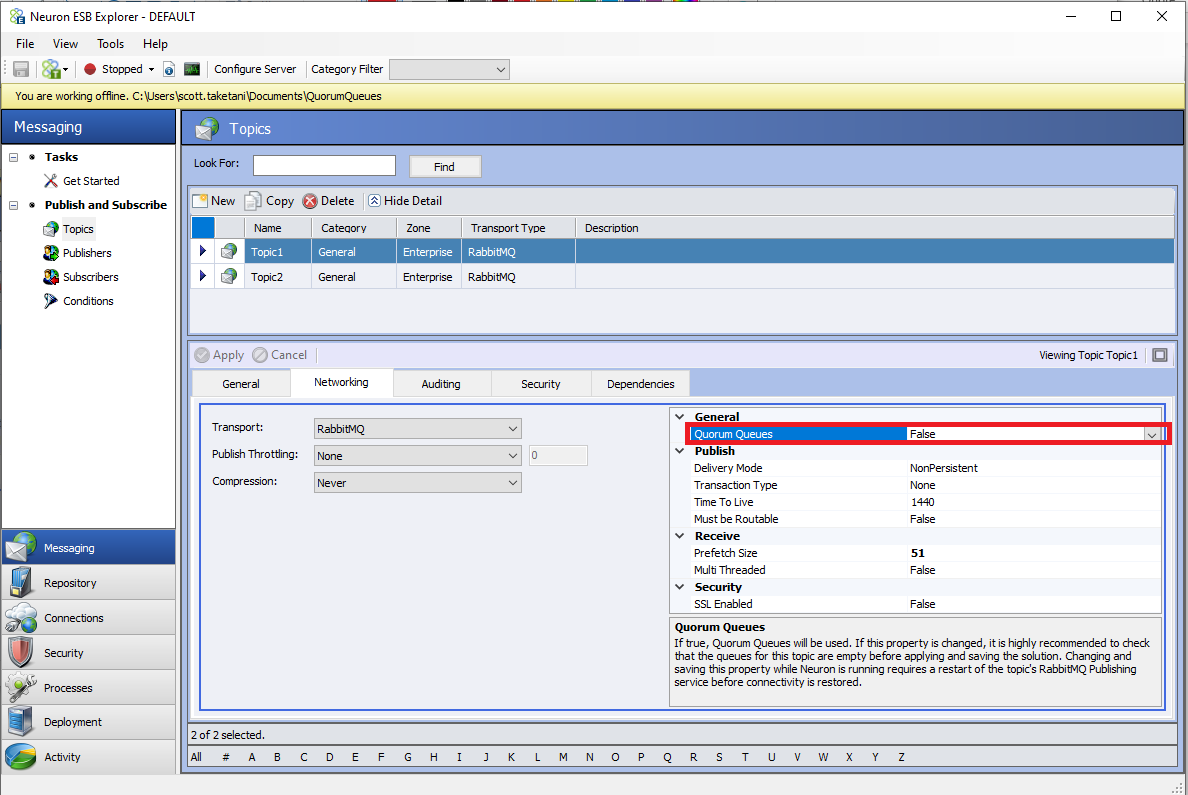
The following screenshot shows a new property for RabbitMQ Topics in the Networking tab called “Quorum Queues.” By setting this property to true, Neuron will attempt to create the underlying topic’s queues using the “x-queue-type” RabbitMQ argument set to “quorum” (as opposed to “classic”).
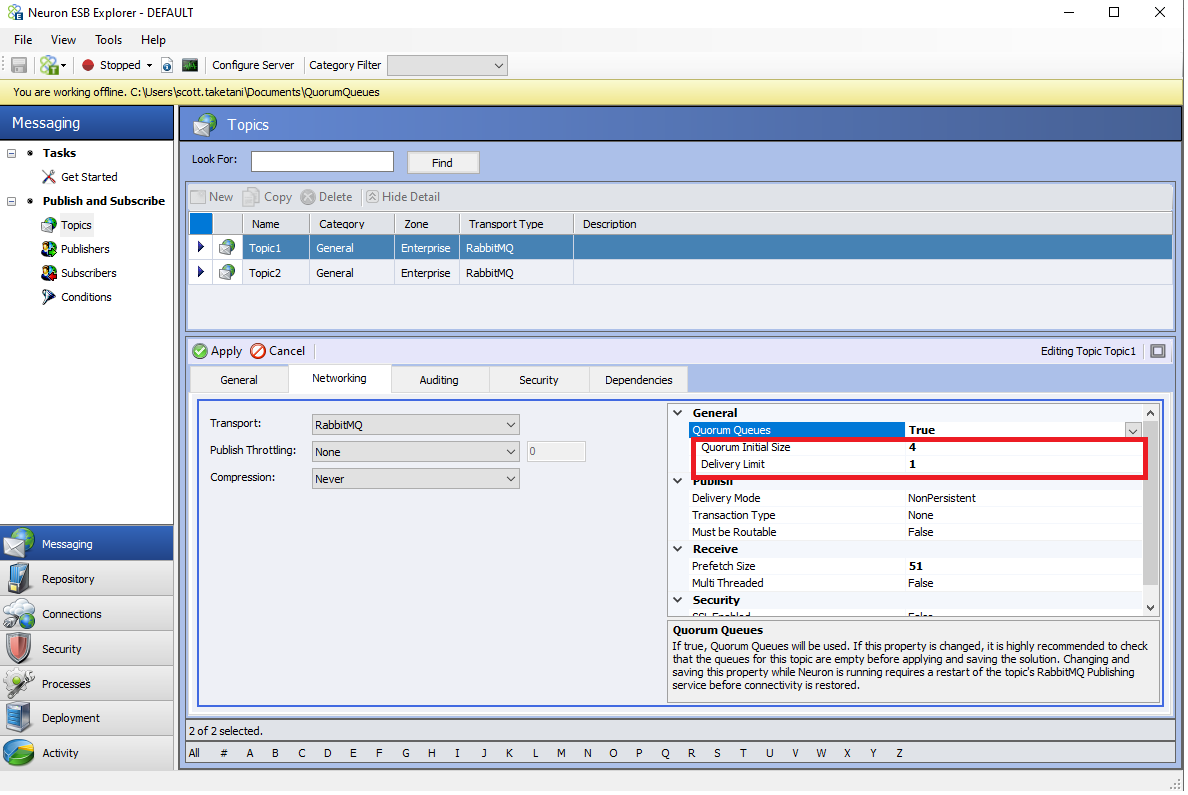
After enabling the Quorum Queues property, the properties “Quorum Initial Size” and “Delivery Limit” will be shown, and the property “Time to Live” under the Publish section will be hidden (“Time to Live” is not supported as of now for Quorum type queues):
New Quorum Queue Properties
| Property Name | Description |
| Quorum Queues | This setting determines if Quorum Queues will be used for the underlying Topic’s RabbitMQ queues. This does not affect the type of queue used for the Dead Letter Exchange. If a Quorum Queue is desired for the Neuron Instance’s Dead Letter Exchange, the setting “UseQuorumQueueForDeadLetters” is found in the appSettings.config file should be set to true. |
| Quorum Initial Size | The number of nodes that will participate in the Quorum and the number of nodes that the queues will be replicated to initially |
| Delivery Limit | Used for poison message handling. This is the number of attempts that will be performed to redeliver a message if the first attempt to deliver fails. This is implemented as a Queue Policy on the Neuron Topic’s underlying queues. |
If the Quorum Queues property is changed, applied, and saved in a running Neuron Solution, the Neuron Topic’s RabbitMQ Publishing service must be restarted either in Neuron Explorer’s Endpoint Health page, or by restarting the entire ESB Service. Otherwise, any Neuron Parties subscribed to the topic will remain disconnected and any Parties attempting to connect to the topic will not succeed. Any messages published during this time will fail and be audited to the Failed Messages database table.
After changing queue types, restarting the Publishing service will cause the existing queues to be deleted and recreated with the desired type if there are no messages still in the queue. If there are messages in the queue, the queues will not be deleted, and the topic will fail to reconfigure. Therefore, it is highly recommended to drain the queue before saving the Neuron Solution if the queue type has changed (i.e., the “Quorum Queues” property was switched).
After performing the restart of the Publishing Service, any Neuron Parties that were disconnected should now automatically reconnect.
Delivery Limit
The Delivery Limit mechanism is used for poison message handling in place of Time To Live. This property is implemented in RabbitMQ as a Queue Policy (the policy property is called “delivery-limit” and is of type Number). The creation and deletion of this policy is handled automatically by Neuron and can’t be used for Classic type queues.
The format of the created policy’s name is as follows:
NEURON.<Neuron Instance Name>.<Topic Name>_DeliveryLimitPolicy
The policy’s definition only includes the “delivery-limit” property. The policy’s matching pattern (which determines which queues to apply it to) is of the format:
NEURON.<Neuron Instance Name>.<Topic Name>_.*
There will be a policy created for every Quorum Queue type Neuron Topic.
Other Properties
All other properties should behave the same as when using classic type queues. Please see the following article for more information on RabbitMQ Topics in Neuron: https://www.peregrineconnect.com/article/rabbit-mq-topics/
Dead Letter Exchange
The Neuron Instance’s Dead Letter Exchange for RabbitMQ Topics can also be set to use a Quorum Queue. This is not controlled by a Neuron Solution setting but rather an entry in the appSettings.config file found in the Neuron Instance’s directory (default installation path: “C:\Program Files\Neudesic\Neuron ESB v3\DEFAULT”).
UseQuorumQueueForDeadLetters
This property determines if a Quorum Queue will be used for the Dead Letter Exchange. Unlike the property in a RabbitMQ Topic’s Network properties, switching this setting has no effect until the ESBService is restarted since the Dead Letter Exchange is per Neuron Instance.
However, like the Topic level property, the Queue will be automatically managed upon starting/restarting the Neuron Instance.
DeadLetterQuorumInitialSize
Similar to the Topic level property, this setting determines the number of nodes that will participate in the Quorum and the number of nodes the queue will be replicated too initially.
Other Considerations
The number of RabbitMQ nodes in the RabbitMQ cluster should be an odd number. This is because Quorums need to have a majority to work properly for the voting mechanism. Although this number can be even, if it is, then the Quorum mechanism may not work properly if a majority cannot be established.
Also, the guidance from RabbitMQ states that seven nodes should be the upper limit for the Quorum size and above five nodes cause performance to drop. Please see the Performance Characteristics section found here: https://www.rabbitmq.com/quorum-queues.html#performance
About the Author
Marty has almost 30 years of experience in the software development industry. He joined Peregrine Connect after six years as a Regional Program Manager in the Connected Systems Division at Microsoft. His responsibilities there included building out Microsoft’s BizTalk Server product integration business, managing a team of SOA/ESB/BPM field specialists and building strategic partner alliances. Marty created the Microsoft Virtual Technical Specialist program and owned the development of Microsoft’s Enterprise Service Bus Toolkit.
Read more about Peregrine Connect

-
Rabbit MQ Topics
Introduction Due to the open-source nature of RabbitMQ and constant updates, it is...
-
Port Sharing
One of Neuron ESB’s scalability features is the ability to install multiple...

-
The Integration Journey to...
The Integration Journey to Digital Transformation with Peregrine Connect
-
Saving Time and Money by...
Neuron ESB Application Integration and Web Service Platform: A Real-World Example...

-
Neo PLM
-
Loomis Case Study
Loomis Chooses Peregrine Connect as Their No/Low-Code Integration Platform:...

-

Decision Test Data Mapping
- Use decisions to drive the execution of...
-
Map Testing
Learn how to utilize FlightPath's testing functions...