Peregrine Connect Management Suite 1.1 Released!
The Peregrine Connect Management Suite introduces the next level of excellence in the Integration Market. The Management Suite provides a world-class, comprehensive web-based portal that allows organizations to securely manage and monitor all Neuron ESB deployment environments, the resources within them, and the applications deployed to them.
The Peregrine Connect Integration Platform provides a suite of applications that empowers organizations to simplify the design, deployment, and management of their enterprise integration needs. The flexible and powerful Peregrine Connect platform helps organizations meet any integration demand – from on-premise and cloud applications to various data sources and devices. With the Peregrine Connect Integration Platform, any number of workloads can be simplified, deployed, and monitored; from API Management and automated Workflow to scheduled integration flows.
The Peregrine Connect Integration Platform fits well for organizations that need to integrate services and Line of Business applications, as well as provides invaluable capabilities for proactive monitoring and management. Peregrine Connect ensures business continuity while reducing the disruptions that can occur with other integration platforms. Peregrine Connect’s family of products includes a range of capabilities that are specifically designed to work seamlessly with each other.
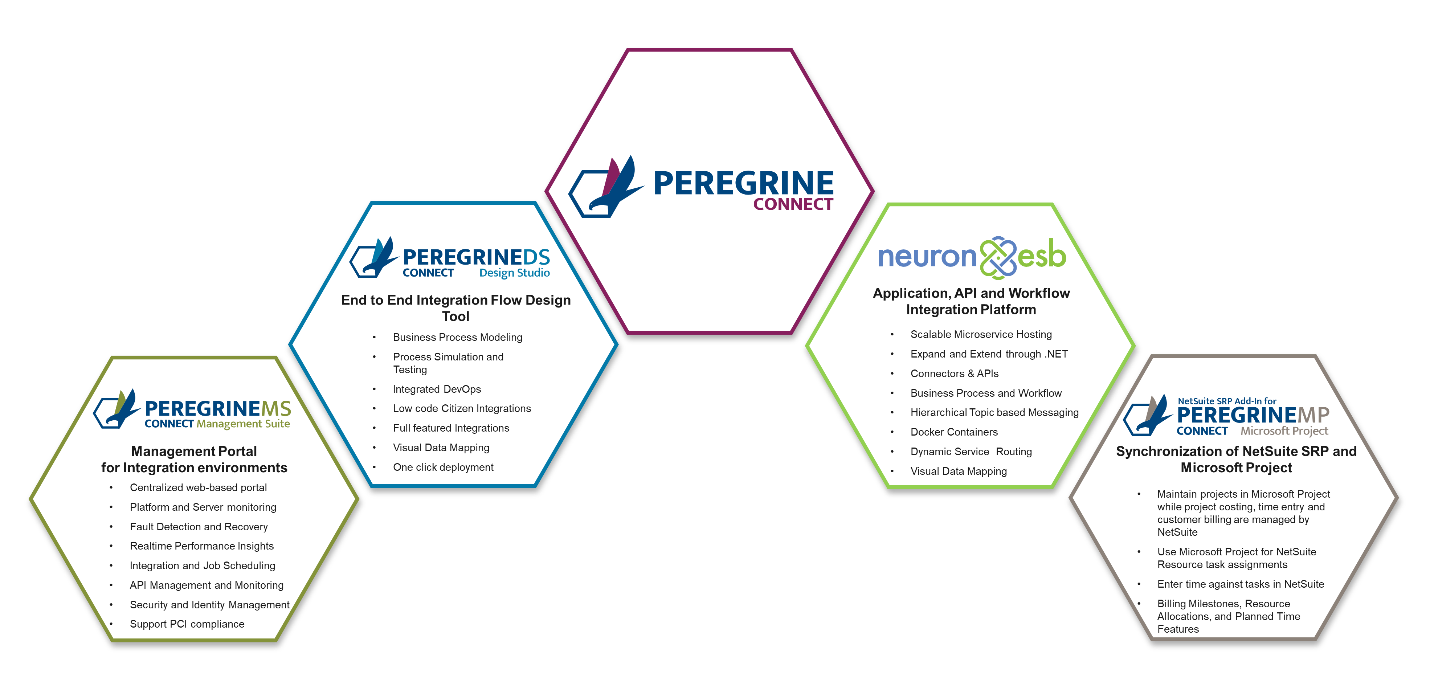
This release of Peregrine Connect introduces an array of new and complementary capabilities within the Management Suite and Neuron ESB. Together, they provide a level of synergy that allows organizations to swiftly accomplish most of their application integration, workflow automation, and API management goals.
Management Suite 1.1
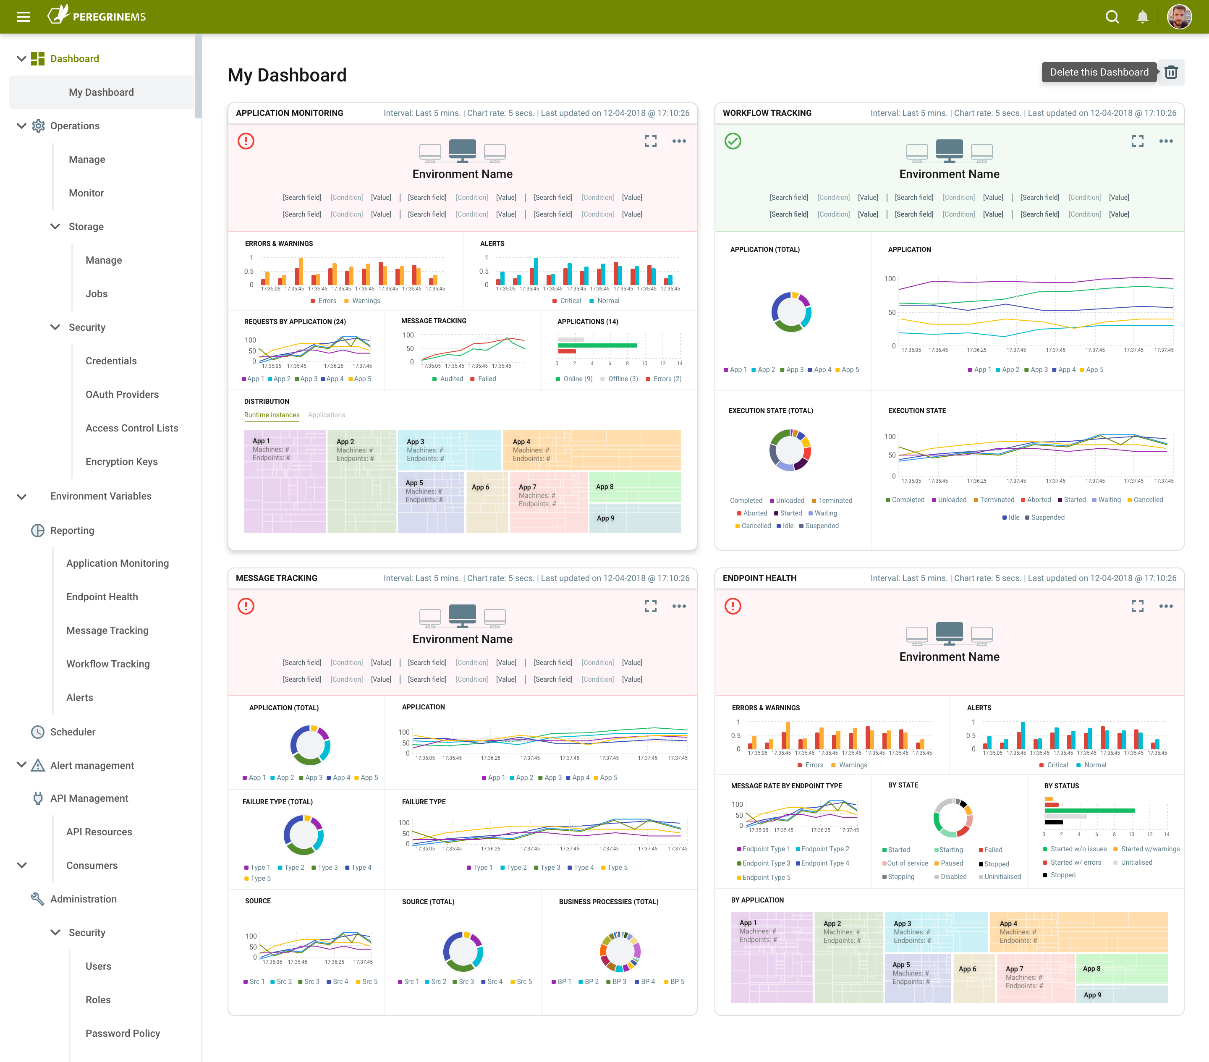
The Management Suite stands well above all other competitors in the field when it comes to the daily management and monitoring of deployed solutions. Whether these environments are deployed on-premise or in the cloud, once managed API Resources can be created and secured, Business Processes can be scheduled, Alerts can be operationalized and subscribed to and historical and real-time monitoring can be made available for the applications deployed. Dashboards can be created for swift and easy access to features used the most. The Management Suite provides organizations with hawk-like visibility into current and historical performance metrics.
Once Neuron ESB environments are configured to be managed through the Peregrine Connect’s Management Suite, organizations gain access to new capabilities through Neuron ESB:
- Task based User and Role Security
- Environment Management and Monitoring
- Application Monitoring and Reporting
- Alerting and Notifications
- Job Scheduling
- API Management
Peregrine Connect’s Management Suite allows secure access to the web-based portal and provides OAuth and Open ID authorization and access control (API Management) for Neuron ESB-hosted service endpoints (i.e. Client Connectors).
The Peregrine Connect Management Suite allows users to perform extended operations some of which are:
- Create Dashboards that provide an at-a-glance view from portions of other pages under Management Suite. For example, you may add a dashboard that shows Application Health Information about specific endpoints such as Ordering and Shipping APIs.
- View Service Endpoints, Adapter Endpoints, Workflows and Topics health and service rate information as well as errors and warnings.
- Schedule and monitor integration batch jobs that are defined using Neuron Business Processes or custom .NET Core assemblies.
- Search and view tracked messages and workflow.
- Set up alerts and notifications for certain exceptions and conditions at both the operational and application level
- Search workflow instances and logged messages from all services running in various Neuron Environments.
- Schedule and perform housekeeping operations such as backup, recovery, disk cleanup, etc.
- Provide OAuth access control to various APIs (group of Neuron ESB Client Connectors) hosted within a configured environment.
- Serve as OAuth directory for all the other enterprise applications in the organization for a single sign-on experience across internal and external users.
- Administer of the Management Suite itself. This includes security setup and access control for Management Suite Users and internal services. You can also get notifications and perform troubleshooting of Management Suite’s own operations using this feature.
- Create, manage, and monitor Environments for deployed Neuron ESB applications
Feature Overview
Task based User and Role Security
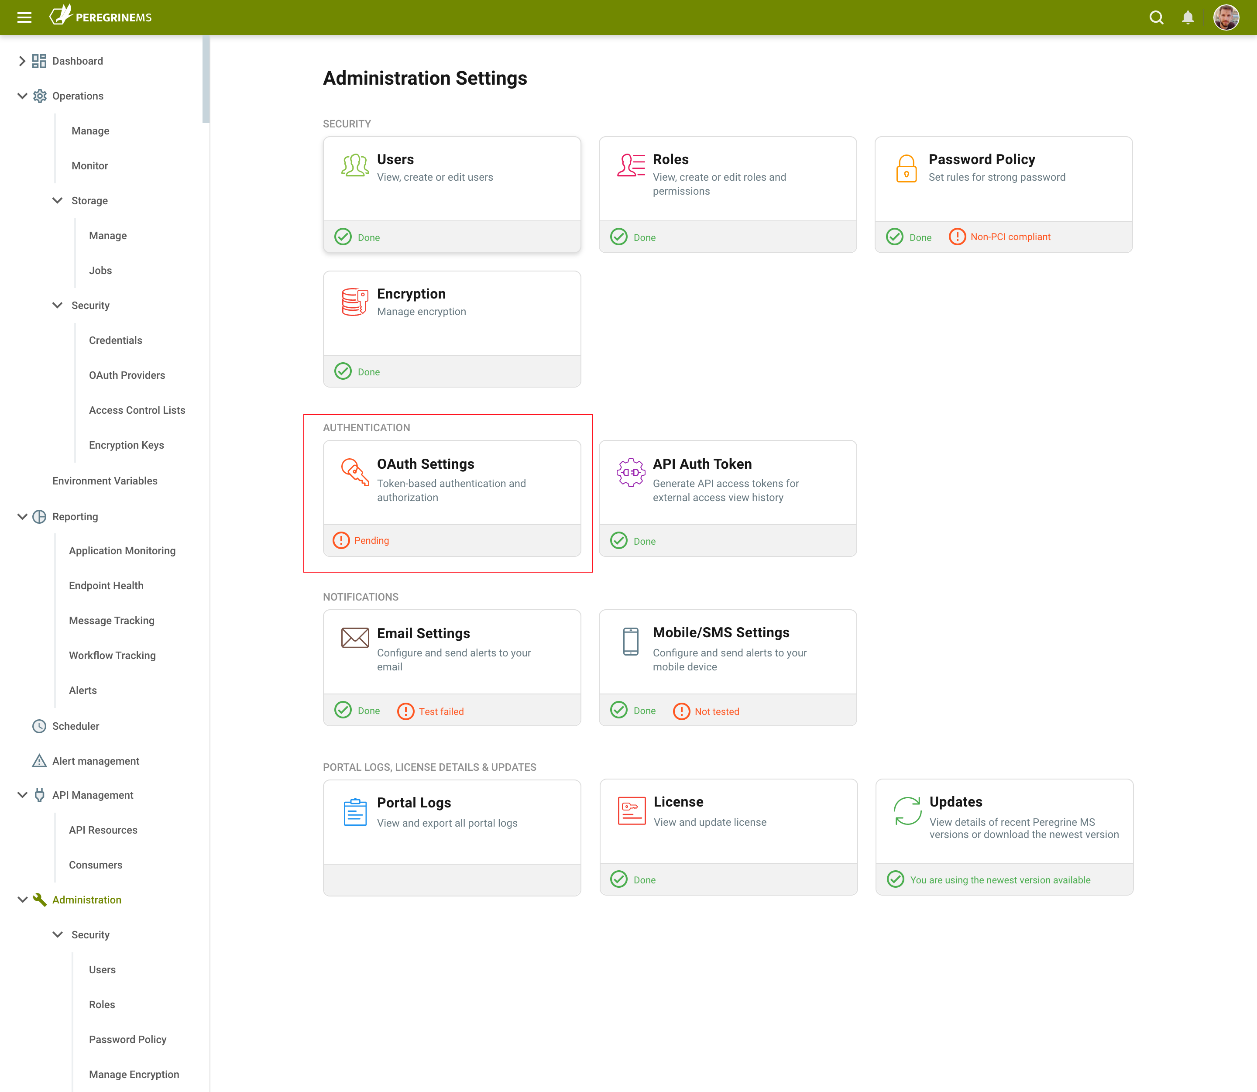
Peregrine Connect Management Suite provides one of the most secure, flexible, and extensible security models in the Integration Market. First and foremost, Peregrine Connect’s Management Suite was built to be secure out of the box. The Security scheme is focused on task-level security for users of the Management Suite as well as extending that same security model to the Design Studio. The Management Suite’s security model is based on OpenID and OAuth 2.0 and allows organizations to create Users and Roles based on their level of access to operations conducted through the portal. This allows Organizations to achieve fine-grained access control and security for operations and monitoring. Only authorized users can log in to the Management Suite Portal. Administrator-assigned user roles dictate the options that are available to them. Users, Roles, Password Policy as well as the general OAuth Authentication and Access Control providers that the Management Suite uses can be configured directly through the Administration settings as shown below.
Open ID and OAuth Providers
The Management Suite uses Identity Server 4.0 (default security provider) as its Open ID and OAuth provider to deliver Authentication and Authorization services for Management Suite tasks. This same service is used to provide Token-based authentication for Neuron ESB hosted service endpoints (i.e. Client Connectors) managed within the API Management module.
However, the Management Suite provides organizations the flexibility to use Microsoft Azure Active Directory as well as other compliant Open ID providers (e.g. Google, Thinkatecture, etc.) in addition to our own default provider, without sacrificing capabilities. Those extensions can be configured by selecting the OAuth Settings menu within the Management Suite.
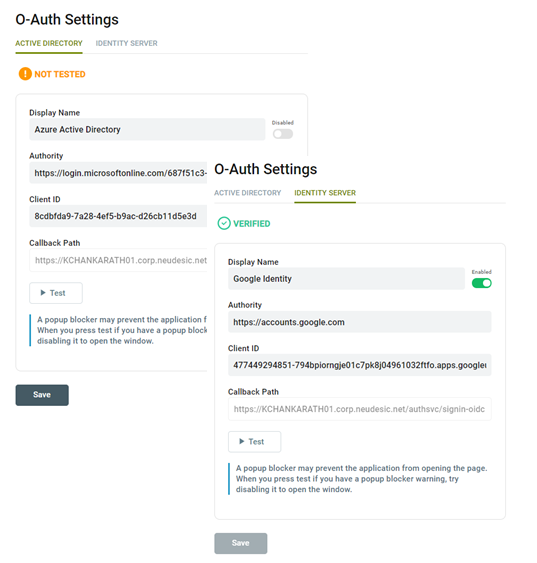
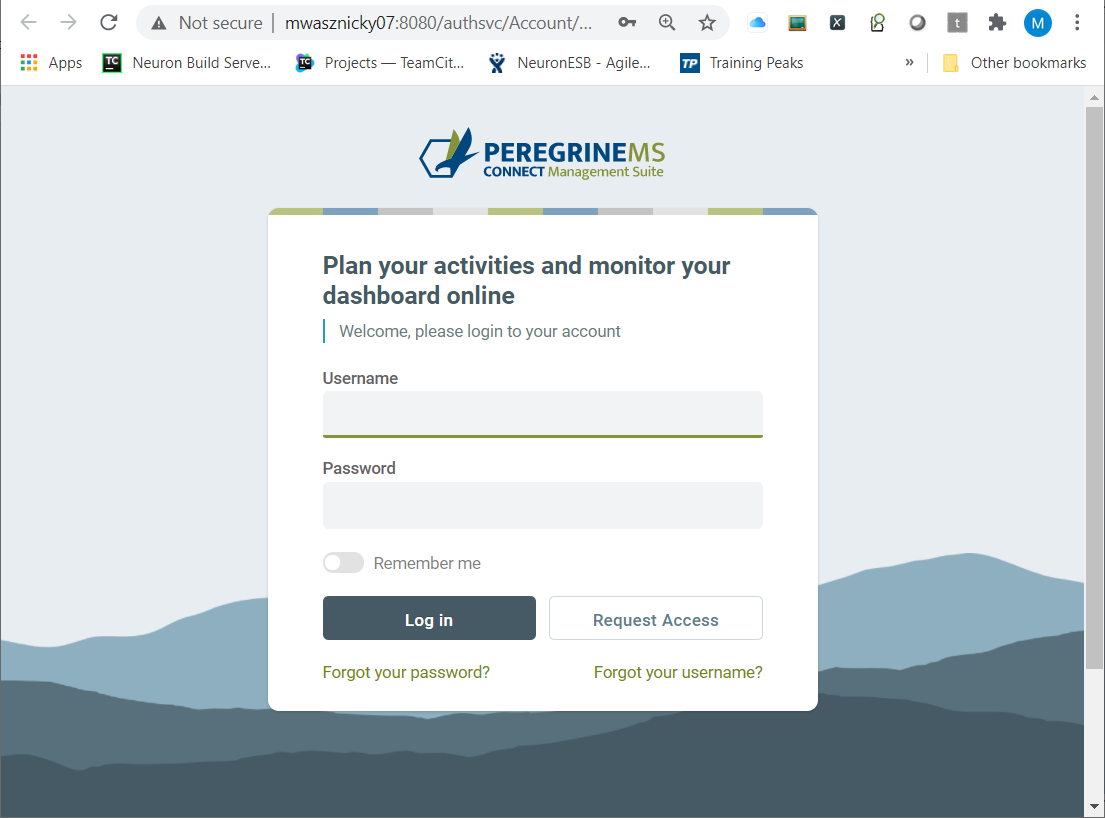
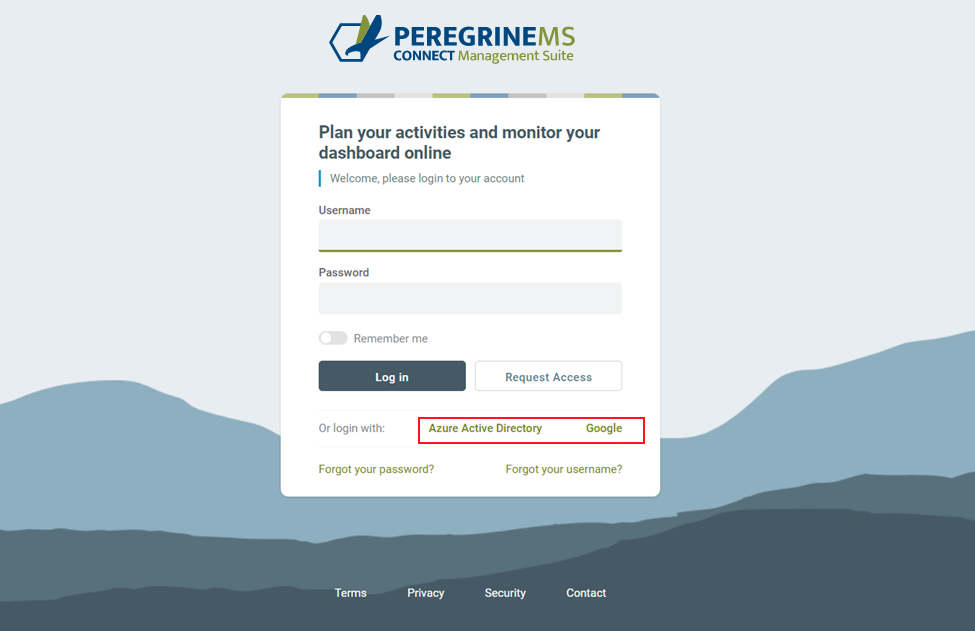
Once configured, users attempting to login to the Management Suite will be prompted with a modified Login screen displaying the new providers to select from.
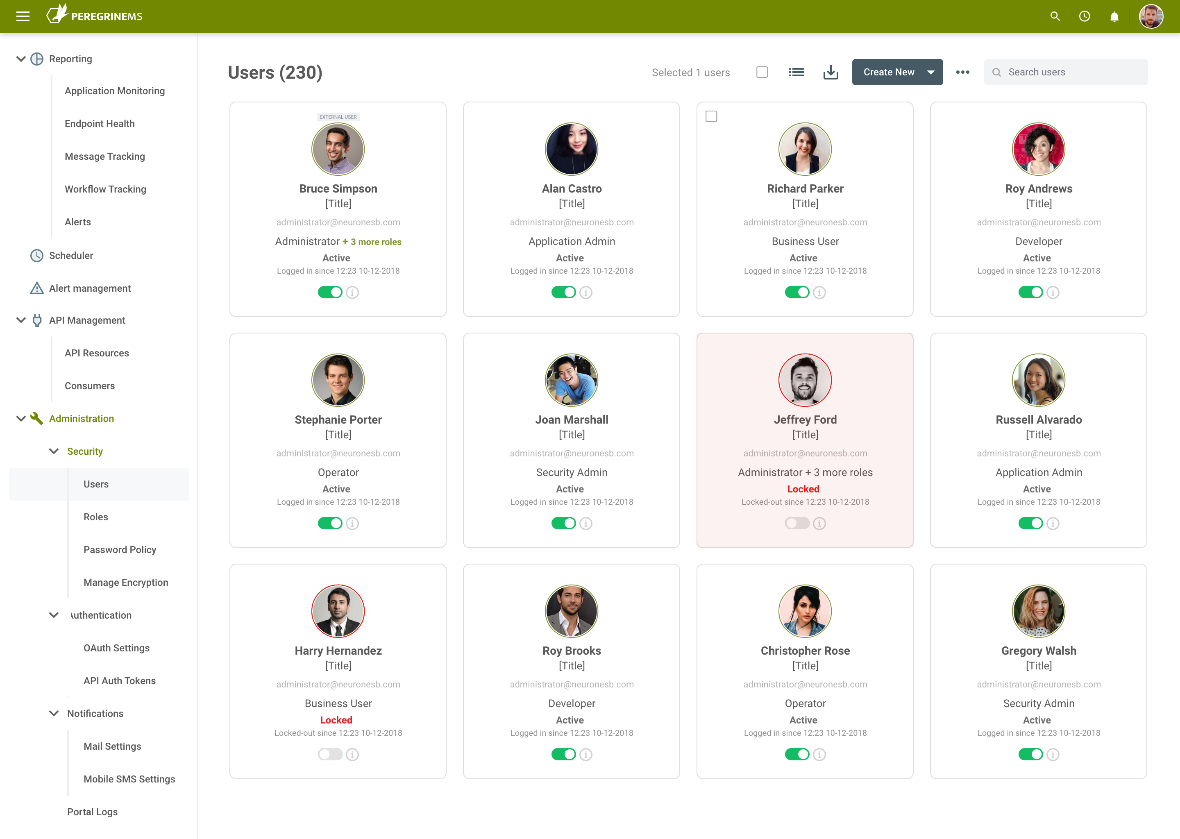
Users
Peregrine Connect has made the experience of adding and managing users seamless. Users can be created and managed by accessing the Users menu in the Administration section of the portal. Here, all aspects of a user can be managed. For example, users can be locked out, enabled, and disabled.
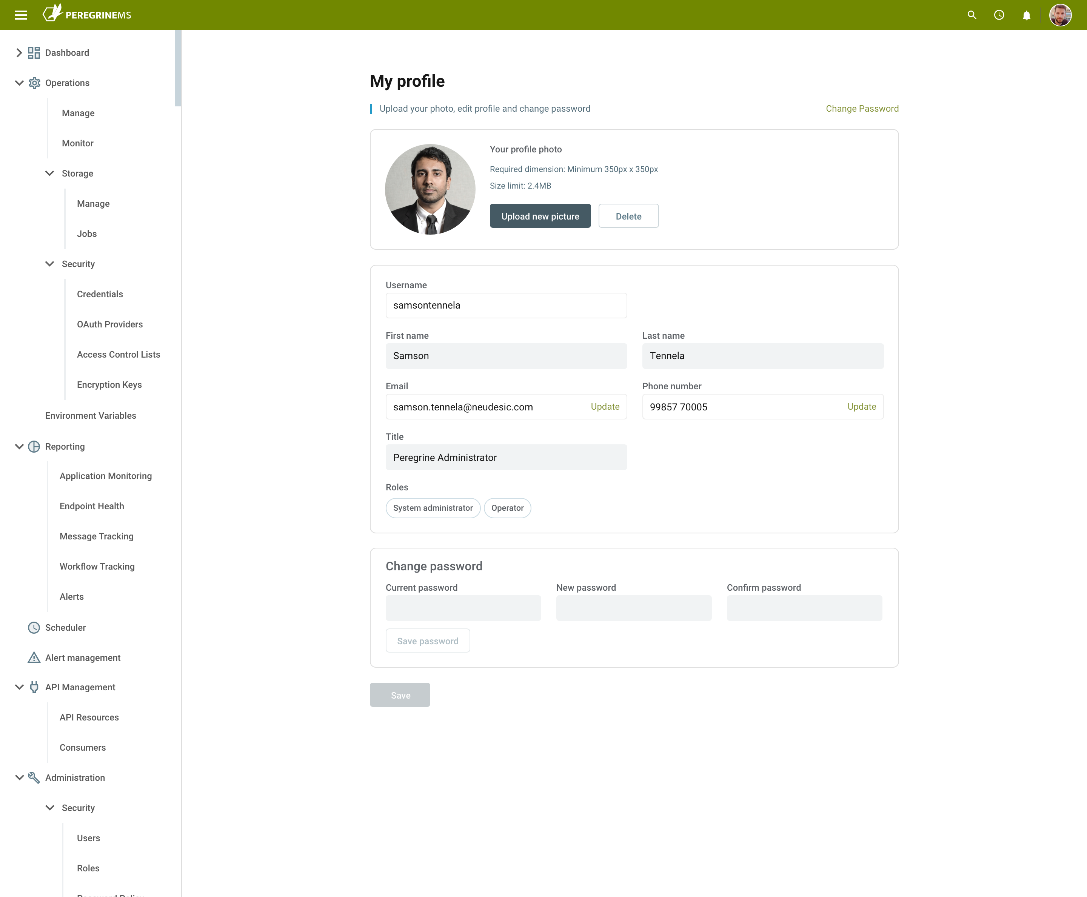
Once added, a user can edit and maintain their own profile within the system.
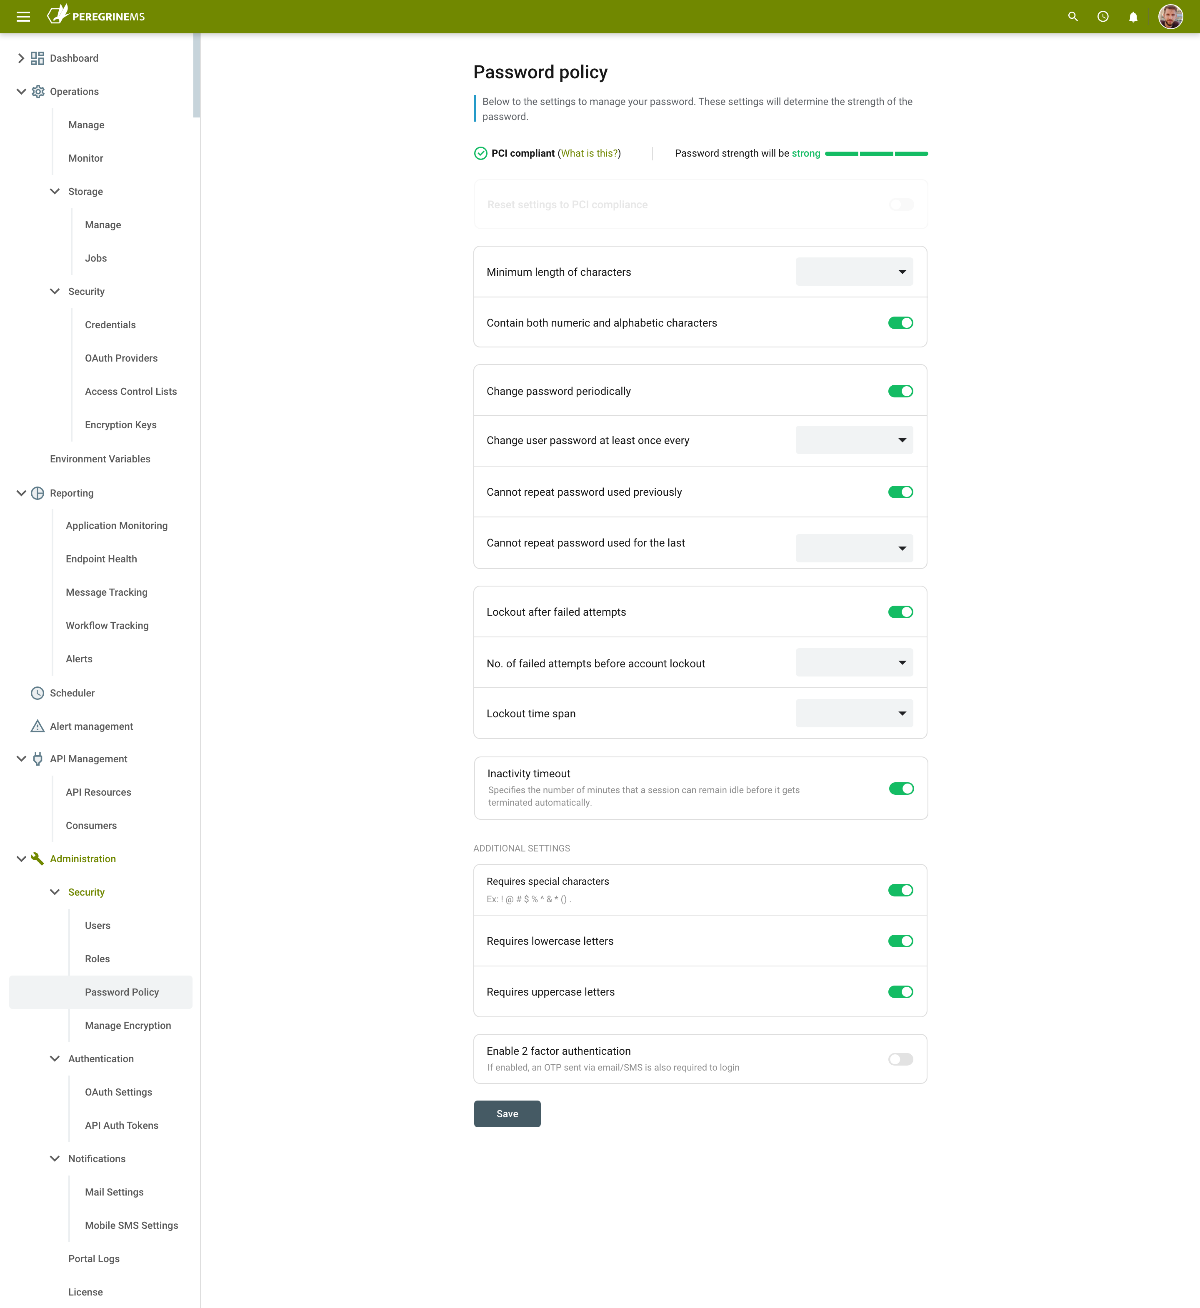
Password Policy
In addition to managing users, Administrators can also set a global Password Policy. The Peregrine Connect Password Policy is extremely comprehensive and governs everything from timeouts, to whether or not 2 factor authentication is required or, if passwords should be PCI compliant. Some of the options that Administrators can set are:
- Minimum length of characters
- Frequency of password changes
- If passwords can be reused
- Lockout policy and timeout
- Special character requirements
- Two – factor authentication
- Inactivity Timeout
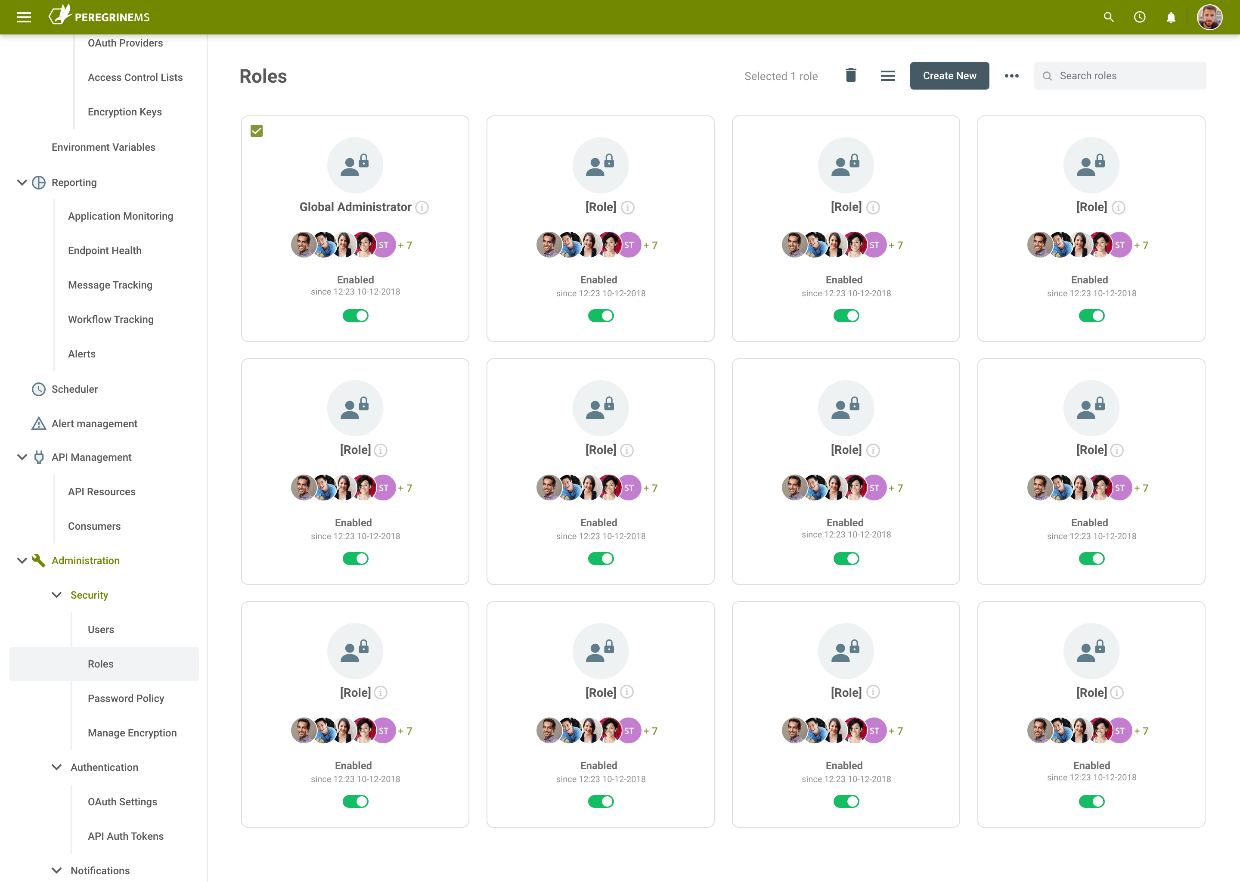
Roles
To begin setting up access control security, organizations would start with creating roles, granting permissions for the roles, and assigning roles to users. Installation of the Management Suite creates a default Administrator user and two roles, namely, Users and Global Administrators. The Administrator user can in turn create other users and roles. The number of Management Suite users that can be created is limited by the licensing agreement of Management Suite.
Administrators can assign permissions to Users and Roles allowing them to perform various tasks for each environment configured in the Neuron Management Suite. Permissions can be very granular and based on Functions and Operations per application in the Management Suite.
Although permissions can be directly applied to Users, its usually more manageable to create Roles for specific tasks, assign the necessary permissions to those Roles and then add the Users to the Role.
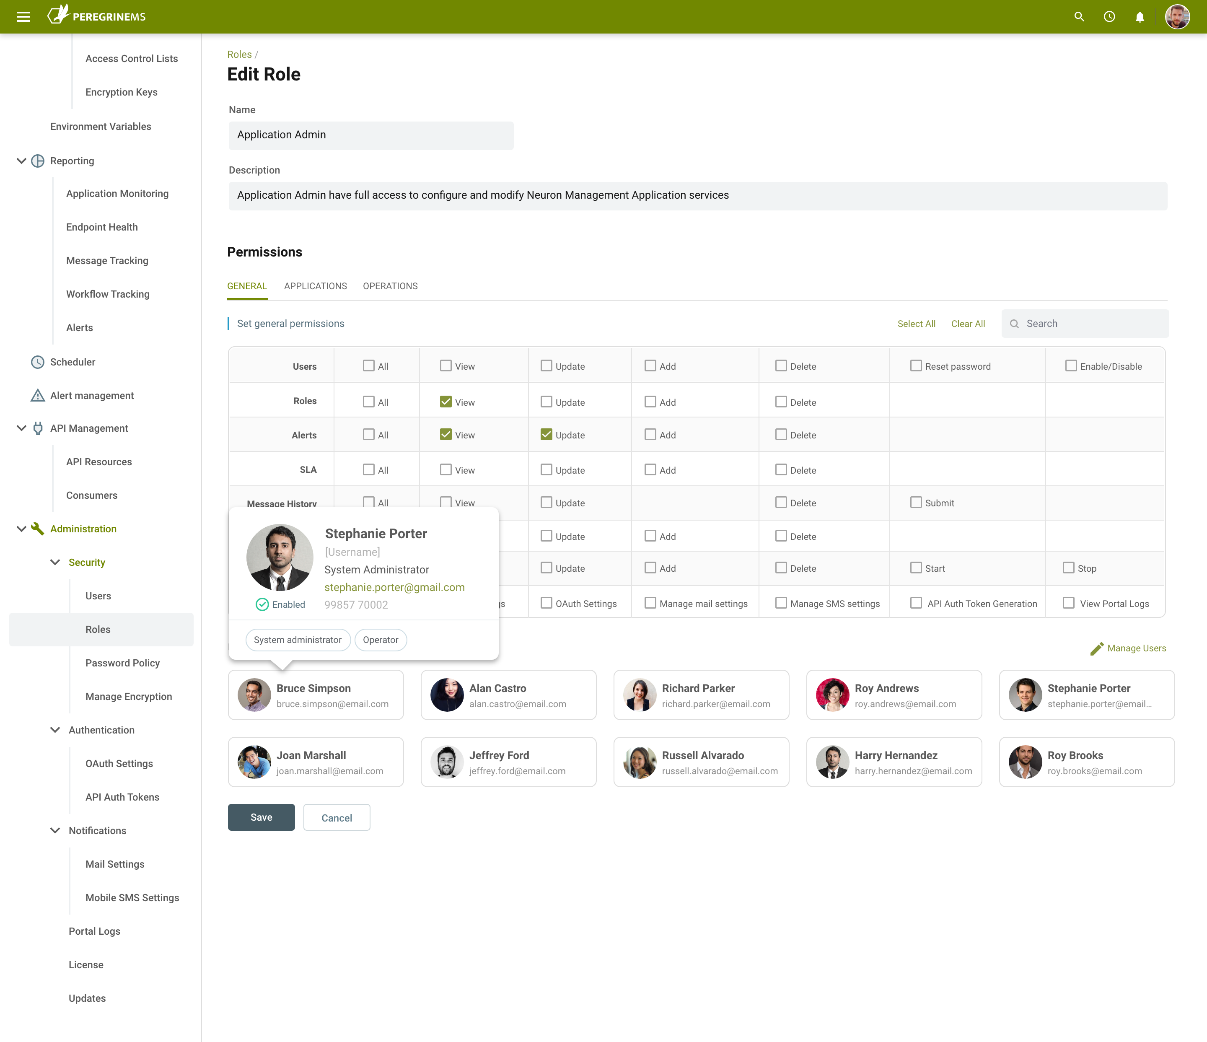
Permissions
There are 4 categories of permissions that can be assigned to Roles:
- General
- Applications
- Operations
- Directory Services
General level permissions provide task level restrictions to the entire Administration section of the Portal, as well as controlling the creation, viewing and modifications of Environments and Alerts.
Application level permissions are applied on the Neuron ESB solution, specifically, the endpoint level. Here, Administrators can control the level of visibility as well as the nature of interactions a user can have against any endpoint deployed in the solution. This also applies to the Audited/Tracked messages generated by the deployed solution as well as the Environment Variable values that it uses.
Operation level Permissions control the interactions users can have with the machine resources deployed to an Environment. For instance, whether or not Neuron ESB can be deployed or installed remotely can be controlled using these permissions. Operational level permissions also control who can edit, add, delete, stop, or stop all Machine resources like Elastic Search, Rabbit MQ, the EPS Service as well as Neuron ESB runtime machines.
When users are assigned to multiple roles, the user’s effective permission will be a union of all role permissions.
*You can create any number of users for use with the API Management module in the Directory Services Role. Those users can only use Peregrine Connect Management Suite OAuth service to authenticate against API resources, but cannot use the Management Suite.
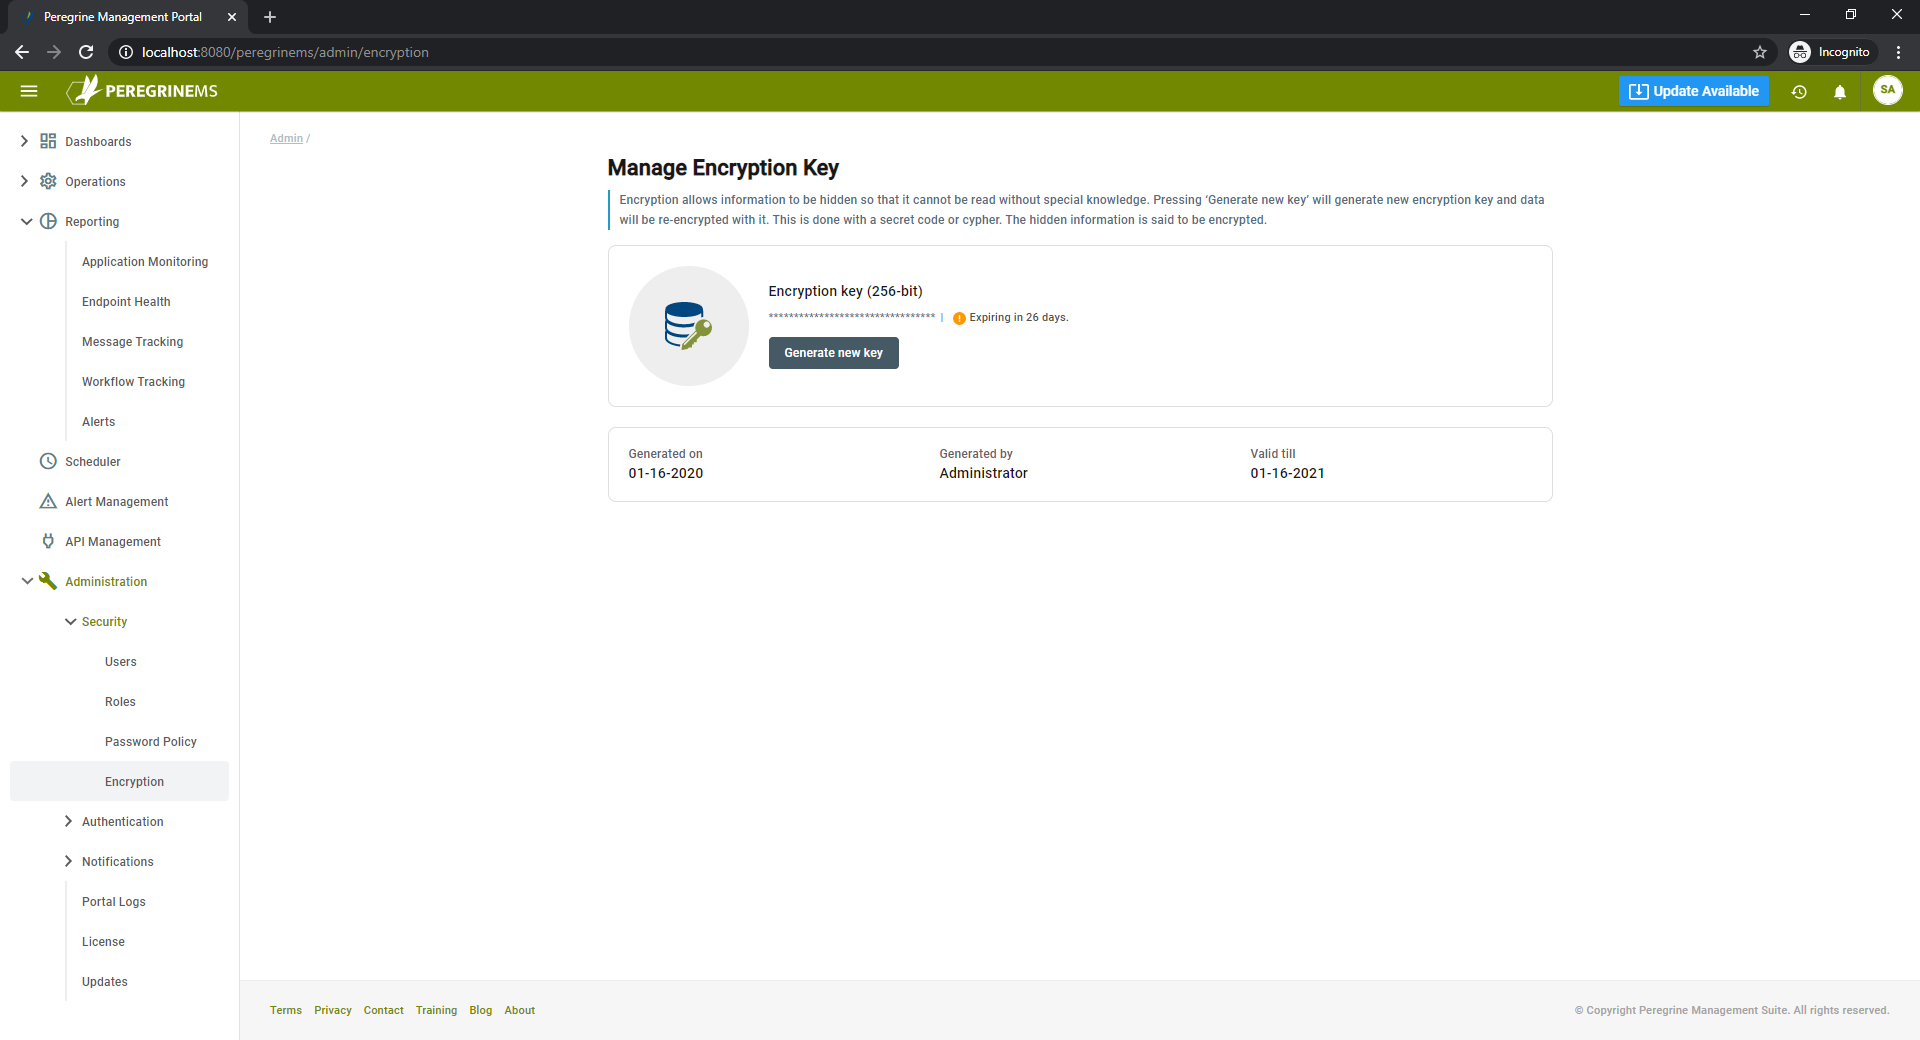
Encryption
When installing the Management Suite, the user will be prompted to generate an Encryption Key and save that out to an external medium. The Encryption key encrypts information such as user information and passwords stored in Peregrine Connect Hybrid Database. The installation creates a one-year encryption key by default. Organizations can generate a new encryption key using this its respective page within the Administrations section of the Management Suite.
Environment Management and Monitoring
The Peregrine Connect Management Suite provides the industry’s leading interface for the creation, management, and ultimately, the monitoring of Integration Environments. Most customers deploying enterprise integration solutions usually have two or more environments that the solution is deployed to. Historically, these environments are managed using a combination of 3rd party tools and log files that almost always lack the necessary context required to determine where and when an issue occurred. Because of this, root cause analysis can sometimes take hours, days, or weeks.
The persons responsible for the day to day operations of the Environment need a coherent and efficient tool set capable of proactively monitoring the machines within the environment as well as the resource usage of their runtimes and dependent infrastructure. The more effective the tool, the fewer outages and downtime organizations experience.
The Management Suite is designed for just that purpose in mind and provides monitoring views with two perspectives. The Environment view is for those interested in maintaining the general operation of the Environment and the health of the machines and runtimes deployed within it. The other is an Application level view of monitoring, targeting those more interested in health and activity of the applications deployed to the Environment.
What is an Environment?
Environments are usually defined by their resources (machines), applications/services deployed, level of exposure as well as the restrictions applied on general access. For example, while a solution is currently in the development phase, it may be regularly deployed to a Test or QA environment where all the use cases can be executed, and their results evaluated. Once the tests are successful, a decision may be made to “move” the application to a final Production environment. The Production environment would be the location where the integration solution processes live data for the organization.
In the example above, it’s not atypical where a medium to large size organization will want to run several instances of the Neuron ESB integration runtimes, each mapping to an “application”. The reasons for this are many, but include:
- Logical and functional separation
- Scalability and Performance
- Reliability and Availability
- Quality Assurance
- Application Development Lifecycle
Additionally, incoming requests may be load balanced to applications deployed across multiple servers within an environment.
The Diagram below illustrates an example architecture of a single distributed environment with high availability and performance.
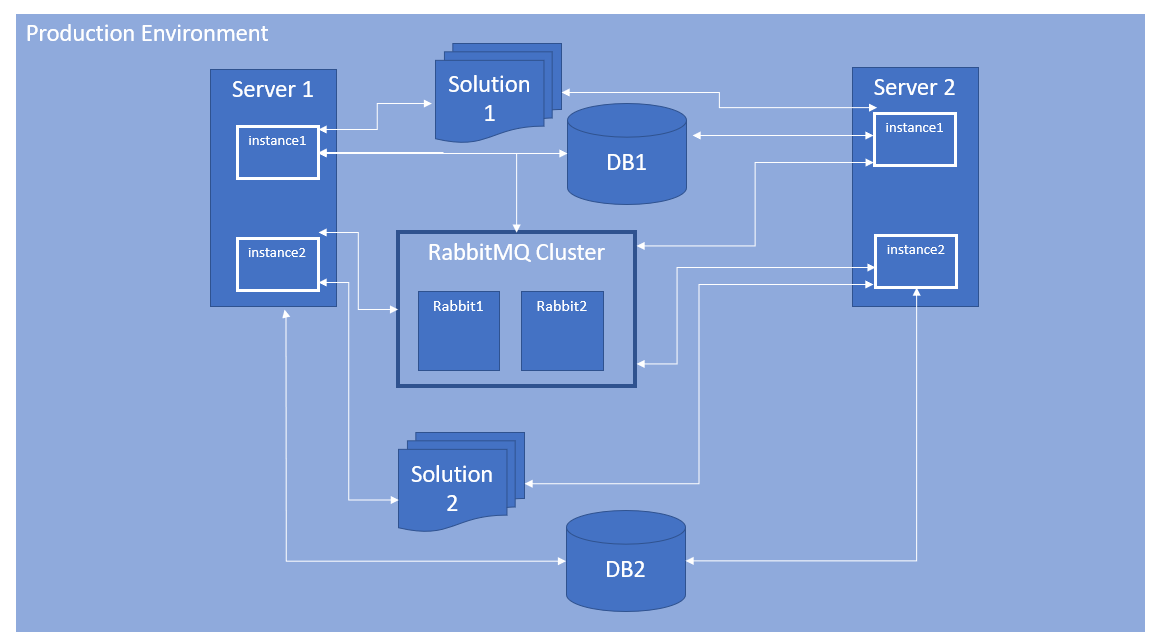
Controlling and monitoring multiple Neuron ESB servers, the services running on them and, their dependent resources can be a daunting task when there are multiple environments and solutions. However, multiple environments like the one depicted above are what the Peregrine Connect Management Suite was designed for!
The Peregrine Connect Management Suite can manage multiple environments and multiple instances of the Neuron ESB integration runtime from one central browser-based user interface (UI). Users for Peregrine Management Suite can control almost every aspect of each Neuron ESB instance. For example, users can remotely install Neuron ESB as well as apply patches to existing Neuron ESB installations from the browser-based UI. In contrast, navigating to the Operations Monitor home page, organizations can get a summary view of the health of all the Environments, each displayed in a Card view which can be expanded to show detailed metrics for individual Environments.
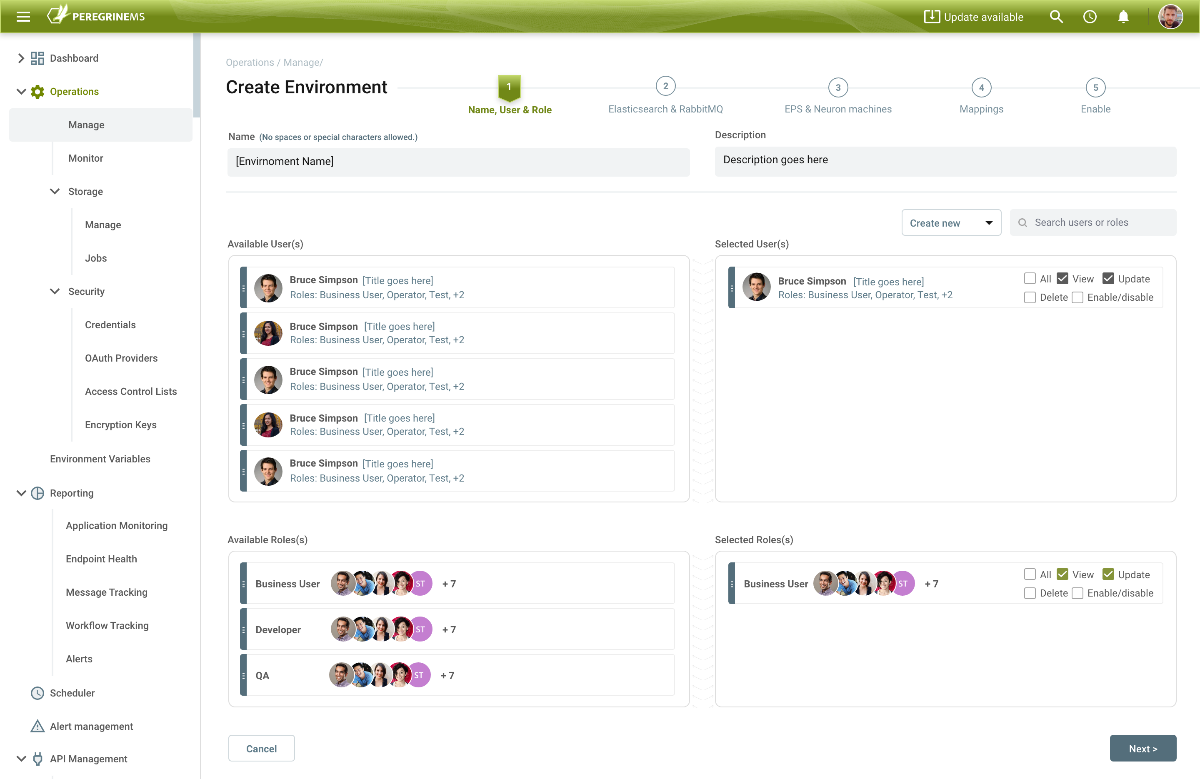
Managing Environments
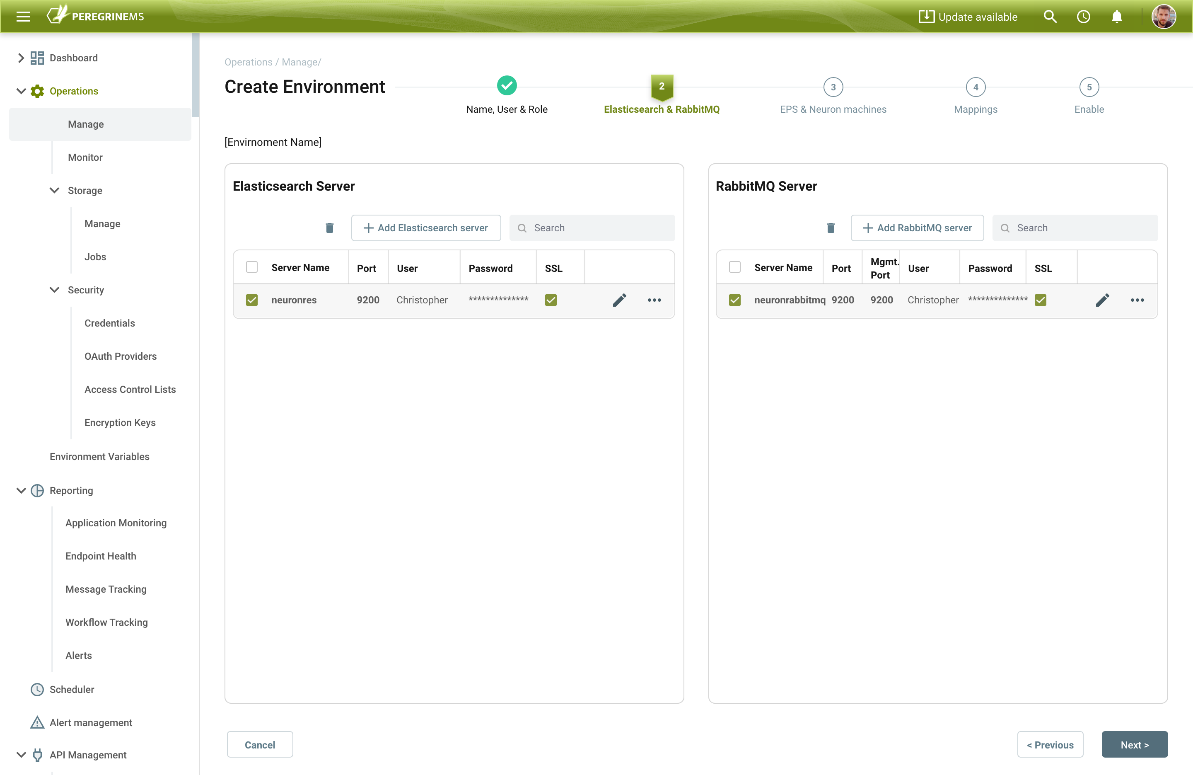
Creating an Environment to manage is as simple as walking through a wizard. First selecting the Users and Roles that should have access to it. Users and Roles can be given specific permissions such as View, Delete, Enable, Disable or Update.
The Elastic Search and Rabbit MQ servers are then be added as they are required for the Peregrine Connect Event Processing Service. The Event Processing Service is an extremely high-performance, distributed system. It is designed to capture and store events and tracked messages within Neuron ESB solutions and runtimes, preprocessing. It stores them into Elastic Search, the storage medium for the Management Suite.
Following this, the machines running the Event Processing Service and Neuron ESB Service runtimes must be added and associated with each other. The Event Processing Service can be installed using the Neuron ESB 3.7.5 installer. Usually, this is installed on the same machine that Neuron ESB is installed on. However, in environments that expect to generate extremely high loads or requests, the Event Processing Service can be installed on one or more dedicated machines within an Environment. Each Event Processing Service is eventually “paired” with a deployed Neuron ESB runtime.
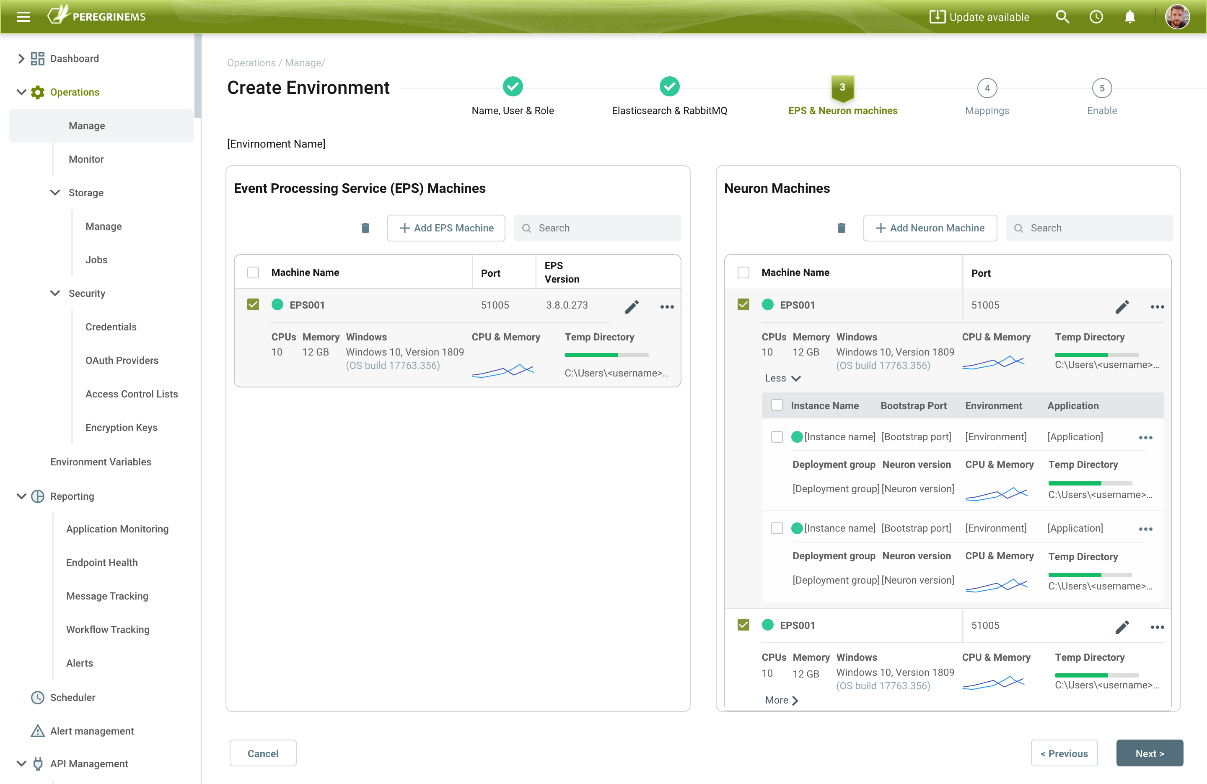
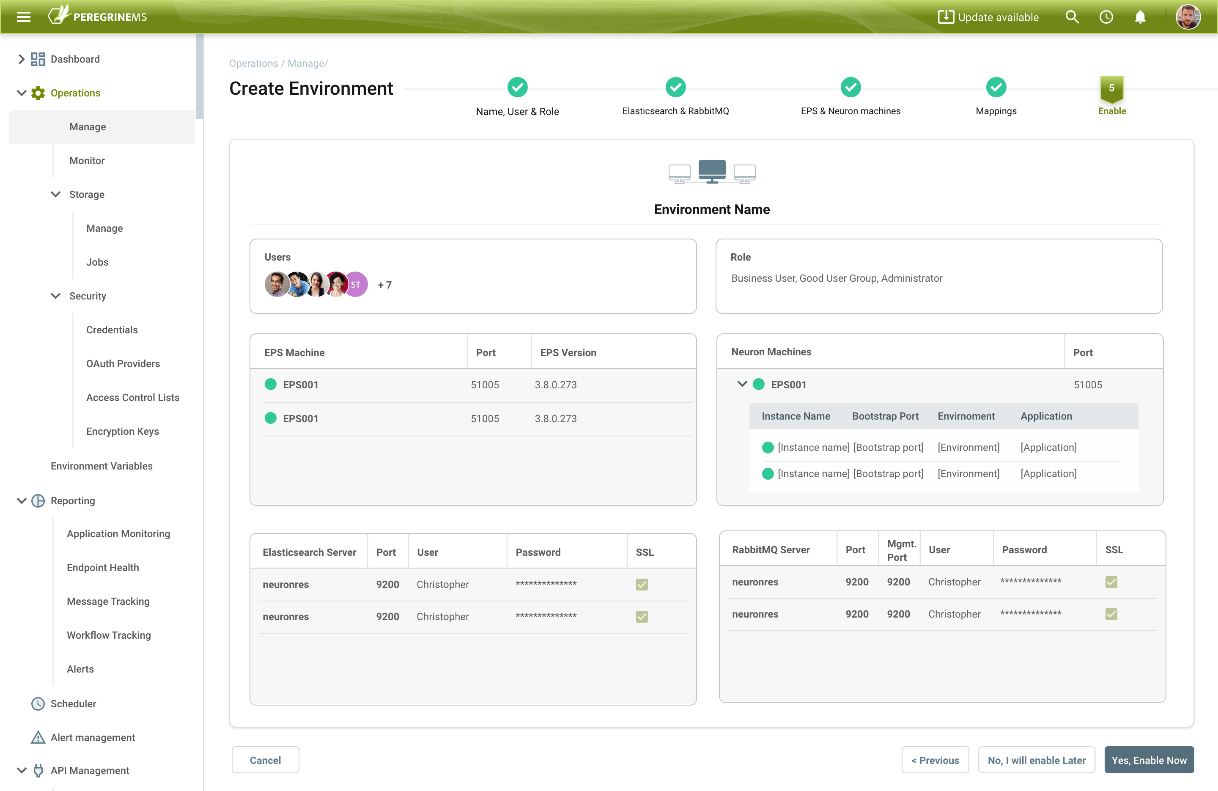
Once the Neuron ESB and Event Processing Service machines are added, the Environment can be enabled. It triggers the Event Processing Service to collect and store all tracked messages, log entries, health statistics, service rates, and machine metrics for the Management Suite. This information is used everywhere within the portal to provide Monitoring, Alerting, API Management, Job Scheduling as well as numerous other features to organizations.
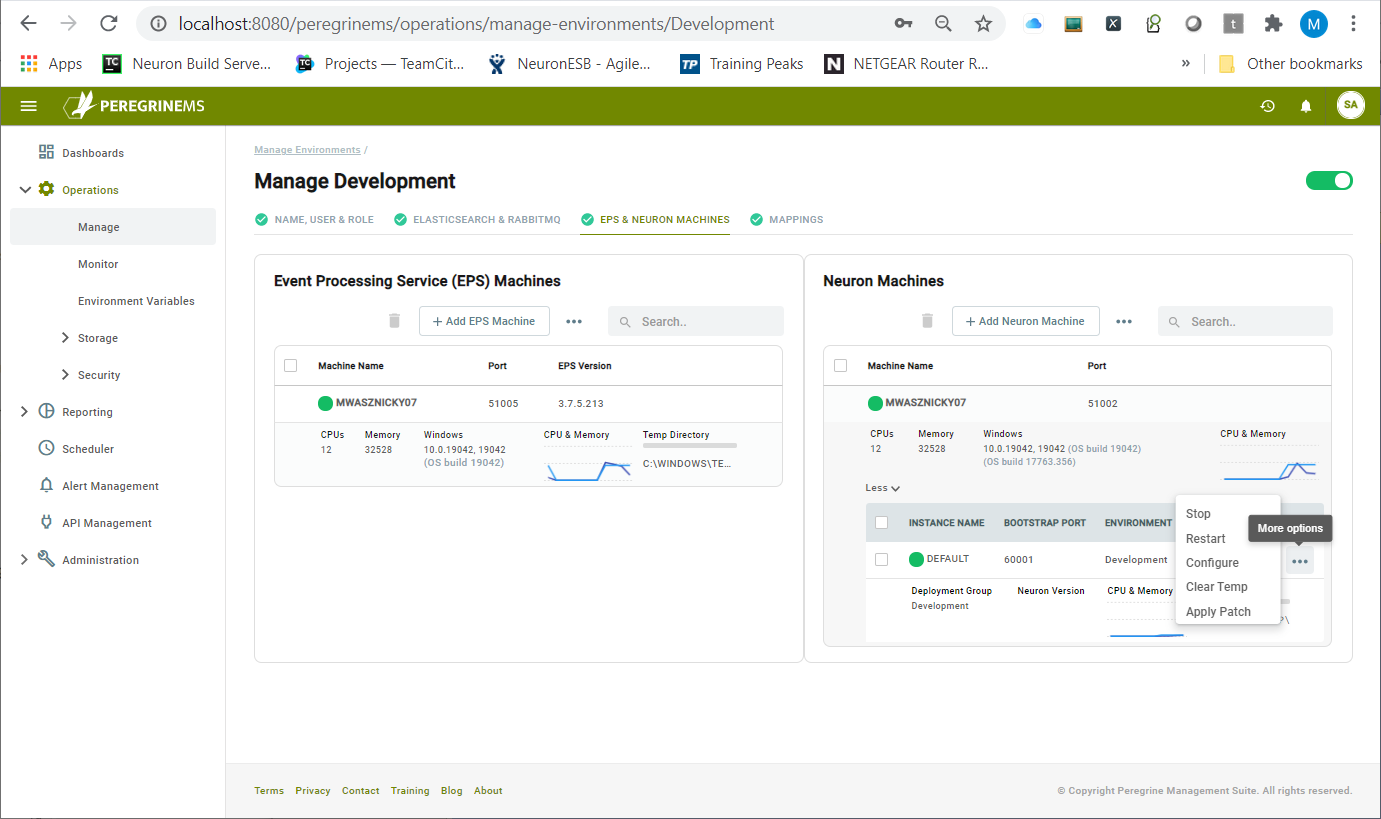
Under the Operations Manage menu, users can get a bird’s eye view of the machine resource activity for the Event Processing Service and Neuron ESB runtime. Users can execute a variety of actions from the browser, such as stop, start, install, patch, configure, and clear out temp directories.
Monitoring Environments
The Peregrine Connect Management Suite was built to provide the best real-time, historical, context-based monitoring solution within the Integration industry. The organization simply can’t succeed with integration projects if they cannot be effectively monitored to avoid outages and unanticipated downtime. Being able to efficiently expedite root cause analysis when an issue occurs reduces downtime. Outages and downtime for businesses mean lost revenue, pure and simple.
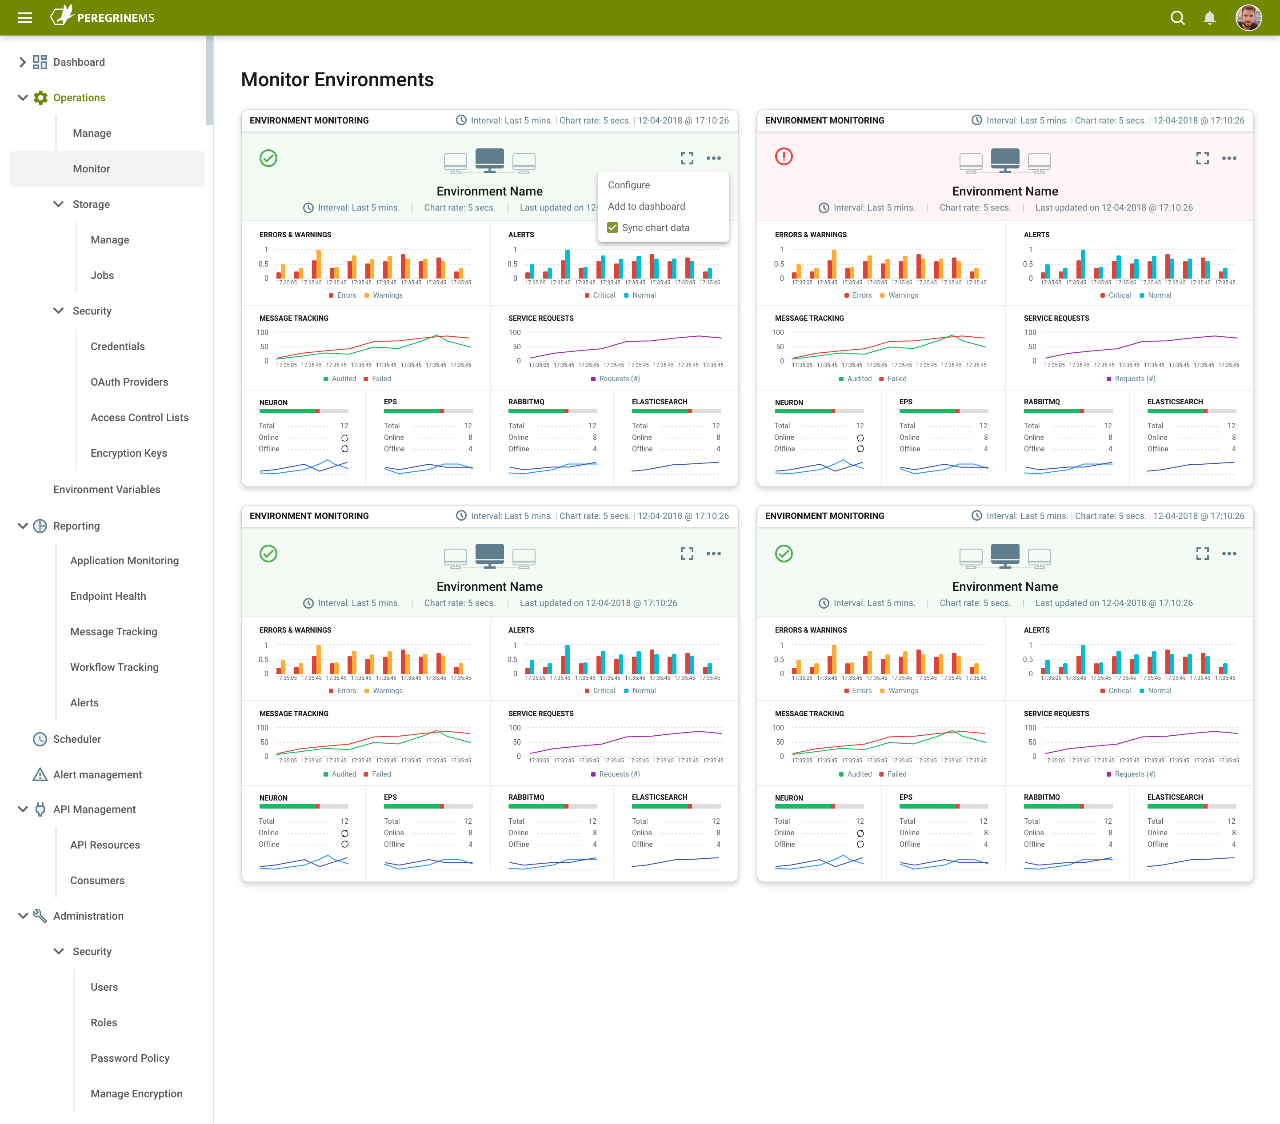
Summary View
By navigating to the Monitor page of the Operations menu, organizations can quickly gain a bird’s eye view of the operational health of all the environments. Each Environment is represented by a summary “Card”. These Cards display a graphical timeline of the following metrics.
- Errors and Warnings
- Alerts
- Messages and Failed Messages generated
- Service Request rates
- CPU and Memory of the following:
- Neuron ESB Servers
- Event Processing Service
- Elastic Search Servers
- Online/Offline Status of all Servers
By default, the graph timeline extends back to 5 minutes with 30-second sampling, but this is entirely configurable by the user. Users can go back 2 weeks or enter a custom date, while the sampling rate can be configured from anywhere between 5 seconds to 1 minute. The Card can be maximized to show a full-page view, providing even more detail, heat maps, and drill-down capabilities.
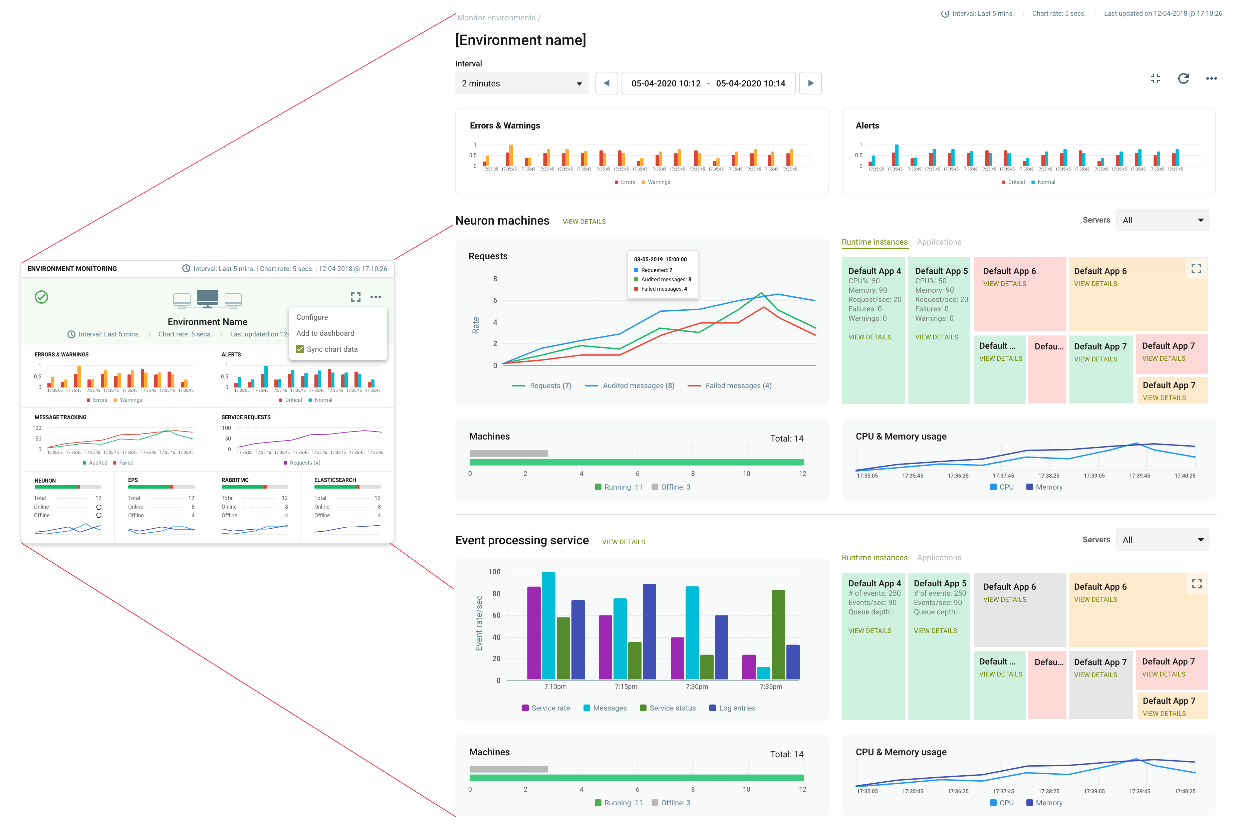
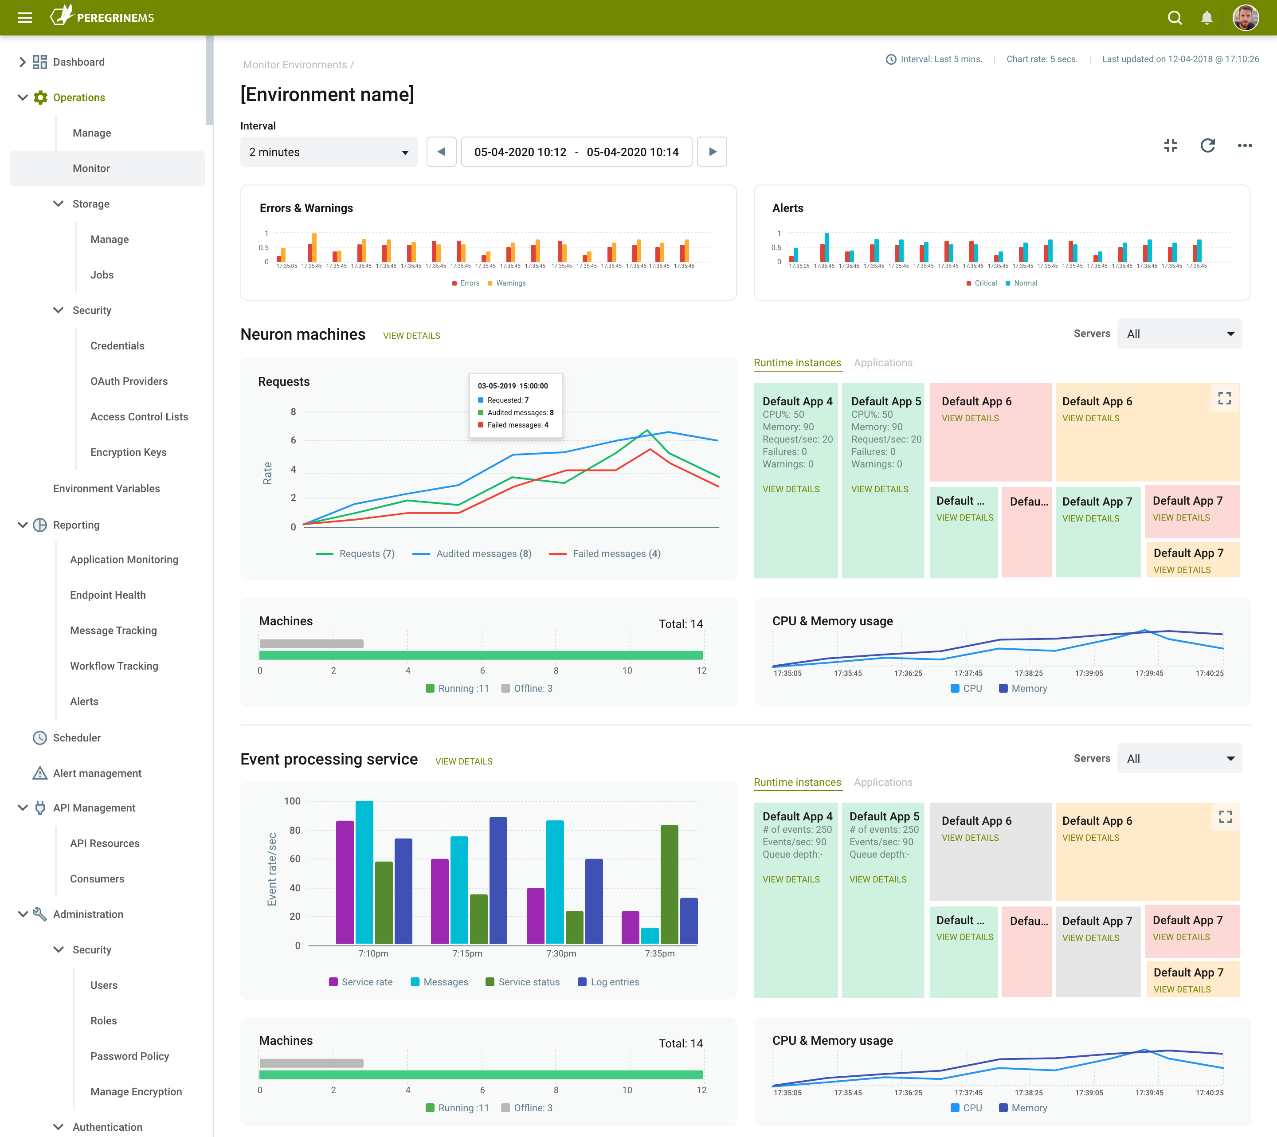
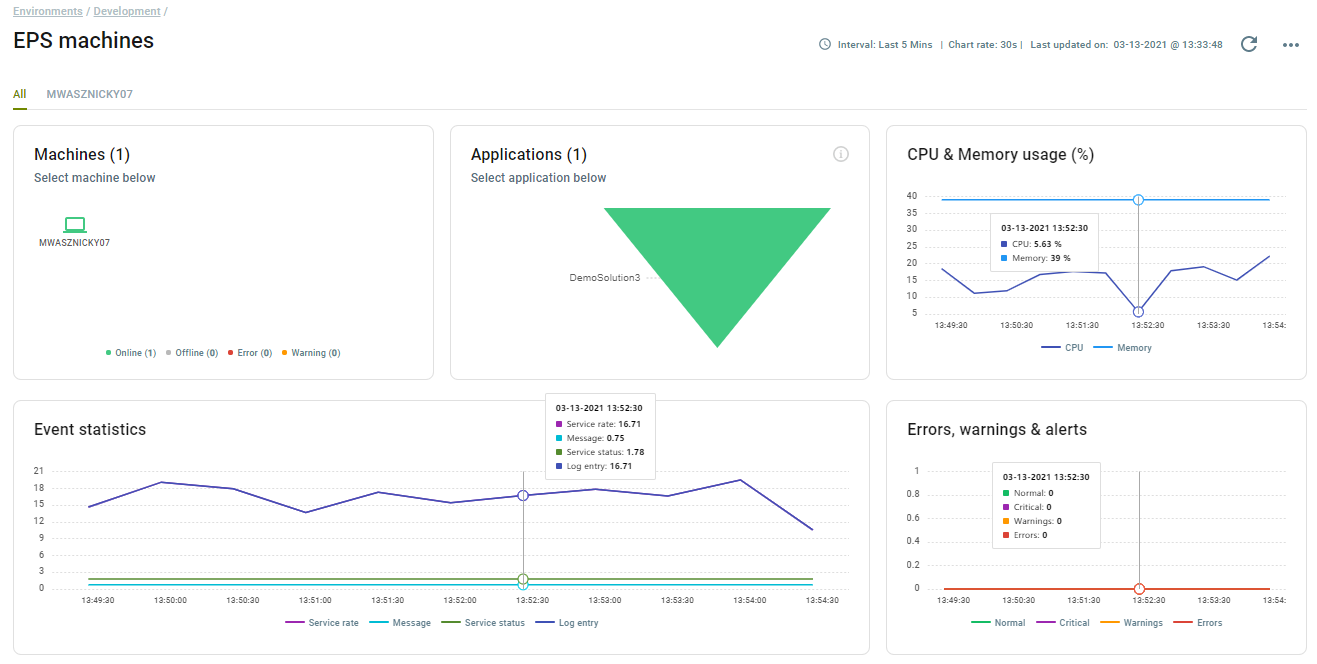
The full-page view of the Operation’s Monitor home page offers a detailed picture of an organization’s environment. Besides the Errors, Warnings, and Alerts located in the header, the page is split into two sections. One for Neuron ESB runtime-specific metrics and the other, for the heart of the system, the Event Processing Service.
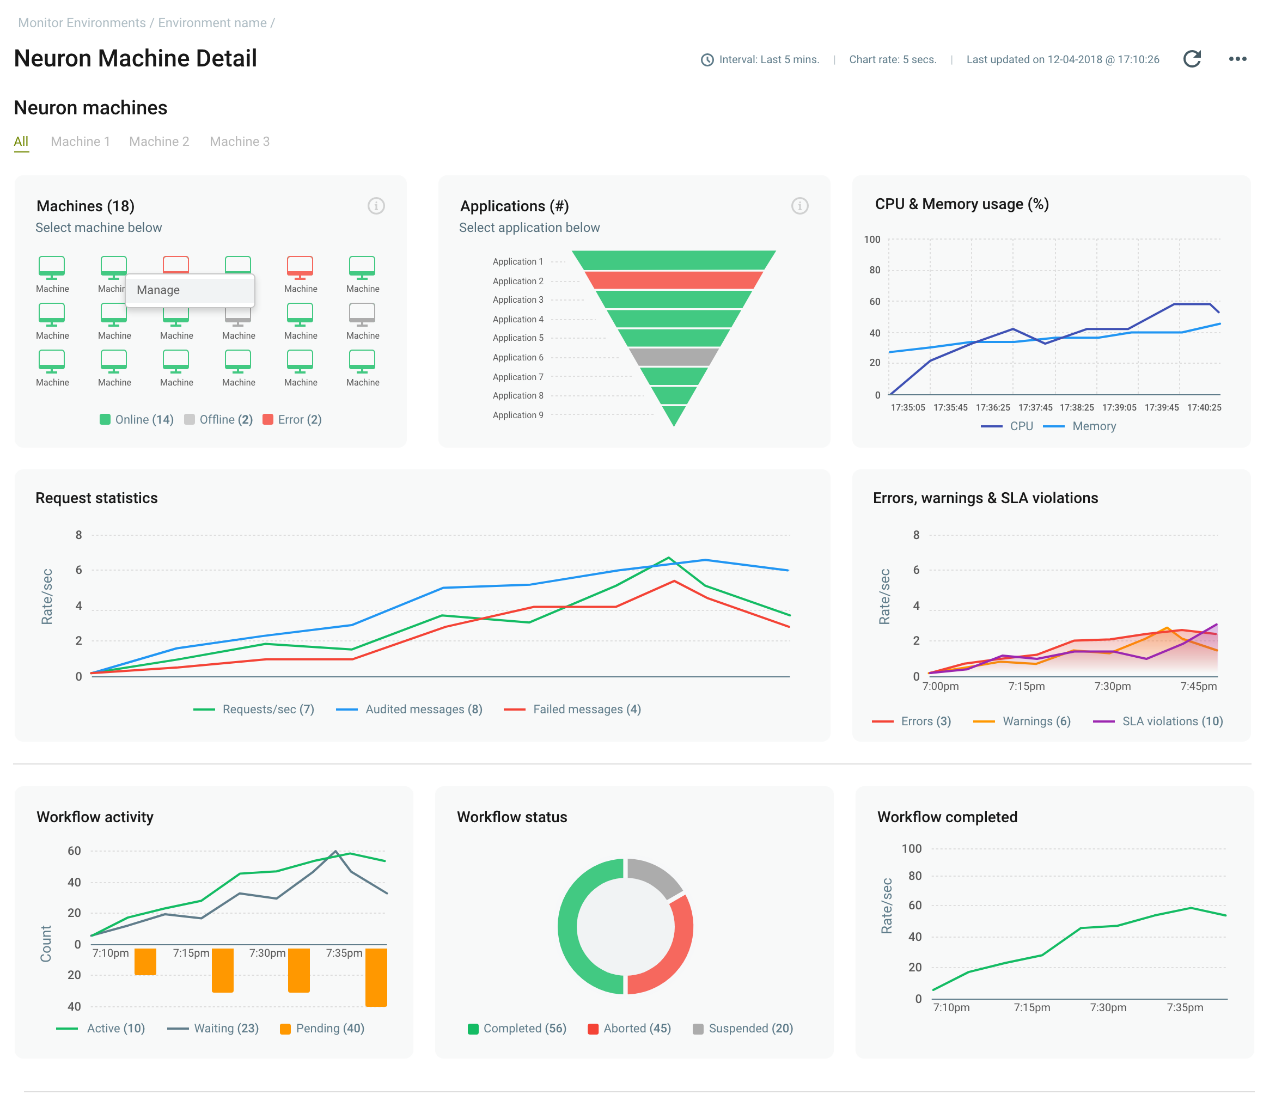
Neuron Machines
Organizations can use the Neuron Machine details page to view all the statistics, messages, logs, endpoints as well as workflow metrics generated by all Neuron ESB runtimes deployed within the Environment. This information is published, aggregated, and stored by the Event Processing System and rendered within these pages of the Management Suite Portal so that organizations can quickly ascertain the health of the system and drill down to the root cause of events with just a few clicks. Users can filter based on a particular machine or even an Application. Each chart on the Neuron Machine details page allows users to drill down into more detailed metrics and charts
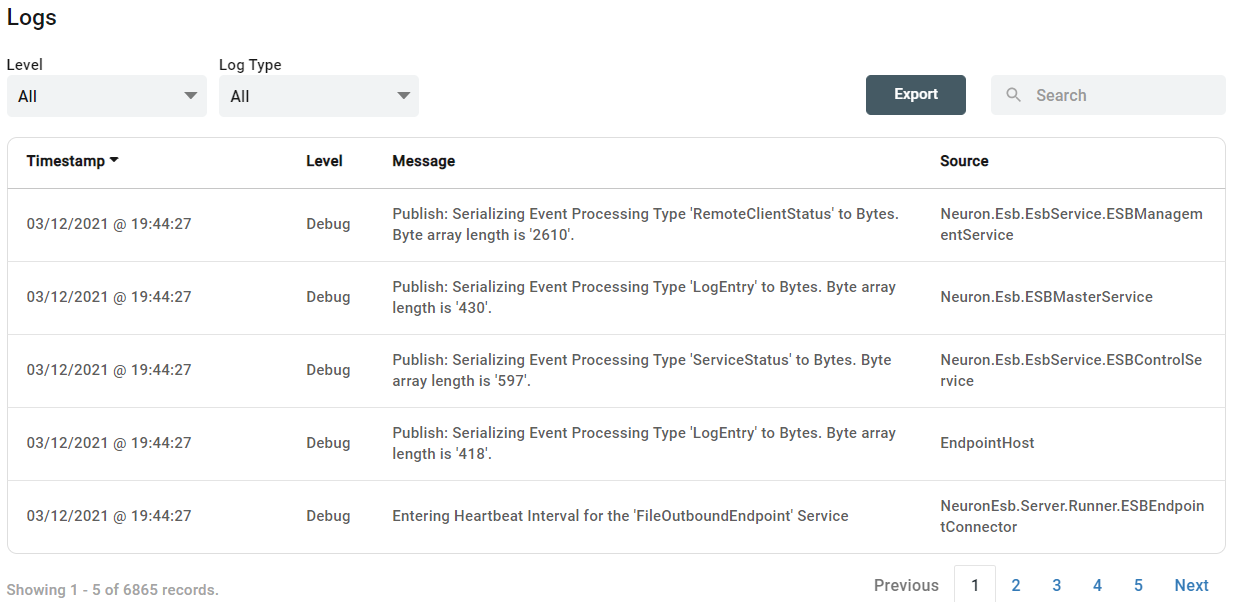
On the same page, users can also view, search, and export the log files generated by the runtimes for the time span they are viewing.
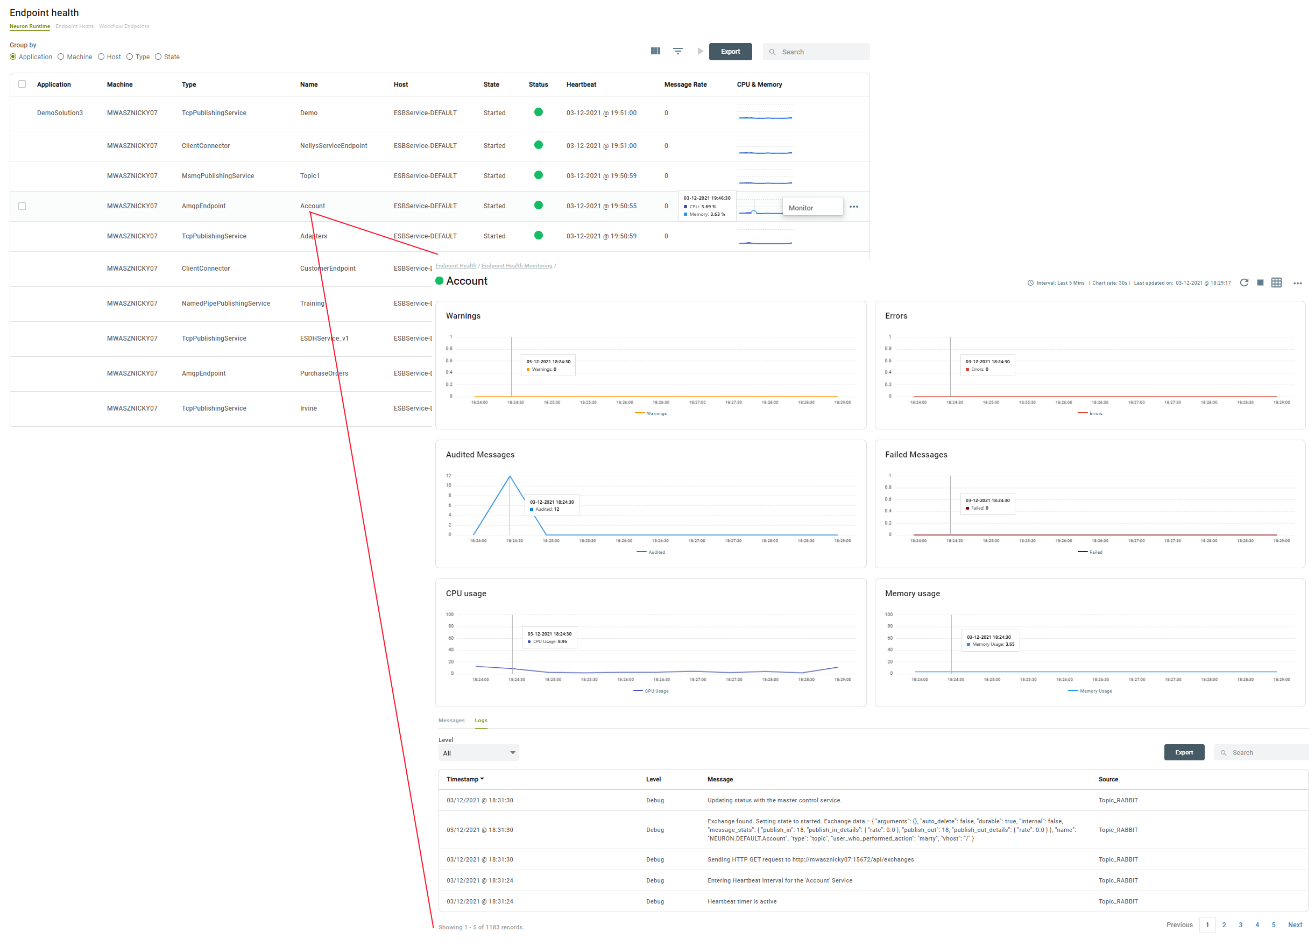
Lastly, within the Endpoint Health section of the Neuron Machine details page, organizations can monitor and control all the individual Endpoints running within an application. Furthermore, they can drill down into an individual endpoint to get a granular view of its metrics as well as its specific log entries and any messages generated by the endpoint
Event Processing Service
Peregrine Connect Management Suite is based on Elastic Search and Identity Server which provides ease of aggregating and searching logs, messages and statistics generated from across all Neuron ESB runtime environments. It allows secure access to the web-based portal and provides OAuth and Open Id authorization and access control (API Management) for Neuron ESB hosted service endpoints (i.e. Client Connectors). For this to happen, it must be able receive and store real time events from the Neuron ESB runtimes deployed in an environment while, at the same time, not disrupt the performance of the applications deployed.
To provide comprehensive monitoring of applications, the Management Suite and Neuron ESB both rely on the Event Processing Service, the beating heart of an Environment. The Event Processing Service is an extremely high performance, distributed system designed to capture events and tracked messages within Neuron ESB solutions and runtimes. At a high level, the Event Processing Service works by receiving events from Neuron ESB Runtimes via Rabbit MQ, preprocessing them, and storing them into Elastic Search. Hence, monitoring the infrastructure required for the Event Processing System is critical to maintaining visibility into the applications deployed to an Environment.
By navigating to the Event Processing Service details page, organizations can immediately the health, activity, and utilization of the Event Processing Services deployed in an Environment, including the log entries generated.
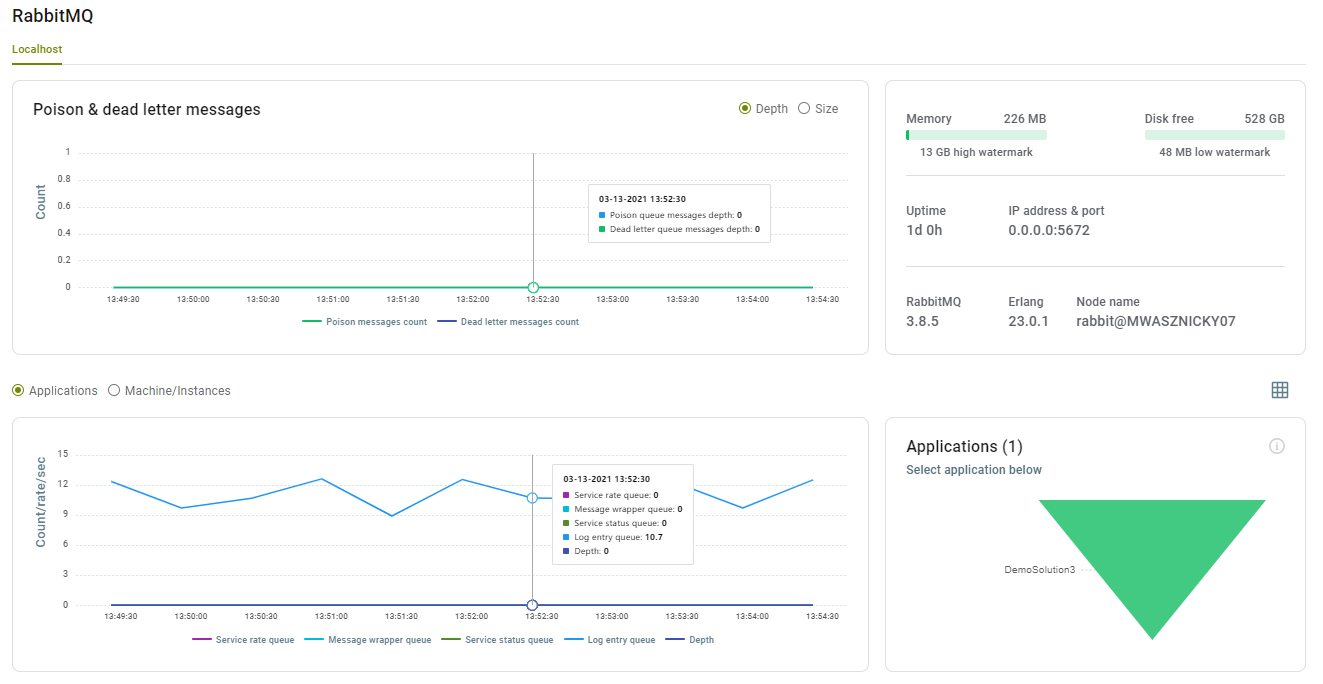
Rabbit MQ
The Event Processing Service uses Rabbit MQ as a transient storage mechanism between the Neuron ESB runtimes and the Elastic Search storage that the Management Suite is configured to use. As an essential part of the core infrastructure of an Environment, the Management Suite provides organizations with real time insight into the health of the Rabbit MQ Servers.
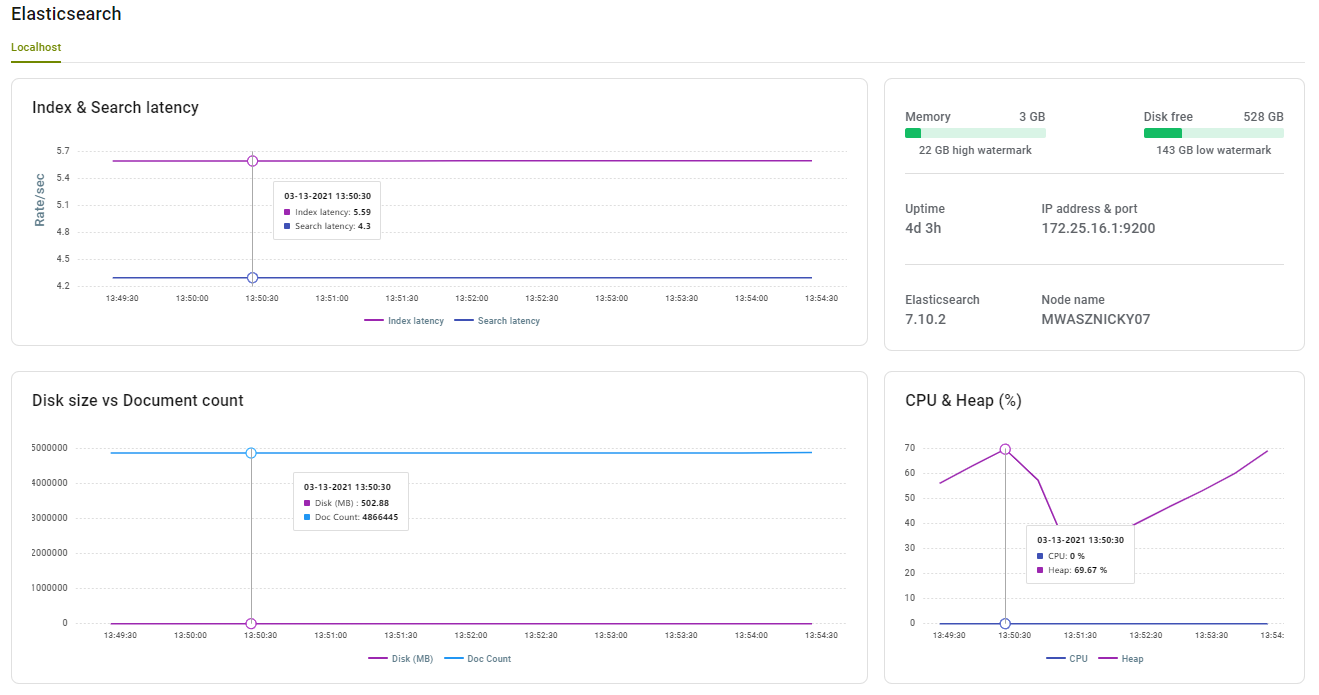
Elastic Search
Just as important as Rabbit MQ is Elastic Search, the final storage medium for the Management Suite. Using the Event Processing Service details page, organizations can monitor the health and performance of the Elastic Search Servers deployed in the Environment.
Application Monitoring and Reporting
In contrast to the Operational view of monitoring, the Peregrine Connect Management Suite provides an alternative view of monitoring and reporting to those in the organization more interested in the health and performance of the applications deployed to an Environment. Although both Operational and Application views may share and monitor some of the same metrics, the Application view is targeted to the Applications and their respective connectors, services, and workflows, whereas the Operational view is more concerned about the runtimes and computer resources employed to run the Applications.
Users can access all the reporting and monitoring for an Application by navigating to the Reporting menu. Under the Reporting are four modules:
- Application Monitoring
- Endpoint Health
- Message Tracking
- Alerts
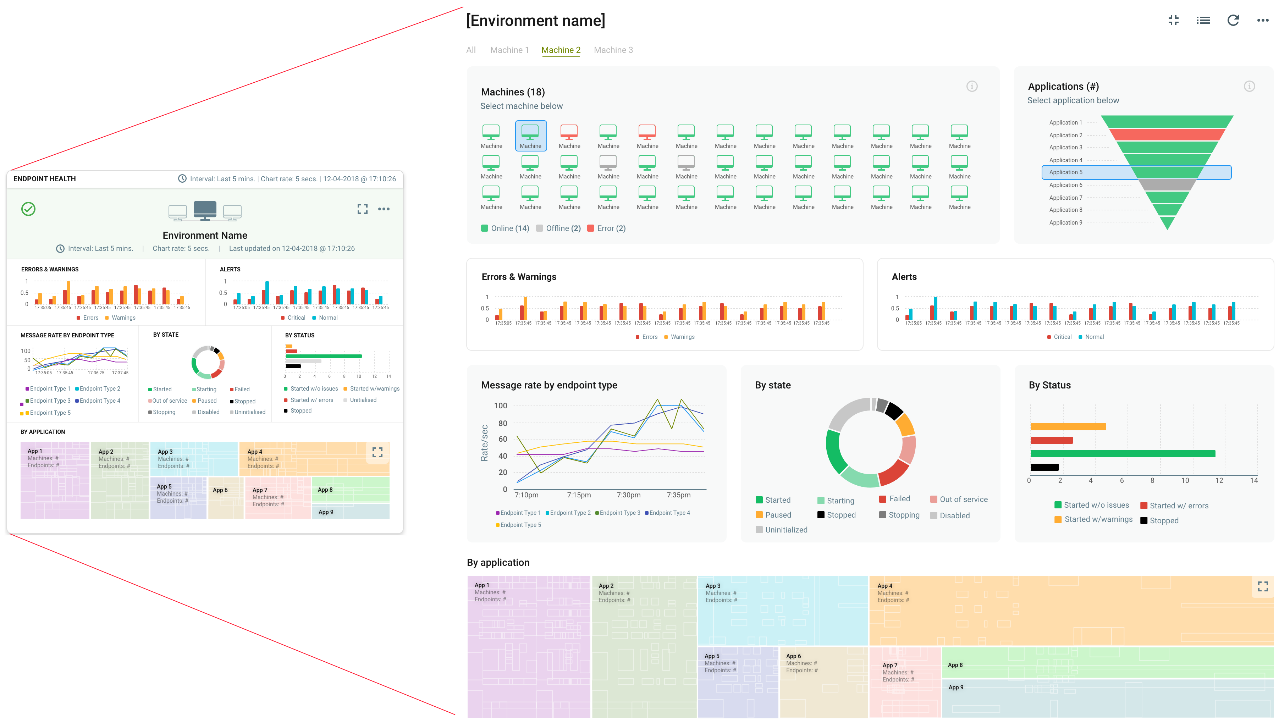
These modules offer a similar experience to that of the Monitor page of the Operations menu. Organizations are presented with a bird’s eye summary Card view at the Environment level. Basically, a roll-up view of the Applications deployed. Each Environment is represented by a summary “Card”. Although each module is slightly different, the Cards display a graphical timeline of some of the following metrics.
- Errors and Warnings
- Alerts
- Service Request by Application
- Audited and Failed Messages
- Failure Types
- Failure Types by Source
- Failures by Business Processes
- Service Requests by Endpoint
- Workflows by Execution State
- Endpoints Status
- Endpoint State
- Distribution Heat Map
- Broken up by Neuron ESB Entities
- Drill down into specific Endpoints
- Visualization of the Application structure
- Online/Offline Status of all Applications
By default, the graph timeline extends back to 5 minutes with 30-second sampling, but this is entirely configurable by the user. Users can go back 2 weeks or enter a custom date, while the sampling rate can be configured from anywhere between 5 seconds to 1 minute. Any Card can be maximized to show a full-page view, providing even more detail, heat maps, and drill-down capabilities.
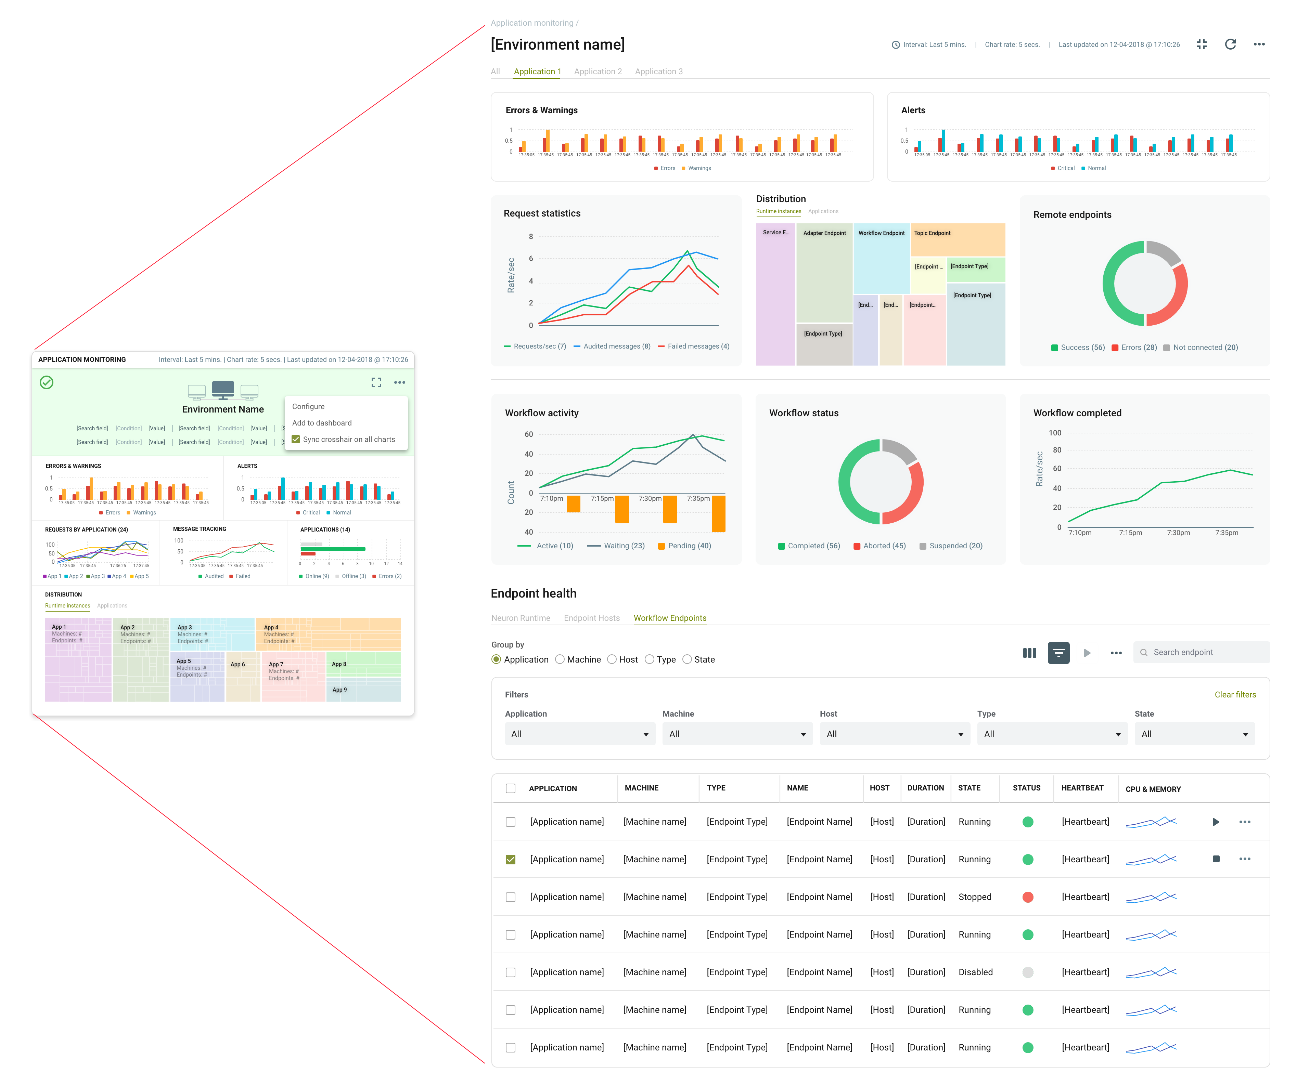
The full-page view of the Application Monitoring home page offers a detailed picture of all the Applications deployed to an organization’s environment.
Application Monitoring
The full-page view of the Application Monitoring page allows organizations to see a detailed rollup of all the Applications deployed in the Environment. Alternatively, each Application deployed in the Environment is represented by a dedicated tab at the top of the page. By clicking on the Application name, a very similar page will be displayed however, it will show only the charts and metrics generated by the selected Application.
The home page is composed of several charts, each allowing you access to more detail by either double-clicking on the data point or right-clicking on the actual chart. The home page also provides a view of all the Endpoints, such as Services, Adapters, and Workflows as well as the actual log entries.
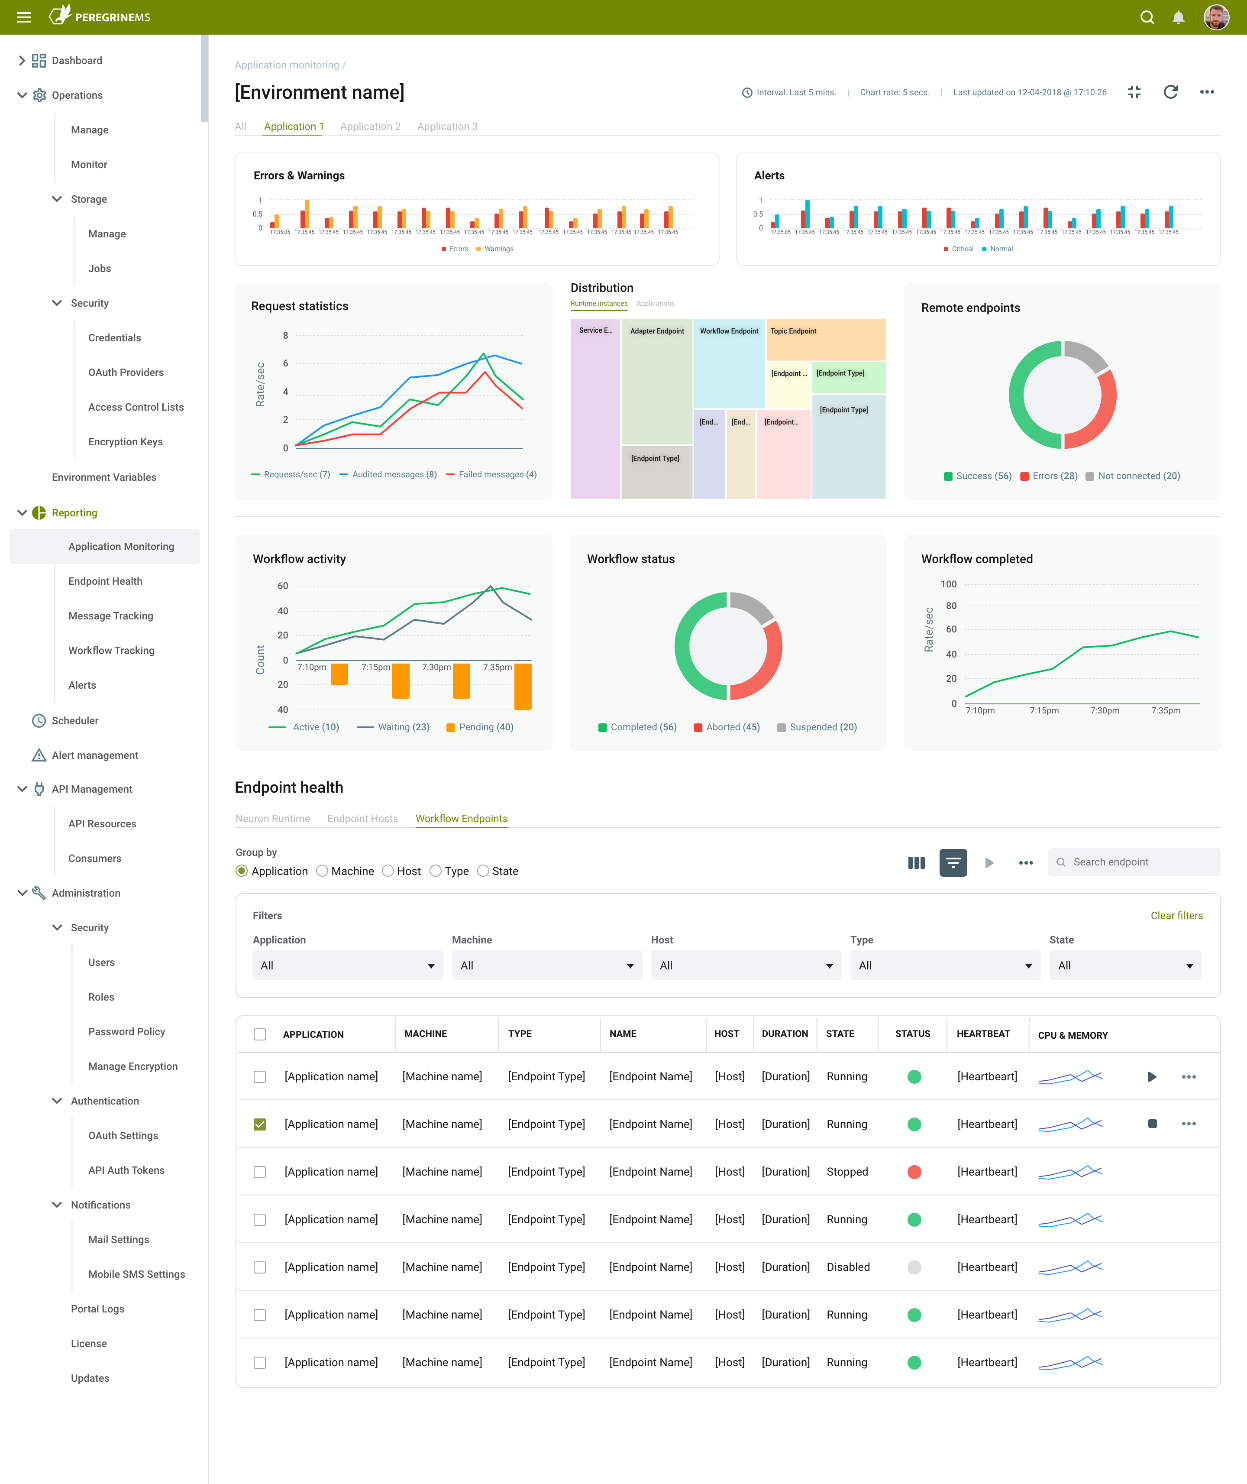
Errors and Warnings
This chart displays errors and warnings generated by the Application(s) via log entries. This represents all errors and warnings generated by the Application(s). Users can double click on a data point to access the specific log entries for that time index.
Alerts
This displays all the Alerts that have been generated by the Application(s). Alerts are separated out as critical and non-critical. Alerts can be created within Peregrine Connect Management Suite by navigating to the Alert Management home page. Users can either navigate to the specific Alerts by double-clicking on the data point within the chart or, navigate to the Alerts Reporting home page by right-clicking and selecting “View Alerts”.
Request Statistics
Organizations can quickly see the rate of requests; messages being tracked as well as failed messages generated by the Application(s). Message Tracking, Endpoint Health, and Endpoint Detail for the selected time index by right-clicking on the chart and accessing its context menu.
Distribution
The heat map provides a bird’s eye view into the composition of the Application(s) deployed in the Environment. For instance, each entity type such as Topic, Adapter Endpoint, Client Connector, Service Connector, and Workflow Endpoint is represented by a square. Each square’s size is relative to the number of entities running of that type. The color of the square (i.e. Green, RED, Yellow) is determined by the health of the entities. For example, if there was an adapter that generated an error, the entire square would be red. However, the user could drill down one more level, presenting a new heat map of just Adapter Endpoints, where each Adapter Endpoint is a square. There the user would see that the square representing the specific Adapter Endpoint generating the error would be RED. Clicking on it would navigate them to the Endpoint Monitoring home page for just that endpoint.
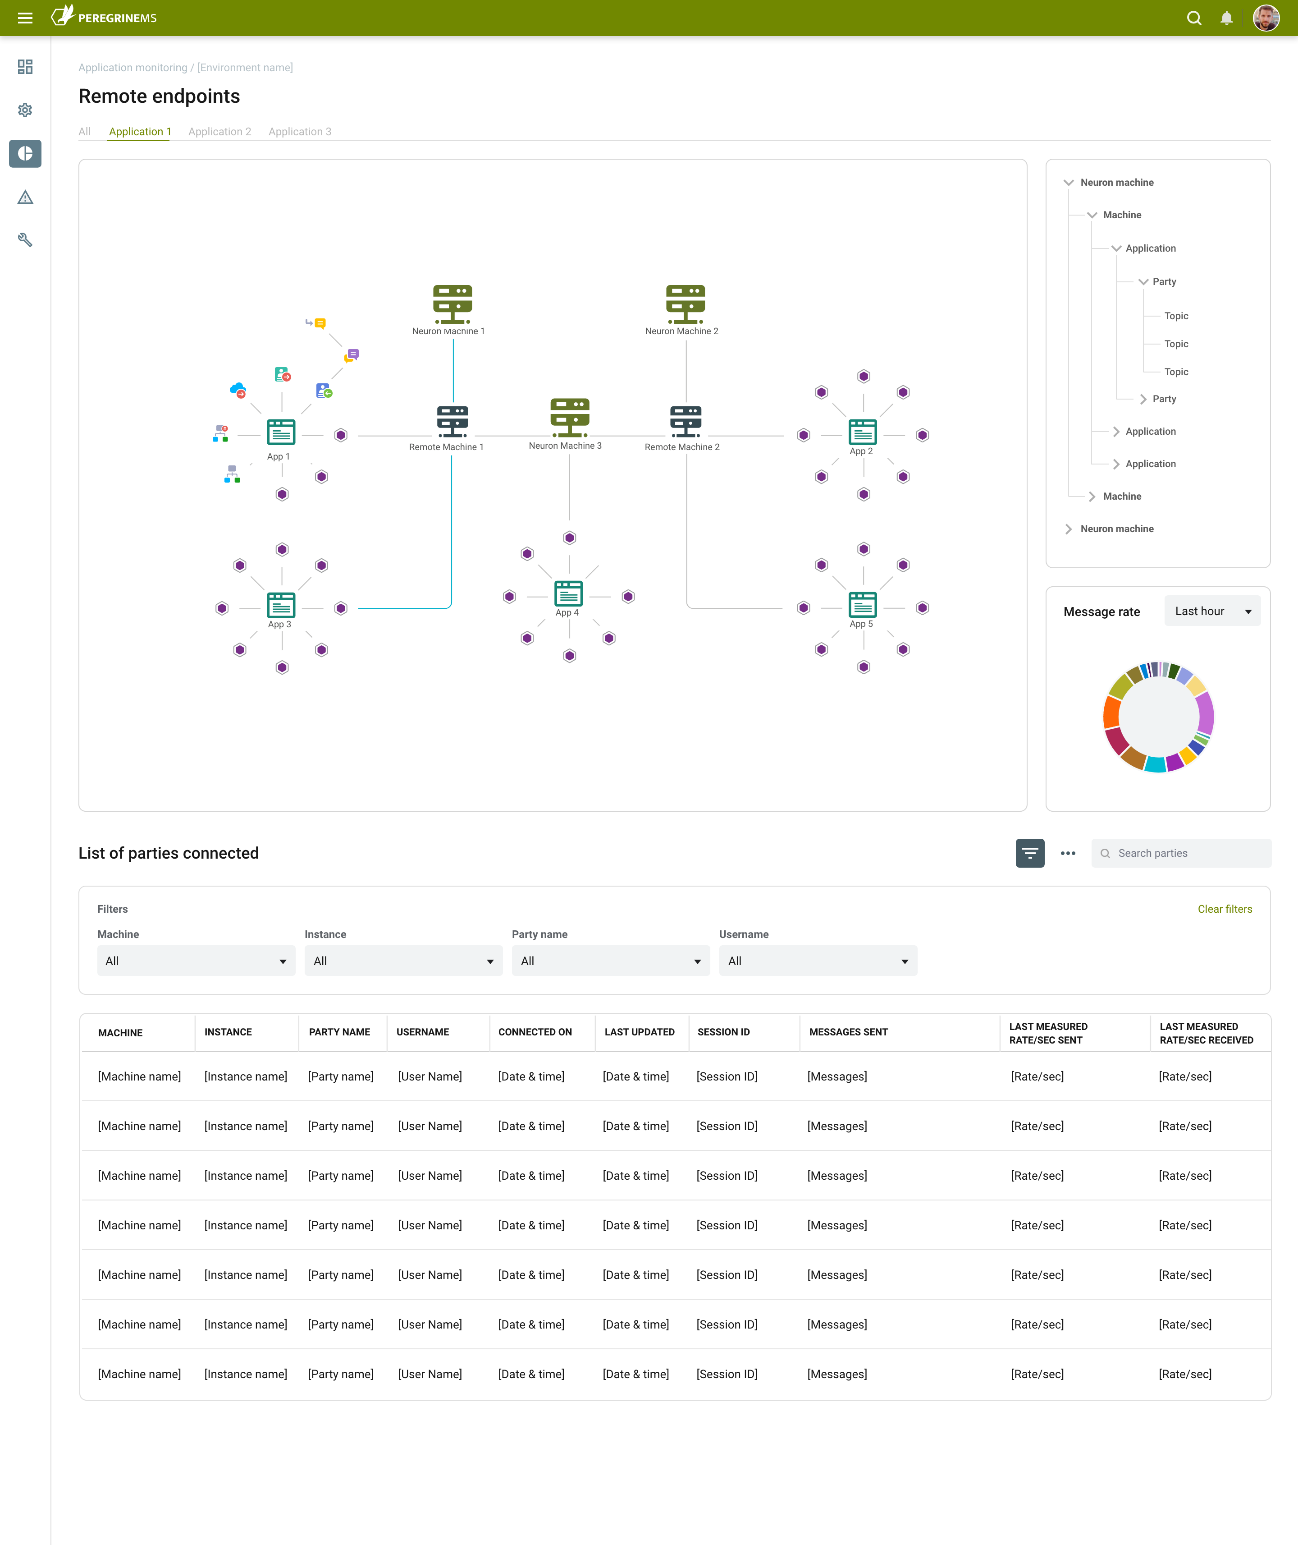
Remote Endpoints
Peregrine Connect’s Neuron ESB ships with a powerful hierarchical, Topic-based messaging sub-system to abstract and decouple endpoints from one another. In essence, endpoints could adopt either a publisher or subscriber role, where neither would have to know about the other and, where modifying one would not affect the other. This model remains incredibly beneficial for those systems requiring a loosely coupled design. New subscribing or publishing endpoints could be added without impacting the processing of the other endpoints. However, those designs usually employ one-way, multicast patterns, Workflow for example. This messaging sub-system is also commonly used to loosely couple other .NET applications with Neuron ESB. By embedding the Neuron ESB Client API into their .NET applications, users can publish or subscribe to Neuron ESB Topics, which in turn can forward the messages to any endpoint. Historically, monitoring the state and performance of remote endpoints fell upon the .NET application that the Client API was embedded in.
The Peregrine Connect Management Suite makes monitoring remote endpoints a first-class citizen now. When viewing a specific Application, the Remote Endpoint chart becomes visible, displaying a graph of healthy failed and offline remote endpoints. Right-clicking on the chart, users can navigate to the Remote Endpoint Monitoring home page displayed below. Users can see exactly what machines the remote endpoints are deployed to, what .NET applications they’re hosted in, and what the messaging traffic looks like between them.
Workflow Activity
This provides a quick view (line chart) of all the Workflow Activities being generated by the Application(s). Specifically, the active, pending, and waiting workflow statistics can be viewed in the chart. Users can right-click on the chart to navigate to the specific Workflow details in the Workflow Tracking monitoring module.
Workflow Status
This provides an alternative view of Workflow, specifically a donut chart that displays the relative number of completed, aborted, and suspended workflows. Users can right-click on the chart to navigate to the specific Workflow details in the Workflow Tracking monitoring module.
Workflow Completed
This provides users with a line chart showing the number of Workflows completed at any point in the time index. Users can right-click on the chart to navigate to the specific Workflow details in the Workflow Tracking monitoring module.
Endpoint Health
The Application Monitoring home page contains an Endpoint Health section which contains a list of all the endpoints within the Application(s). Endpoints can be sorted and searched. Users can group Endpoints based on runtime, machine, endpoint host, type, state, or even by workflow. Users can see the status of any endpoint. For example, the last heartbeat received, the CPU/Memory consumption at the host level, status, and processing rate. Users can even perform specific actions like stopping or starting an Endpoint. Similar to the Endpoint Health section that exists in the Operations Monitoring, users can select an individual Endpoint and display the Endpoint Health Monitoring home page for the specific endpoint as shown below. Users can view metrics like CPU/memory, message rate, messages processed, errors, and warnings. Additionally, users have access to the log entries and any successful as well as failed messages generated for the endpoint at the specific time index being examined.
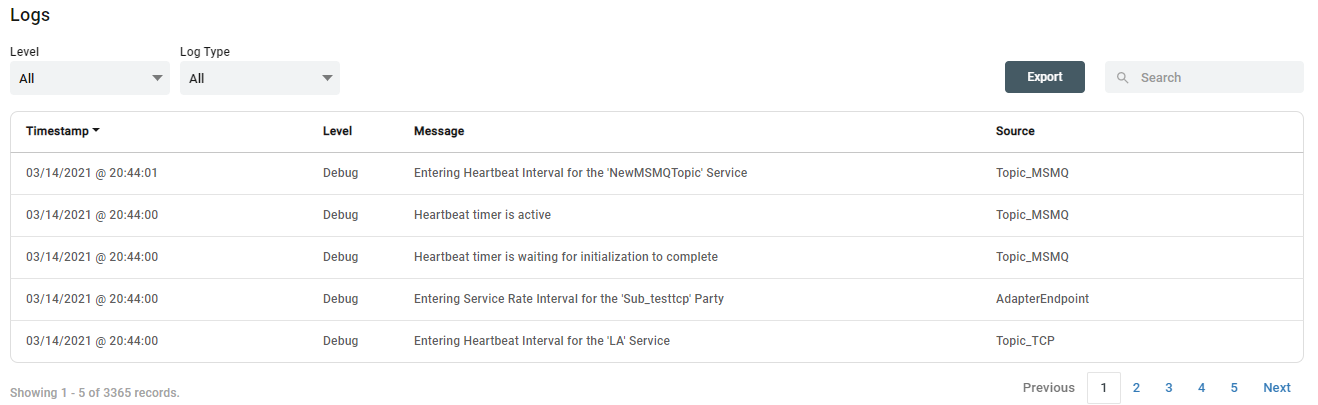
Logs
The logs section of the Application Monitoring home page is located at the bottom of the page and allows users to search the logs and filter based on log type and verbosity. Log entries can also be exported to Excel. This has identical to the Operational Monitoring Log section.
Endpoint Health
The Endpoint Health page under the Reporting module complements Application Monitoring by providing a very Endpoint-centric view of monitoring. For example, there are essentially four types of Endpoints within Neuron ESB that loaded under a runtime: Client Connectors, Service Connectors, Adapter Endpoints (Connectors), and Workflow Endpoints. Each of these can process their own message streams while, when loaded within a runtime, may go through various stages during startup, processing, and subsequent shutdown of the runtimes.
Client Connectors are essentially web-based services that can be configured with a URL that permits outside users or organizations to submit information. Some may refer to these as “webhooks”. These can be configured to execute a Business Process or flow against the incoming request or forward the request to Messaging Topic, Service Endpoint, Adapter Endpoint, or a long-running Workflow process.
Service Connectors/Endpoints on the other hand are pointers to existing web-based services that are located either on-premise or in the cloud. These can be called directly by a Business Process or Workflow or, can be configured to subscribe to messaging topics where the loose coupling is required.
Adapter Endpoints/Connects are used to receive information from or send information to NON-web-based applications, protocols, or databases. For example, a user could configure an FTP Adapter Endpoint to monitor and retrieve files from an FTP folder for processing. Conversely, an SAP Adapter Endpoint could be configured to subscribe to incoming information and update an SAP customer.
Workflow Endpoints are unique as they are built specifically to provide business resiliency and continuity. They support detailed tracking metrics, correlation of incoming event information, and long-running transactions that may span hours, days, or weeks. They automatically failover and recover to other Endpoint Hosts if one fails. They’re initialized by subscribing to incoming information received by the other Endpoints or the Client API and then.
Although much of the Endpoint information can be found in the Endpoint Health section of Operations and Application Monitoring home pages, it is only presented in a list view. The Endpoint Health reporting page provides an alternative view of charts and heat maps depicting all Endpoints either grouped by type, status, state, or processing metrics. Using the heatmap, users can quickly attest and drill into an Endpoint generating warnings or errors. The machine and application charts can also be used as filtering mechanisms to provide a more granular summary of the Endpoints to monitor. Users can drill down into the charts for a more detailed view and list of the Endpoints they are interested in.
Conversely, all the Endpoint Health information can also be presented in a List view for the user by clicking on the View icon. The list view is identical to that presented in Application and Operations Monitoring and allows the searching, sorting, and grouping of endpoints. By selecting the Monitor context menu of an endpoint, users will be navigated to a detailed Endpoint Monitoring page for the specific endpoint as seen in Figure 24.
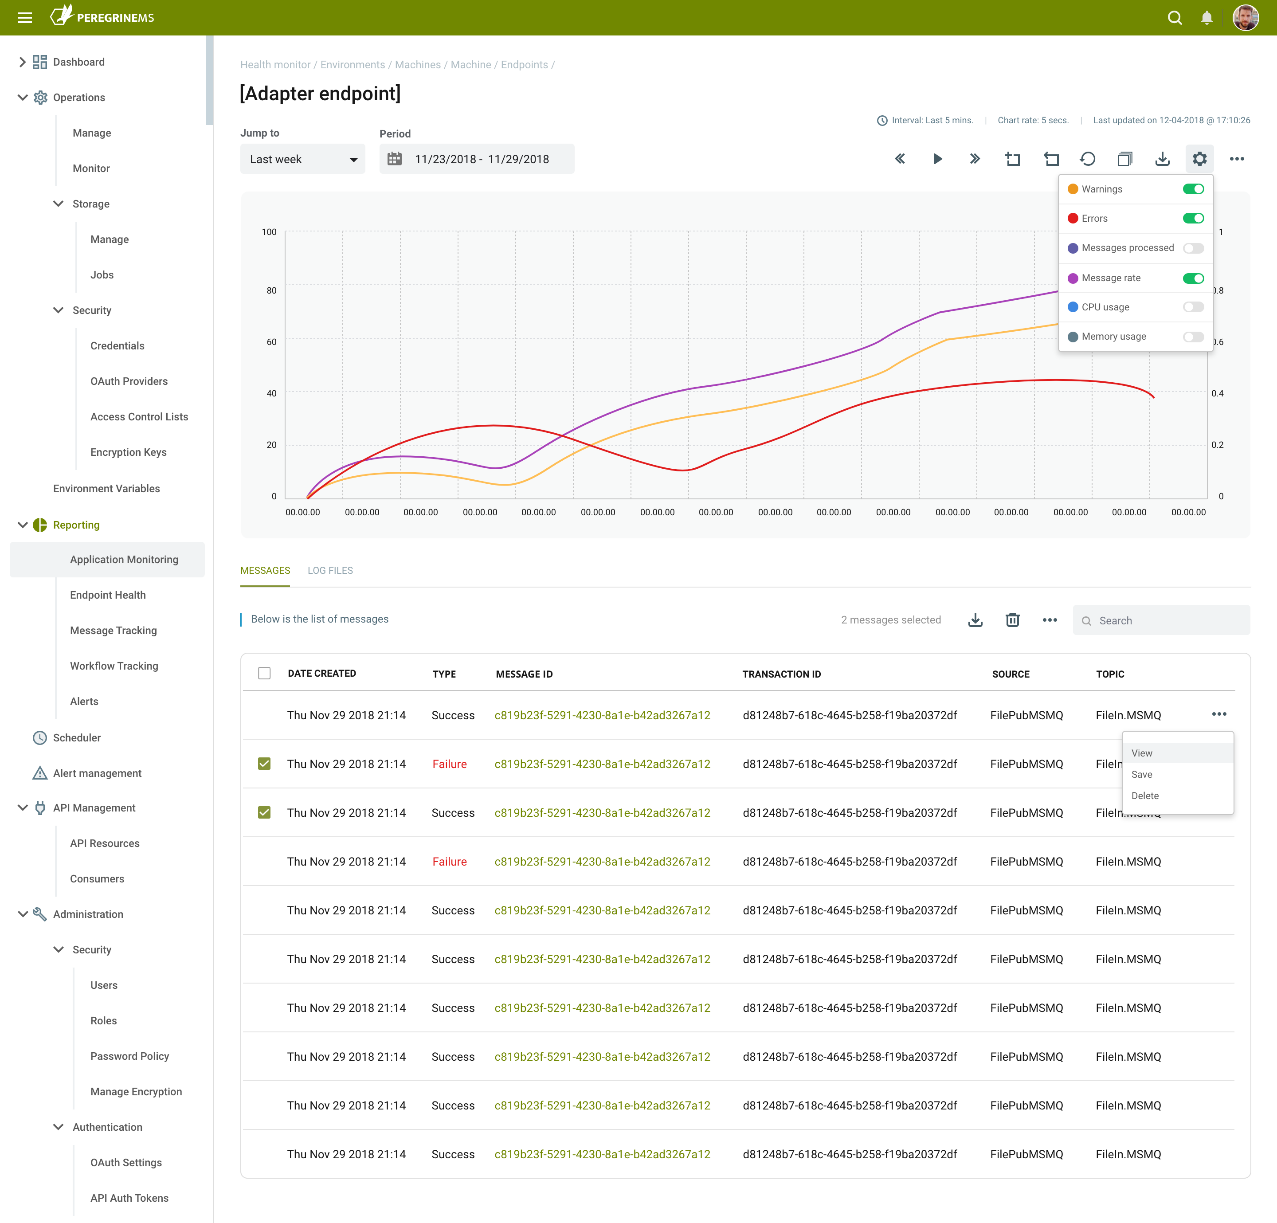
Message Tracking
Neuron ESB provides message tracking capabilities at several levels, commonly referred to as Message Auditing. When configured properly, messages either published to or subscribed to through the Neuron ESB Topic-based Messaging system were historically placed in the Neuron SQL Server-based Audit tables (database). Additionally, messages can be tracked anywhere and anytime within a Business Process or Workflow using Audit Process Steps or Workflow Activities. Message Tracking (i.e. Auditing) is an invaluable tool for understanding the flow as well as preserving the message for later examination or resubmission to the system. More importantly, when failures occur within an Endpoint processing a message, or within a Business Process or Workflow, or even via a Policy violation, that message and its failure information is was also placed in the same SQL Server database.
The process of storing messages in SQL Server incurs a degree of overhead. Performance degradation was more pronounced if Auditing was configured to be synchronous. There were intrinsic limits placed on how messages could be searched and retrieved due to the rigid structure of the tables. For example, searching within the message body of a tracked message was impossible, as well as searching against the values of custom properties associated with the message.
With the introduction of the Management Suite, these problems are gone. Once Neuron ESB is configured within a managed Environment, all Audited and Failed messages are forwarded to the Event Processing Service, and ultimately stored and indexed with Elastic Search. Organizations can navigate to the Message Tracking home page under Reporting to view a summary of Message Tracking activity for the Environment. The Message Tracking reporting summary page provides an alternative view of charts depicting message rate by Application, Source, Failure Types as well as Business Processes. This can be quickly maximized to display a full-page view.
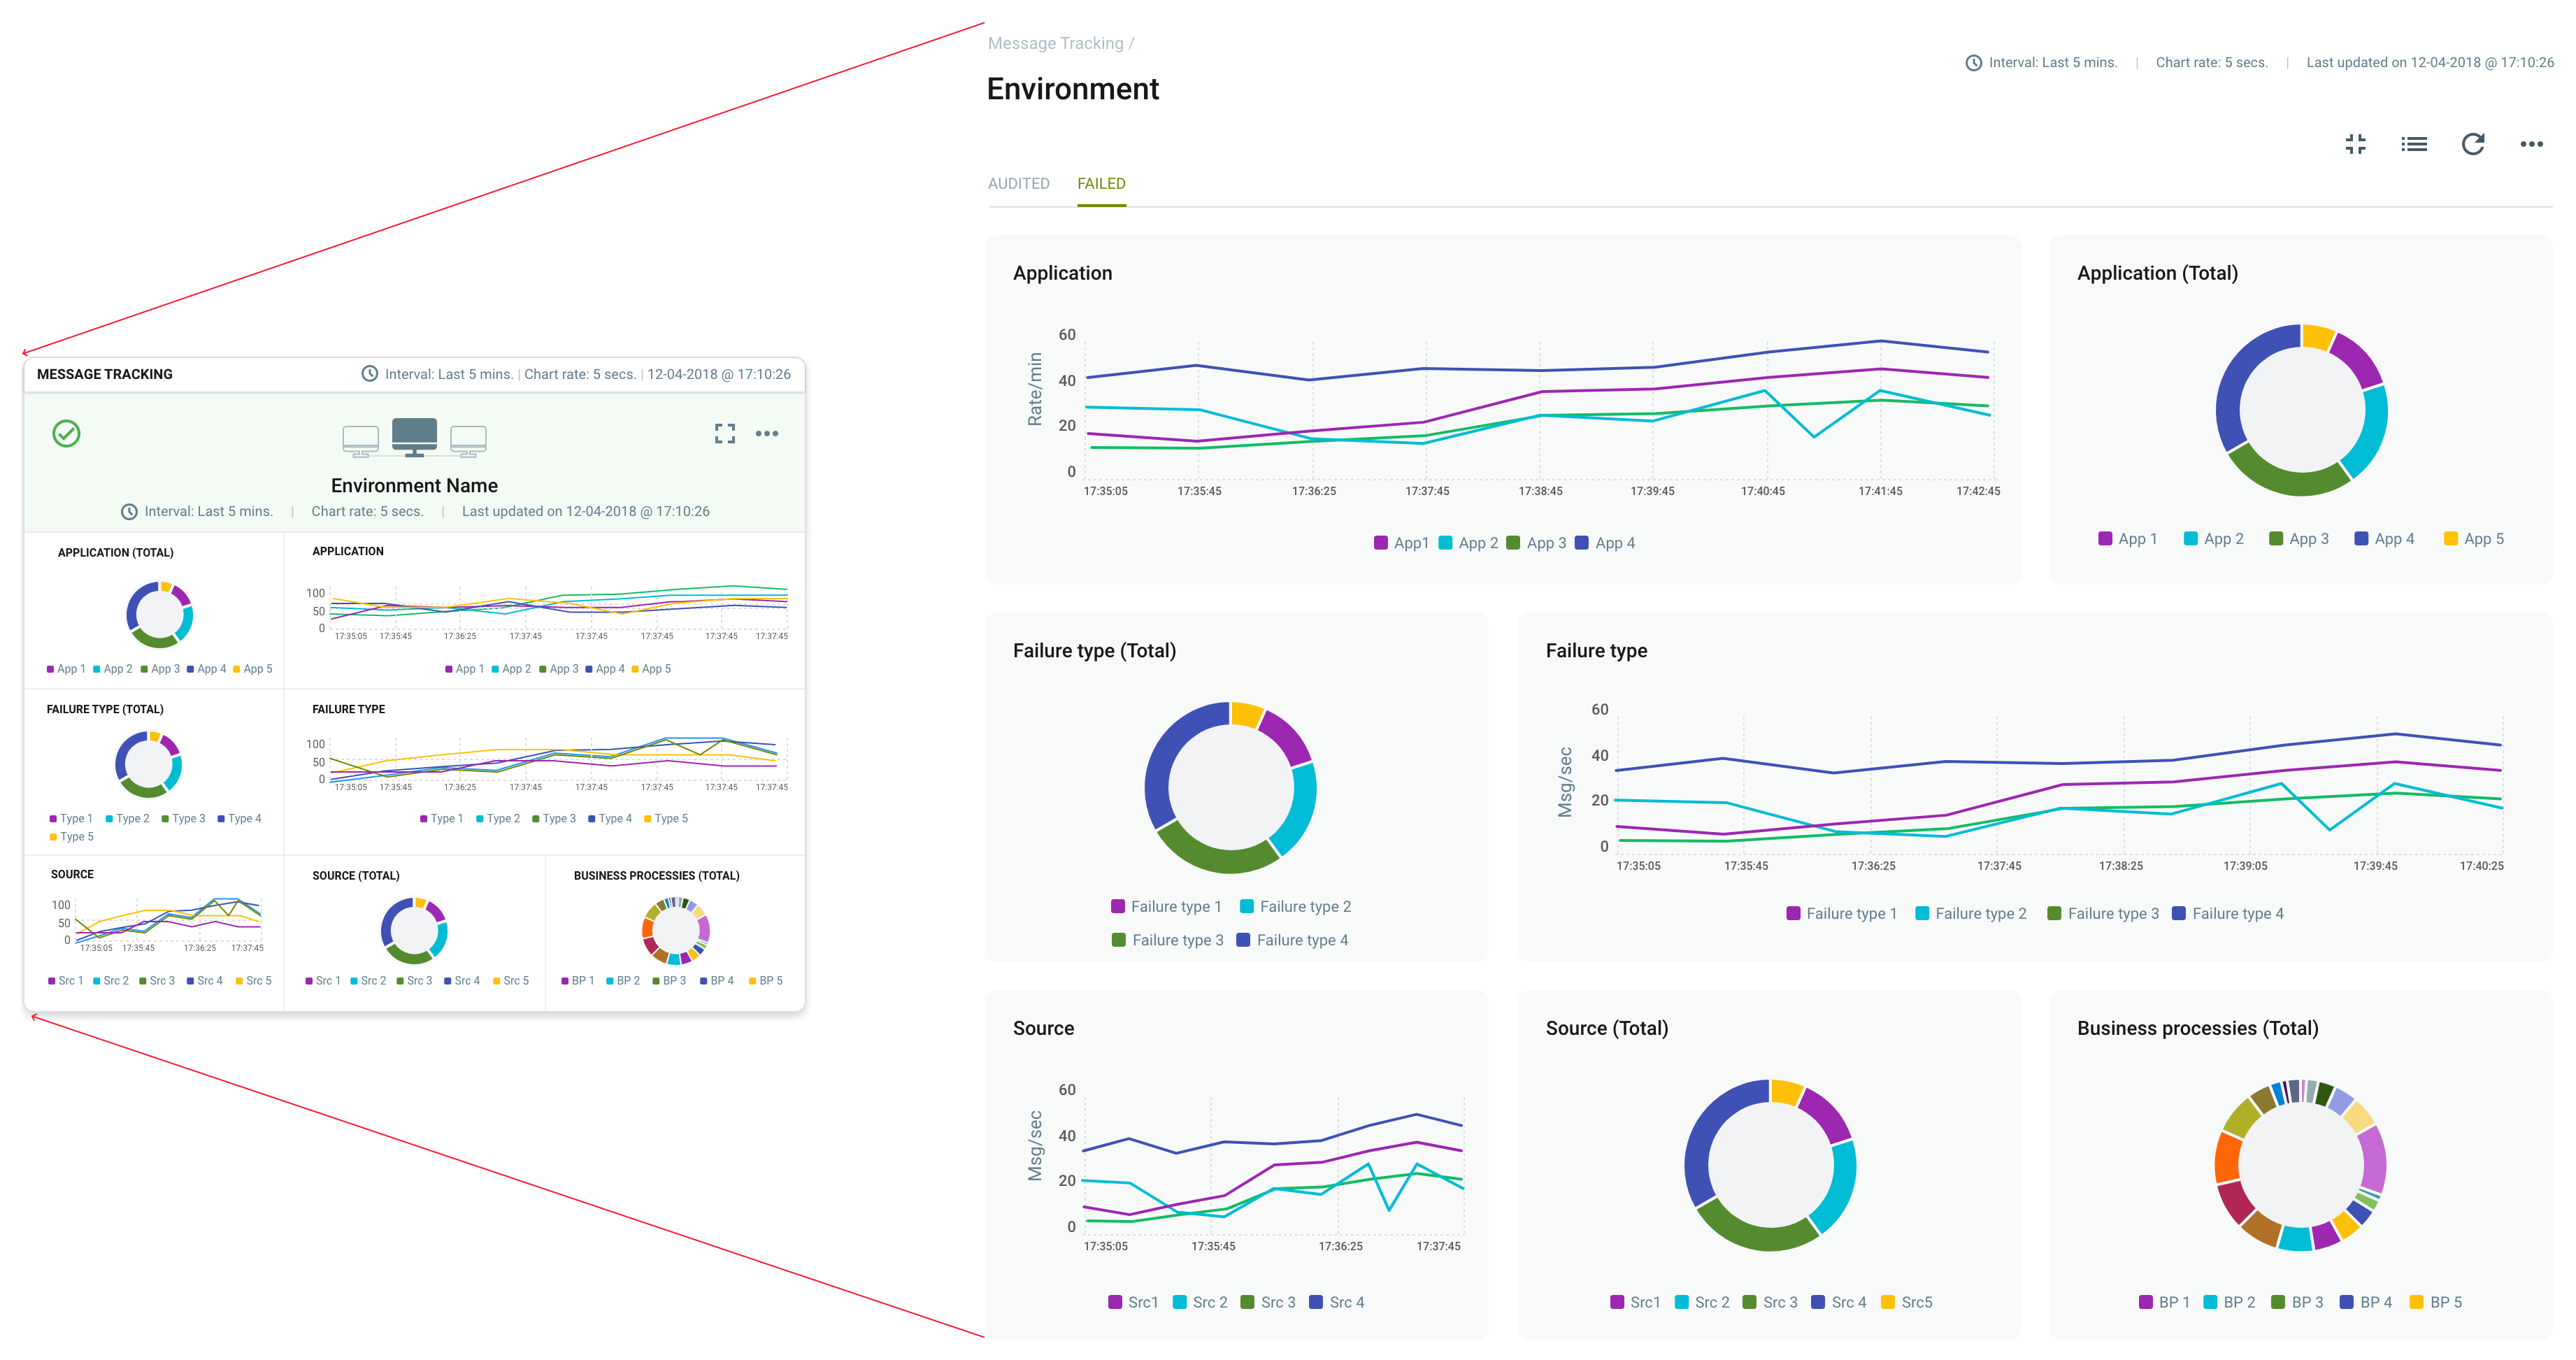
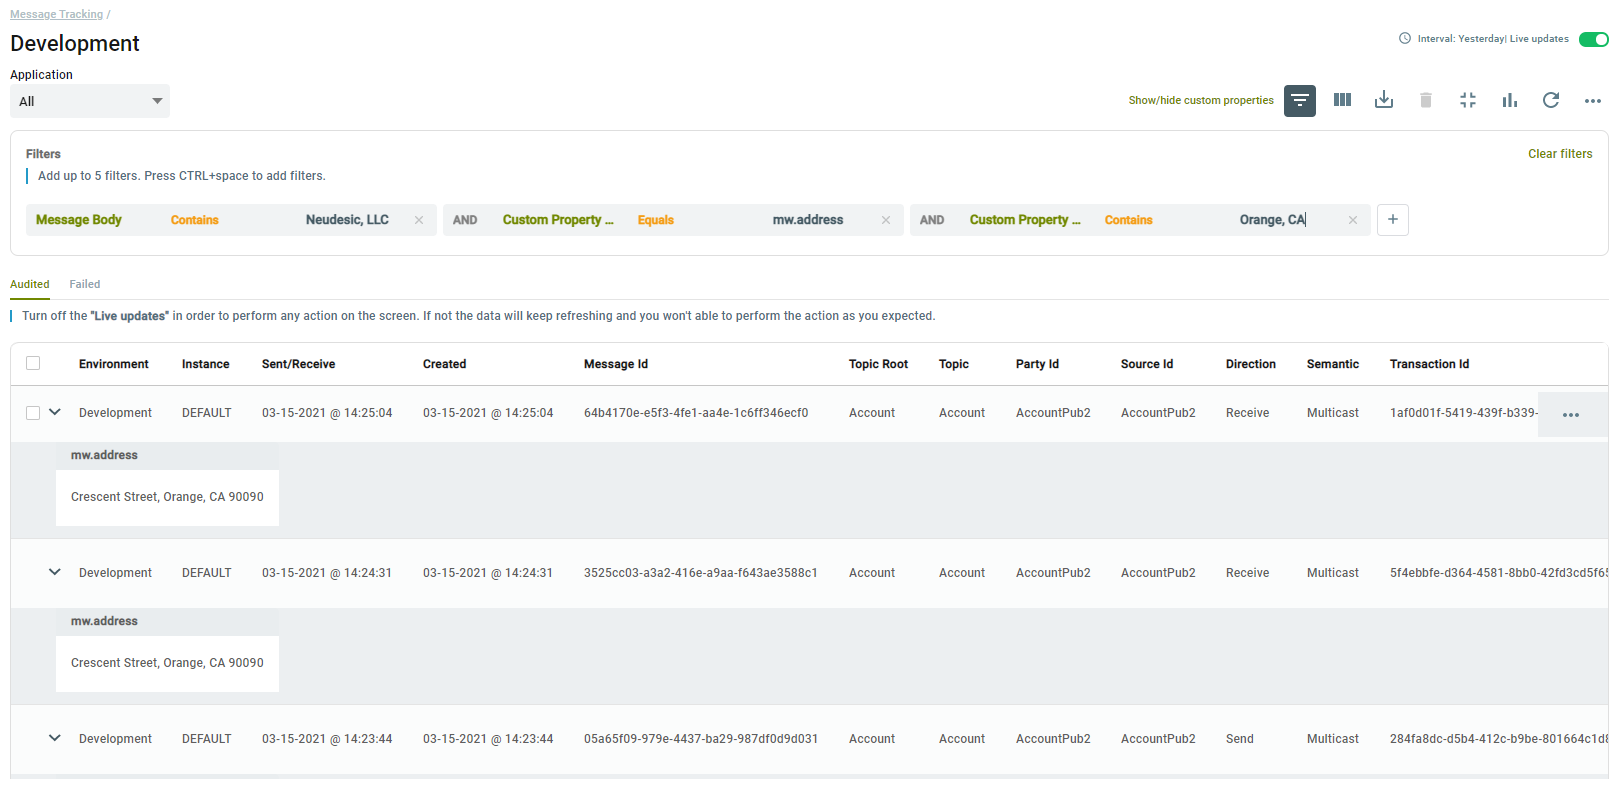
Each type of message that is tracked (i.e. Successful Audit vs Failed Audit) is represented by a dedicated tab on the full-page view as shown in the figure above. Users can also choose to see a list view of the messages where they can be filtered, searched, and sorted. Users can choose to make specific fields visible or invisible, including custom properties as shown below.
Organizations will find the Message Tracking list an invaluable tool for finding the correct message of interest. Searches can be conducted against any internal property as well as the message body and, more importantly, custom message properties. These searches can be AND/OR together with predicates to conduct complex search requirements.
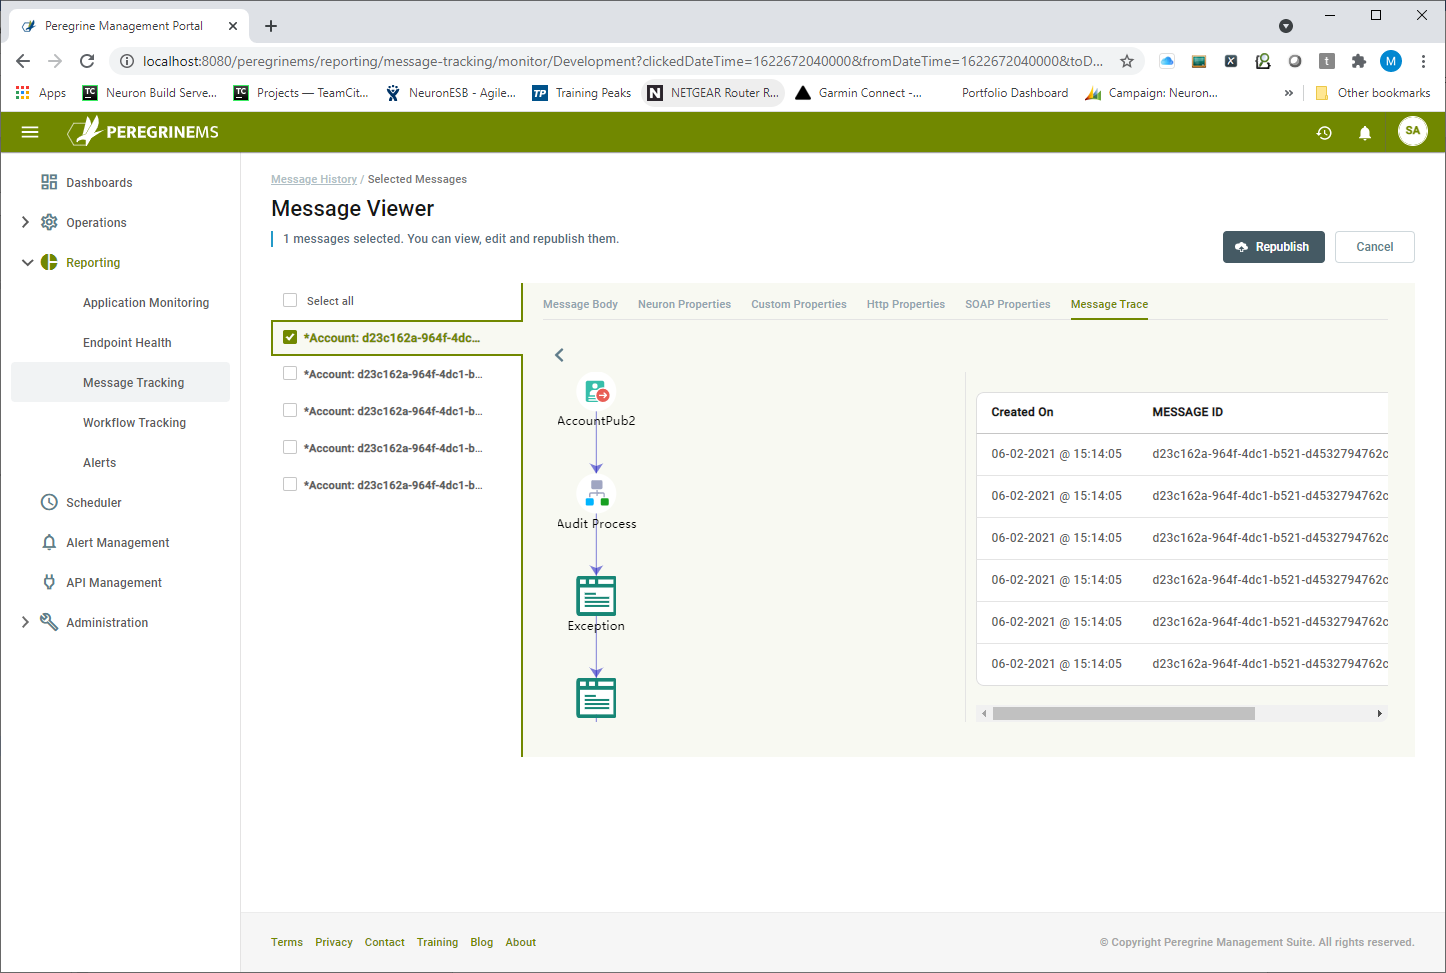
Once the messages of interest are found, they can be viewed individually or in a batch by selecting the “View” context menu. This will navigate the user to the Message Viewer where the message body and properties can be viewed.
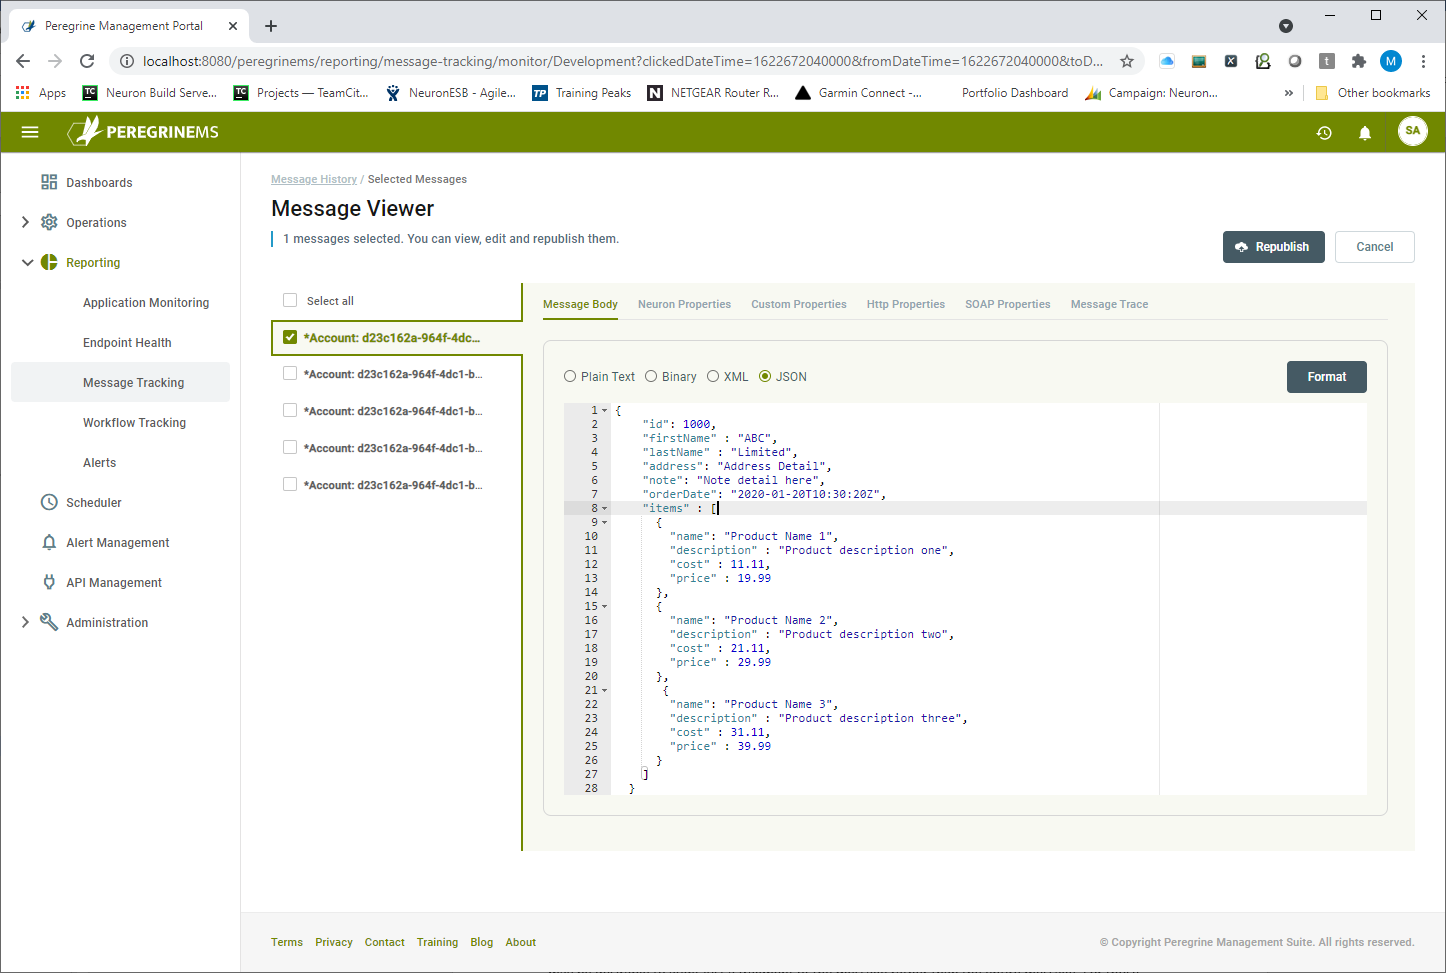
The Message Viewer page provides the list of selected messages on the left and the body and property viewers on the right. Selecting a message displays the message body in a type context-sensitive window where it can be edited if the user intends to republish the message. The Message Viewer has several tabs that allow access to all the internal and custom properties. Additionally, there’s a Message Trace tab where users can see a visual graph depicting the source of the message and the route it took to the point where it was audited. If the message was processed by a Business Process or Workflow, that would be displayed as well as shown in the figure below.
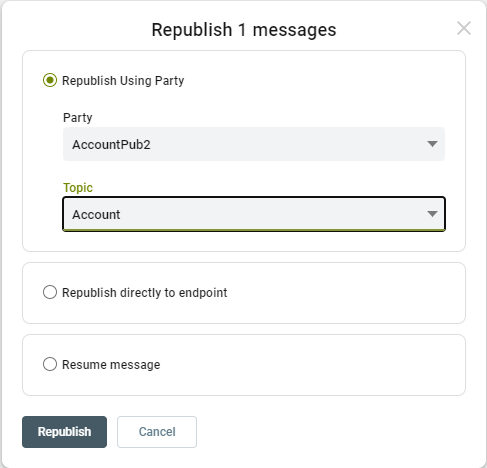
Once a message is found, it can be edited and resubmitted to any existing Endpoint or Topic.
Workflow Tracking
Neuron ESB’s Workflow capabilities allow companies to design fault-tolerant, business resilient workflows to automate critical processes that may span hours, days, weeks, or months and cross inter- or intra-company domains. Neuron ESB Workflow provides several features including real-time activity tracking, fault tolerance, correlation of long-running messages as well as “out of the box” compensation (commonly referred to as “saga” or “long-running transactions”).
Neuron ESB Workflow provides businesses the ability to automate and manage processes that span cloud, partner, system, and organizational boundaries. When critical failures occur in the process or the underlying hardware, workflows can resume where they left off in the Neuron ESB hosting environment. That hosting environment load balances the execution of workflows across multiple servers in dedicated/isolated host processes. This same clustered hosting environment allows failed workflows to automatically roll over onto available servers and start where they left off, providing both resiliency and reliability for mission-critical functions.
The Workflow Tracking System, where users could visually monitor and manage previously, or existing running workflows is contained within the Neuron ESB Explorer. However, its functionality is limited.
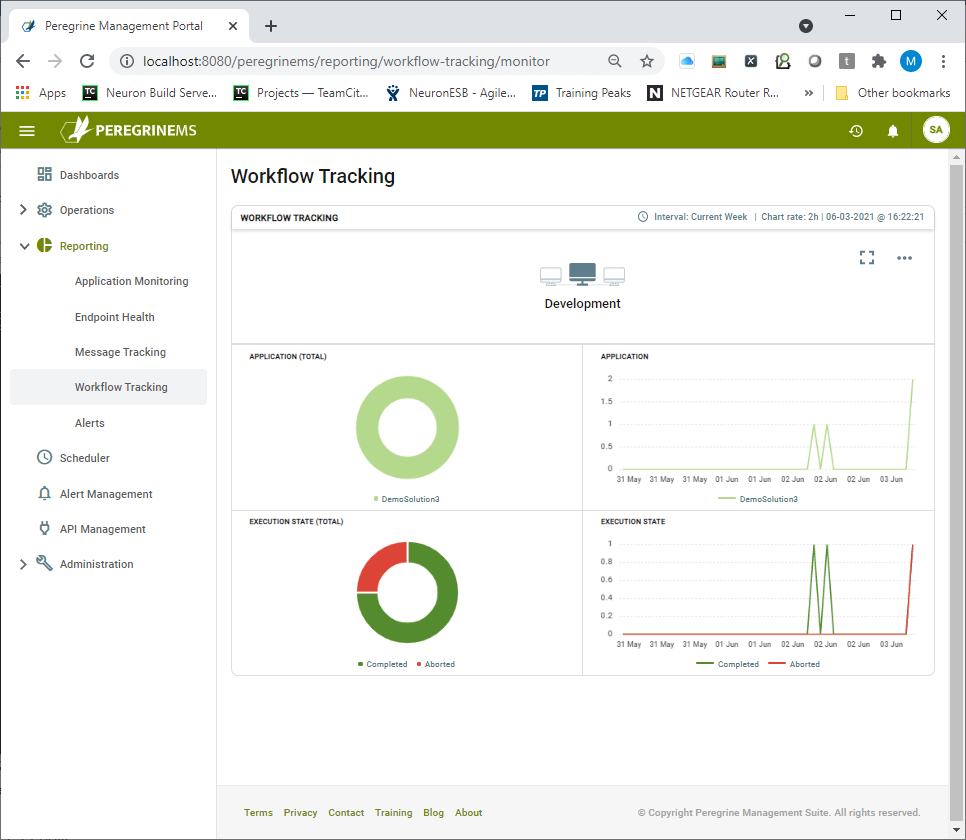
A new enhanced version of Workflow Tracking has been included with this version of the Management Suite. Organizations can navigate to the Workflow Tracking home page under Reporting to view a summary of Workflow Tracking activity for the Environment. The Workflow Tracking reporting summary page provides an alternative view of charts allowing users can view the rate and status of workflows by application and execution state.
Organizations can quickly identity if there are too many workflows in any specific state. They can also track progress of the individual workflows through various activities. The following image shows the summary view of Workflow Tracking. This “card” view basically represents a rollup view of all the applications deployed to a specific environment. Hence, there will be as many cards visible on the screen as there are environments. A card view shows the name of environment in the top row. Second row shows number of workflows by application in a pie chart and a line chart against a sliding time scale. The third row shows workflows by execution state in a pie chart and a line chart against a sliding time scale.
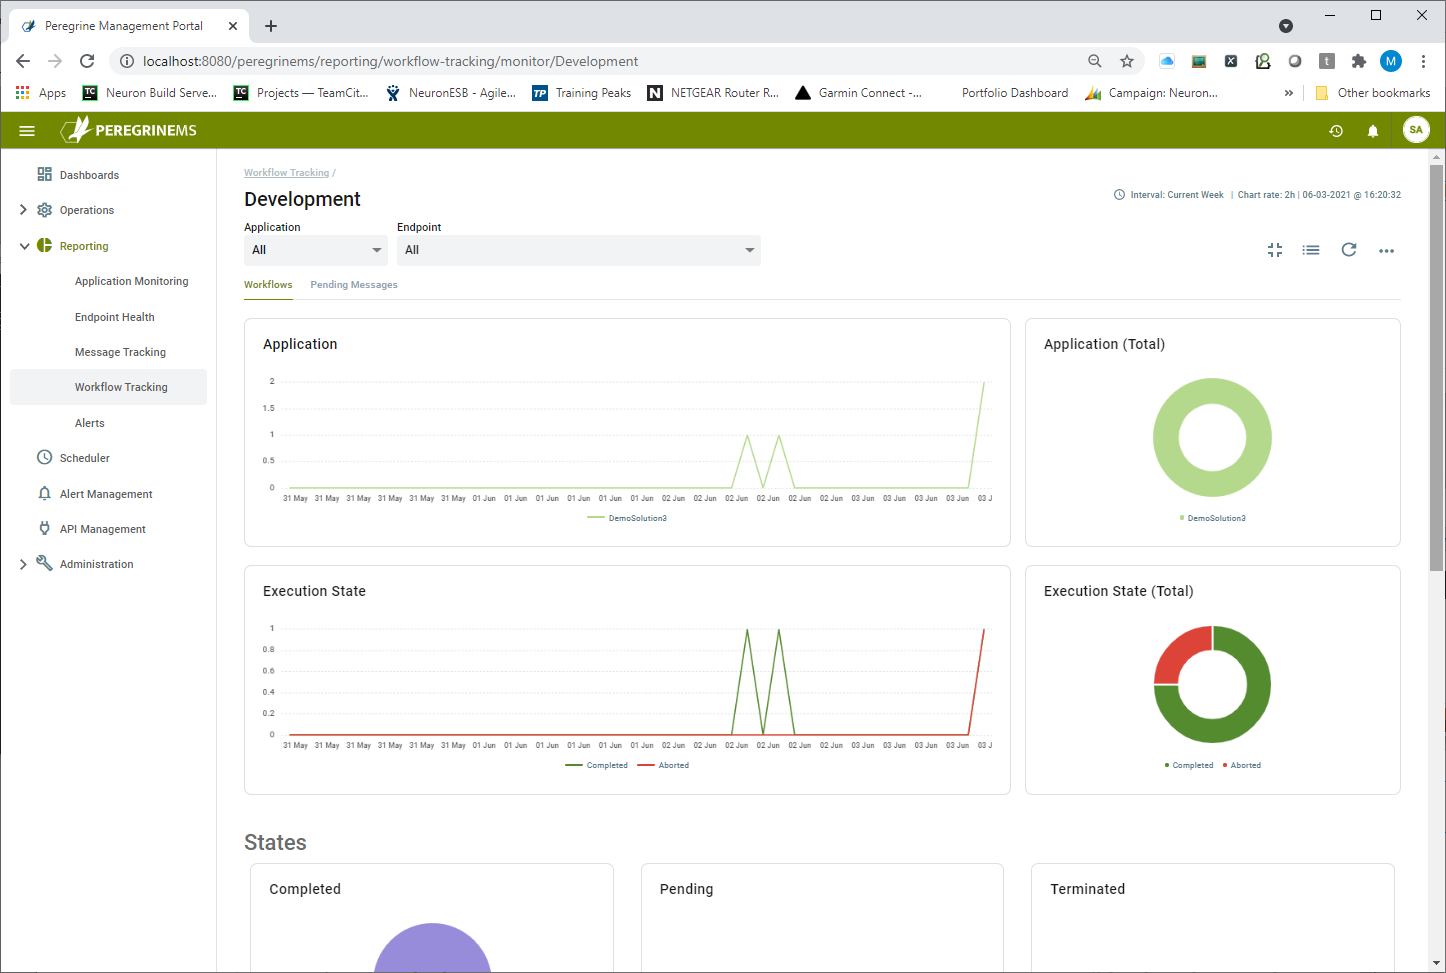
A card view can be expanded into a more detailed view as shown below. When expanded, the same information as seen on the summary page is visible as the top two rows. This page has Filters to view the information by Application and Workflow Endpoint combination.
There are two tabs under the filter drop-down boxes for Workflows and Pending Messages. Pending Messages happen under load when the workflow engine is too busy to intake and start more workflows. These messages are queued up in a Pending state, but they are always assured to be stored so that there is no data loss.
Below the main two rows are a series of nine pie charts, each representing a different state by workflow endpoint. The view by execution states provides a good overall picture of the activities occurring within the Workflow System. Following is a guide to workflow execution states.
Users can drill down into any data point represented on a chart to view its detail in a more conventional list view which can be filtered, searched, and sorted even further.
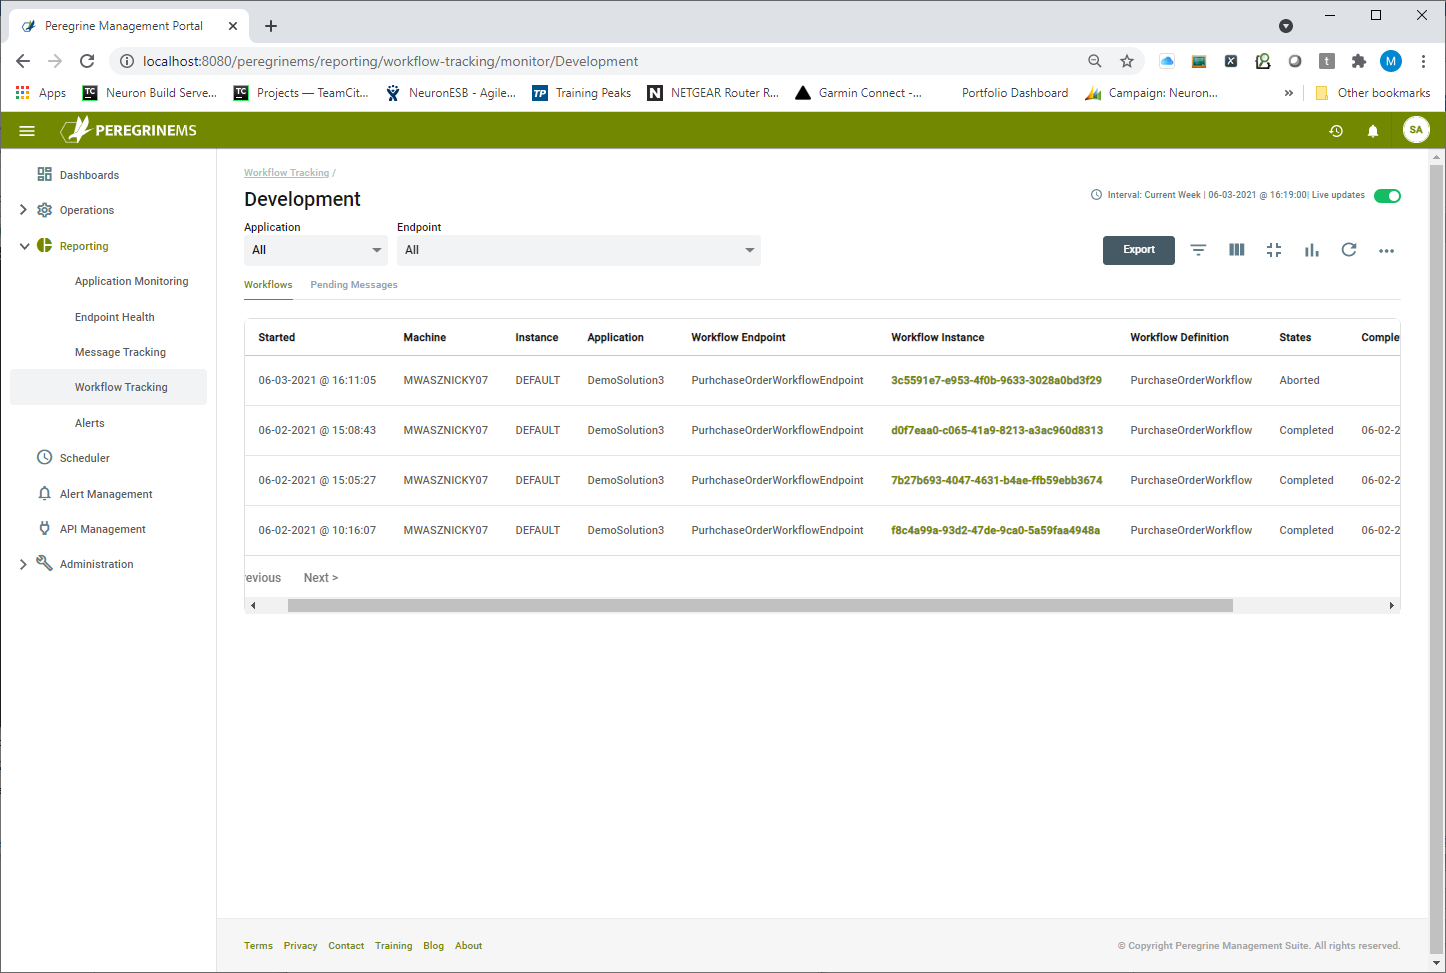
Using the list view, users can perform important operations against tracked workflows such as cancel, suspend, or resume workflows depending upon their status. These options are available on the context menu for each record. Users can select one or more workflows to apply the same command to all of them.
Additionally, users can click on a link in the workflow definition column to launch the Workflow Tracking Detail Viewer. This tool is downloaded onto the browser’s computer and provides a rich UI to analyze the workflow definition and issues without having to open the Neuron ESB Explorer and the solution. Once the Setup has been run, clicking on the workflow definition link will launch the Viewer as shown in the image below.
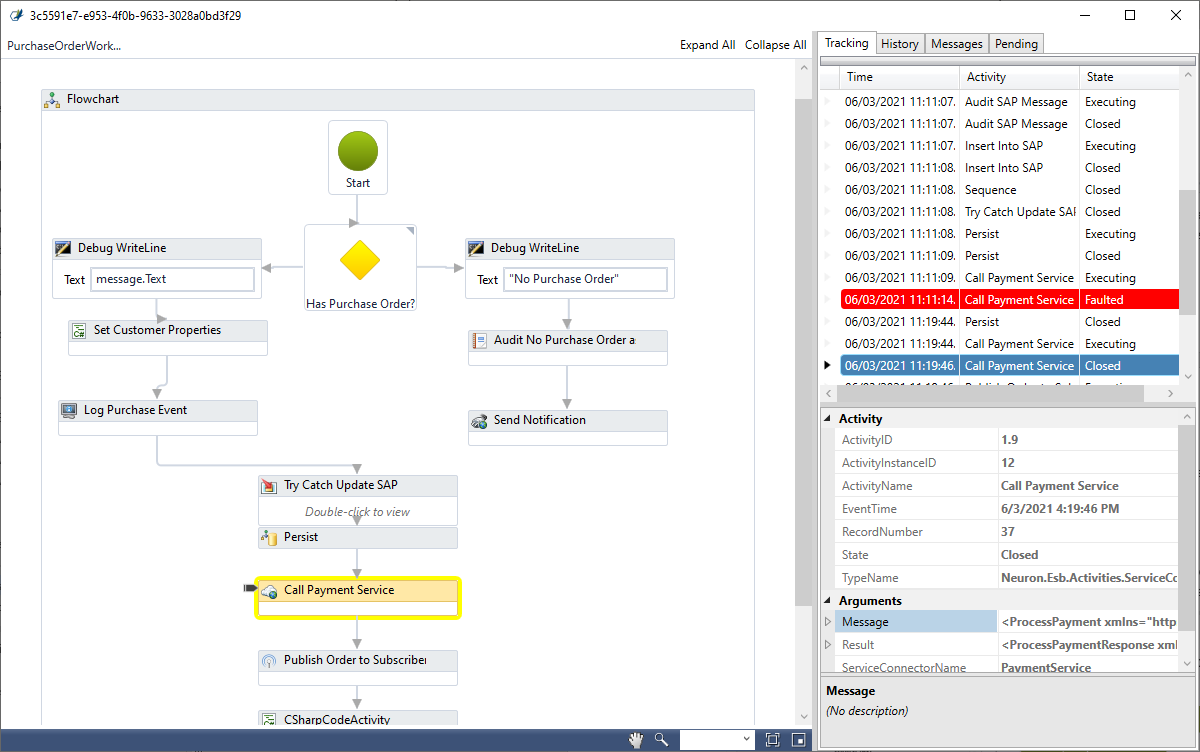
The workflow definition with all the steps in the workflow is visible in the left-hand pane of the Viewer. Workflow tracking records displaying the date/time, Activity type, and State are visible in the first tab in the right-hand pane. Users can click on any tracking record in the right-hand pane to synchronize to and highlight the activity depicted in the Workflow definition in the left-hand pane.
The second tab lists the execution history of the selected workflow activity with the Event date/time and state while the third tab displays a list of messages processed or generated by workflow activities along with activity name, name of the message, and date/time. Lastly, the final tab allows users to view the messages pending to be processed by that instance of the workflow as in the case with a singleton pattern.
Double-clicking on any of the messages in the tab or arguments section of the property page will launch the Workflow Message Viewer as shown below.
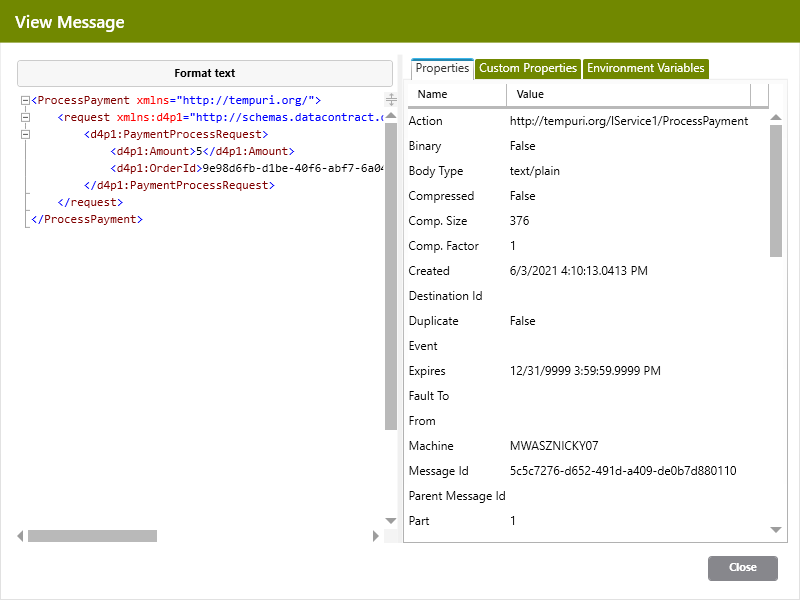
The Message Viewer displays the actual message text in the left-hand pane and the Neuron ESB message properties, custom properties, and Environment Variables in different tabs located in the right-hand pane.
Alerts and Notifications
Overview
The Peregrine Connect Management Suite provides operational and application-level alerting to the Neuron ESB runtime environment and its dependencies. Alerting is a powerful feature that can be used proactively by organizations so that they can be notified when anything within an environment is exceeding specific thresholds defined by “Alert Rules”. For instance, people in operations may want to be notified if the servers or runtime processes that the application is dependent on are exceeding a certain level of memory or CPU consumption. Alternatively, the business may want to know when a specific service in an application is either exceeding an N number of requests over a specified period or, has been idle.
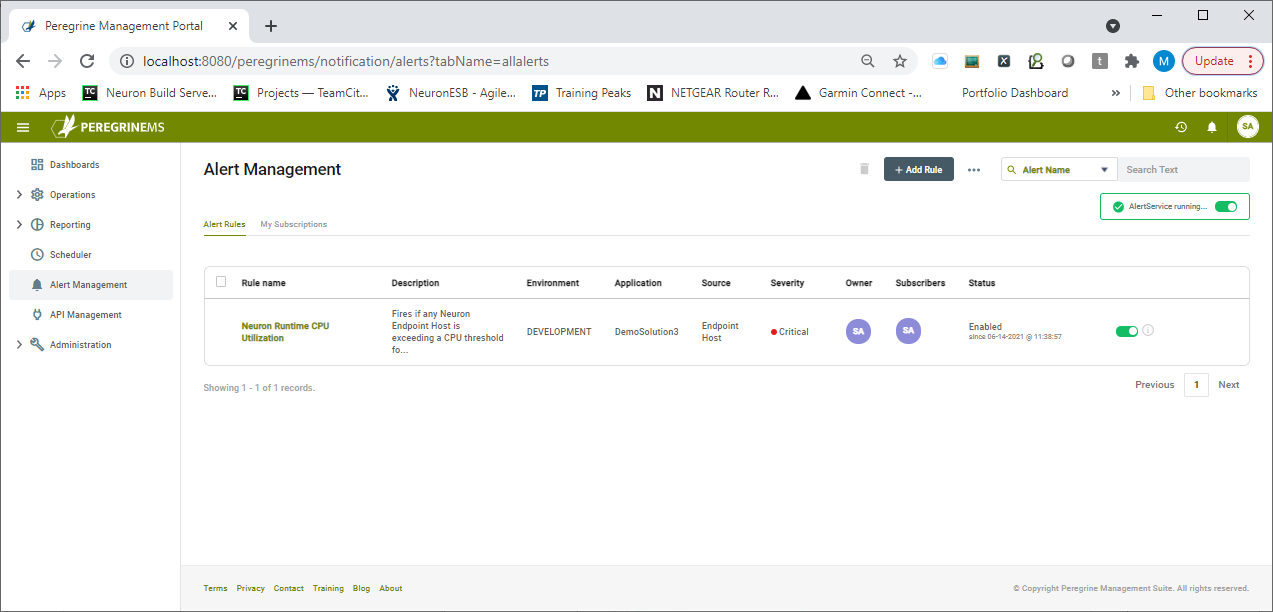
Alert Rules can be created within the Alert Management section of Peregrine Management Suite. The image below shows the Alert Management module where Alert Rules have yet to be created
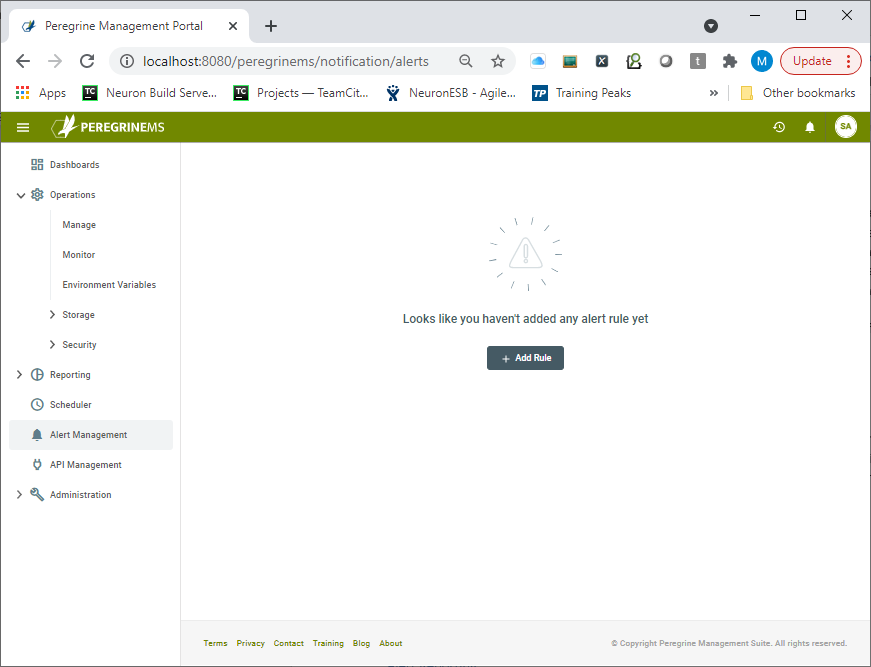
Alert rules are a powerful feature within the management suite because they can be created with conditions that can examine nearly every event and log entry received from the Neuron ESB runtimes and their dependent machines. When those user-defined conditions are met, a notification is sent out to all subscribers of the Alert.
There are many aspects to an Alert Rule. For one, Alert Rules can be made public so that other users of the Management Suite can subscribe to them. Alert rules can be specified to occur only when the condition lasts for a certain duration. Consecutive alerts can be suppressed, holidays and black-out windows can also be defined.
Alert Management
Creating Alert Rules
Alert Rules can be created by clicking the “Add Rule” button. This will launch the Create Alert Rule Wizard.
An Alert Rule can be thought of as being composed of a combination of properties, attributes, and a Condition. On the first page of the wizard, users can select the appropriate Severity level of the alert, its visibility to other users (i.e. Public or Private), the specific, Public or Private, as well as the specific Environment that the rule should be applied against. Once the Environment is selected, the Event Source against which the Alert Rule will be created can be selected. The following Event Sources are currently supported.
- Neuron ESB Machines
- Neuron ESB Runtime
- Neuron ESB Endpoint Host
- EPS Machine
- EPS Service
- Topics,
- Adapter Endpoints
- Service Endpoints
- Workflow Endpoints
- Peregrine Scheduler.
Depending on the Event Source the user selects, they can choose a specific application, or all applications deployed to the selected Environment. The Event Source also controls the source entity drop-down located beneath it. For example, if a user selected Endpoint Host, or Adapter Endpoint as an Event Source, they could in turn select the name of the Endpoint Host or Adapter Endpoint (Operands) to create the Condition against. A user could also elect to apply the Alert Rule to all the entities that match the Source type.
The last row of the Create Alert Rule Wizard is used to define the Condition that causes a notification to fire. The Condition can contain one or two Operands; the name of the entity to apply the condition against, and the property of the Entity to evaluate against the Condition. Conditions always evaluate to either True or False. The Operands are represented by the first two dropdown boxes as shown below. In some cases, users can select “Any” instead of a specific entity name. This can be useful if a user wants a specific rule should be applied at the entity level rather than just against a named entity:
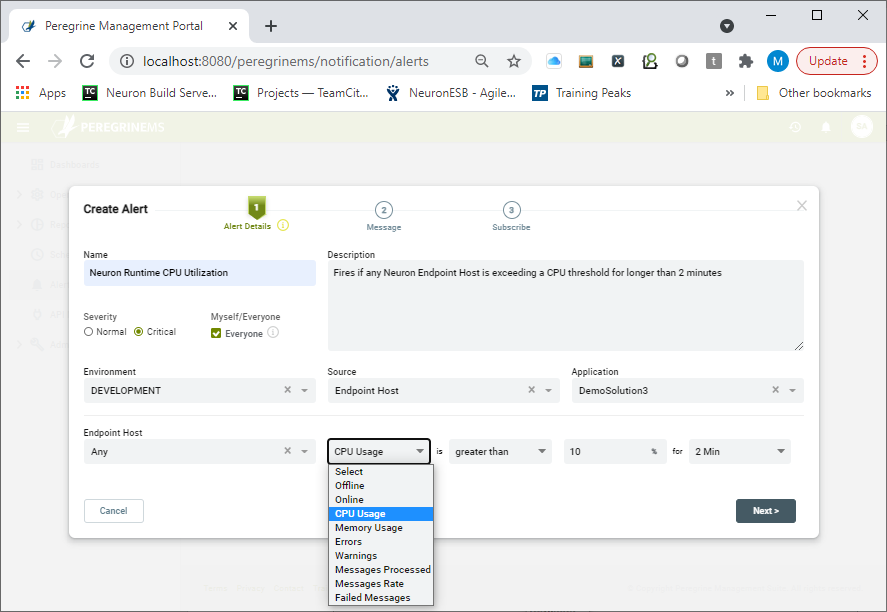
For example, if the name of an Endpoint Host is selected, the user would then select the property to evaluate the Condition against. In this example the user could select from one of the following:
- Offline
- Online
- CPU Usage
- Memory Usage
- Errors
- Warnings
- Messages Processed
- Message Rate
- Failed Messages
In some cases, the selection of the Property may define the entire Condition, as in the case of Online or Offline. However, in most cases, users will need to select a specific Operator if the Condition should define a property exceeding or underperforming a certain threshold. For example, an organization may want to be notified if an Endpoint Host exceeds 75% CPU utilization for longer than a 2-minute period. In any case, once the property is selected, any available Operators will be displayed in the drop-down located to the right of the property field such as Greater Than, Less Than.
Once the Operator is selected, the value (Operand) for the Operator needs to be entered. Depending on the entity Property selected, this will be evaluated as either a whole number, number per second, or a percentage. Again, depending on the entity Property selected, the Duration dropdown may be available. For example, in the use case cited earlier regarding CPU utilization, the user could choose anywhere from 2 minutes to 1 day as the duration for the Condition evaluation.
Notification Messages
Once the Alert Details have been entered, the user can define the message that will be sent out if the Condition evaluates to True. This is done on the Message page of the Create Alert Rule Wizard. This page provides users the ability to determine the email body type (i.e. Plain Text or HTML), the subject line (which can be different for SMS text messages) as well as the actual Body of the message to send out.
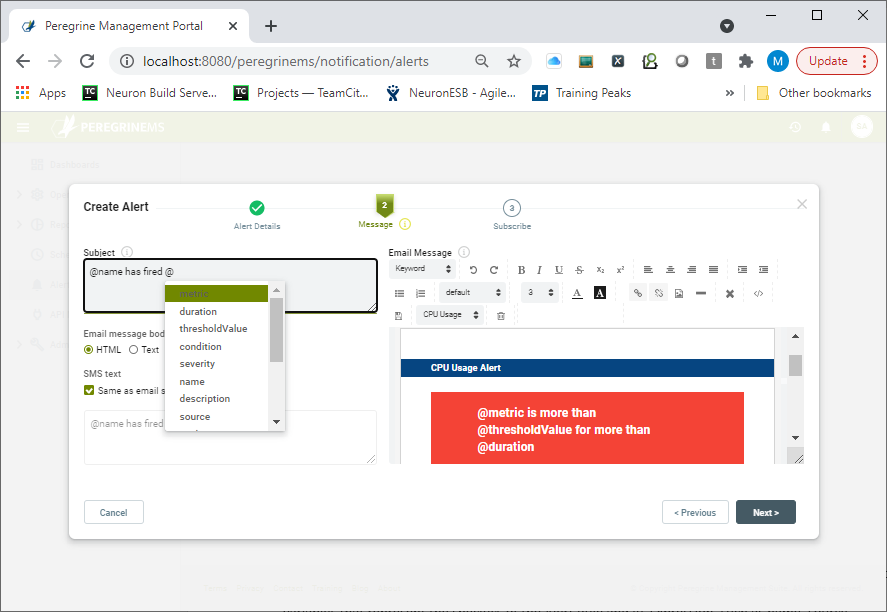
Users can either create an email Body from scratch using the included Editor or use a previously created body saved as either a plain text or HTML Template. Within the body or Subject, users can insert variables (pressing the ‘@’ key will display a dropdown of variables) that represent the value of the properties, attributes, and Condition of the Alert Rule such as name, source, environment, application, duration, metric, threshold value, condition, source type, etc.
For Instance, given the image shown previously, the following variables would be resolved as:
@metric = CPU Usage
@thresholdValue = 10%
@duration = 2 Min
@condition = “CPU Usage is greater than 10% for 2 Min”
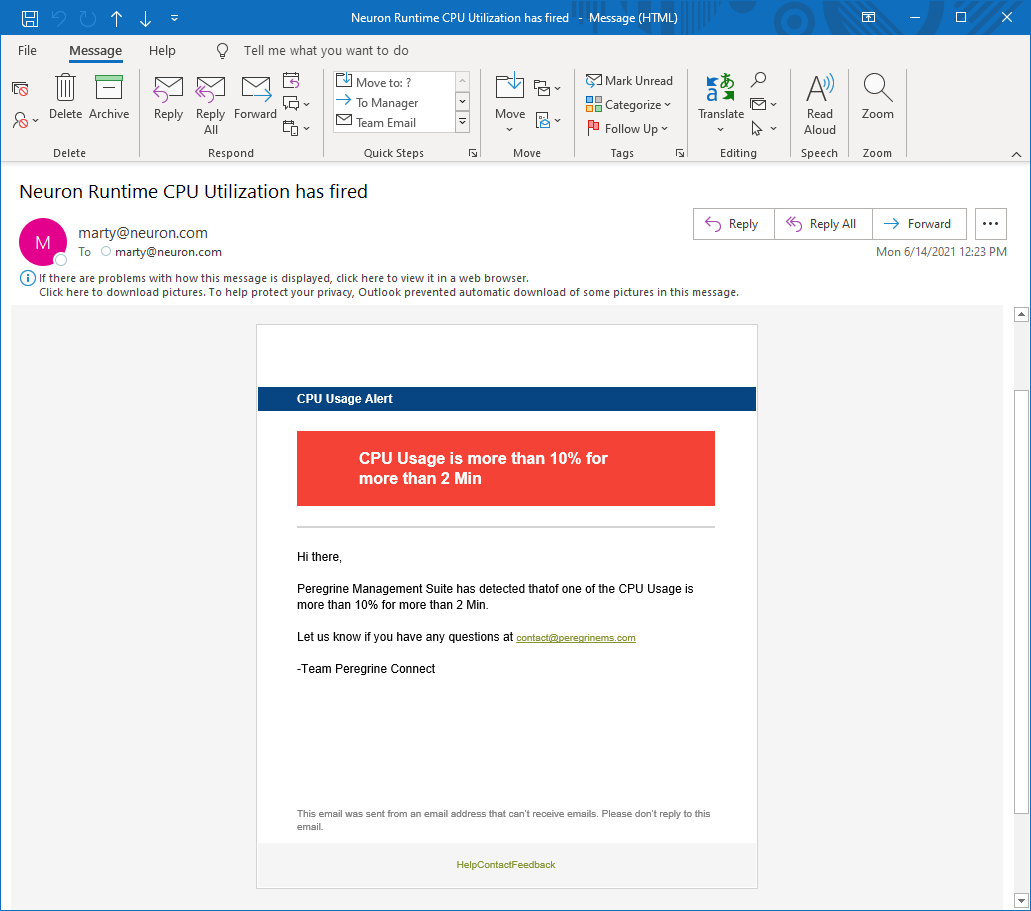
An example of a message using one of the built-in sample Templates is shown above. How it resolves and is received via email is shown below:
Subscribing to Alerts
Once the Alert Details and Message pages of the Wizard are populated, the final step is setting up the subscription for the current user. This is optional and can be done during the creation of the Alert Rule, or afterward. Once created, other users can subscribe to the rule providing that “Everyone” was selected on the Alert Details page, essentially making the Alert Rule public.
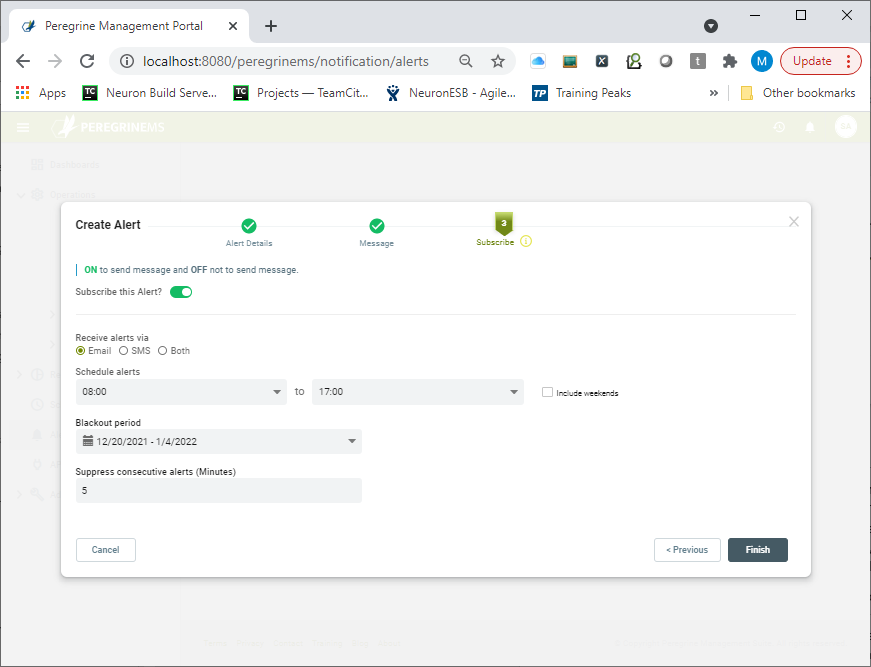
Within the Wizard, the user creating the alert can choose to automatically subscribe to it by providing the following optional conditions to the subscription:
- Receive the Notification by either Email, SMS Text Messaging or Both
- The daily Time Window to receive alerts and whether to include weekends
- Any Blackout period that the user should not receive alerts i.e. over a holiday
- Whether or not to suppress consecutive alerts defined in minutes.
Once the Alert Rule is created it will be displayed on the Alert Management page (shown below) where other users (providing it was made public) can optionally subscribe to the Alert. From here users can manage their own alerts and subscriptions.
Alert Reporting
Once Alert Rules have been created, Administrators (and others who have specific security rights) can view Alert Rule activation activity within the Alerts Reporting section of Peregrine Management Suite.
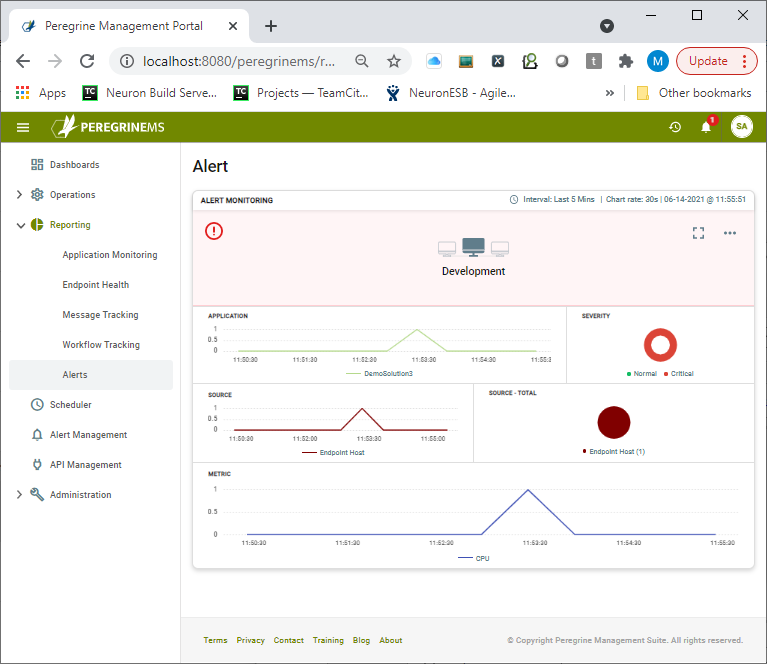
This section offers a similar experience to that of the Monitor page of the Operations menu. Organizations are presented with a bird’s eye summary Card view at the Environment level (shown above). Basically, a roll-up view of the Applications deployed. Each Environment is represented by a summary “Card”. Although each section is slightly different, the Cards display a graphical timeline of some of the following metrics.
- Application
- Severity
- Source
- Metric
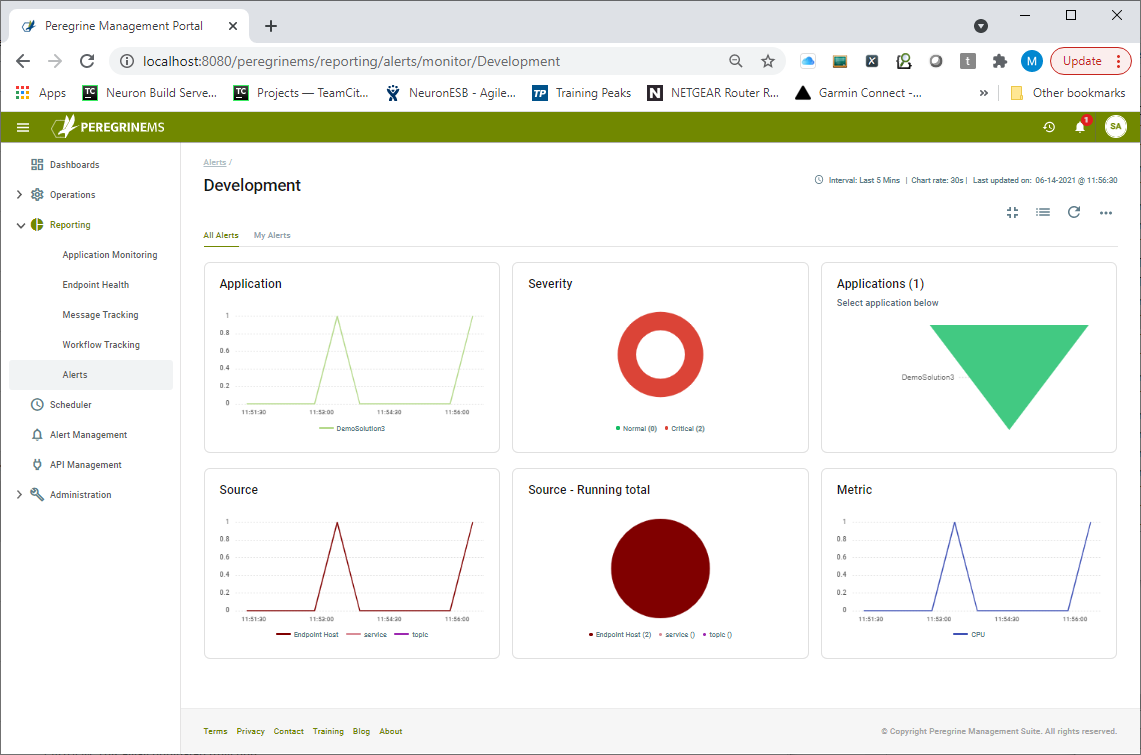
Any Card can be maximized to show a full-page view, providing even more detail and drill-down capabilities. The full-page view of the Alert Reporting section offers a detailed picture of all the Alert Rule activations across all Applications deployed to an organization’s environment. The image below shows the full-page view of the Alert Reporting section, displaying Alert Rule activations in a chart view. Alert activations are grouped by Application, Source, Severity, and Metric. Users can filter Alerts by application and/or their own subscription.
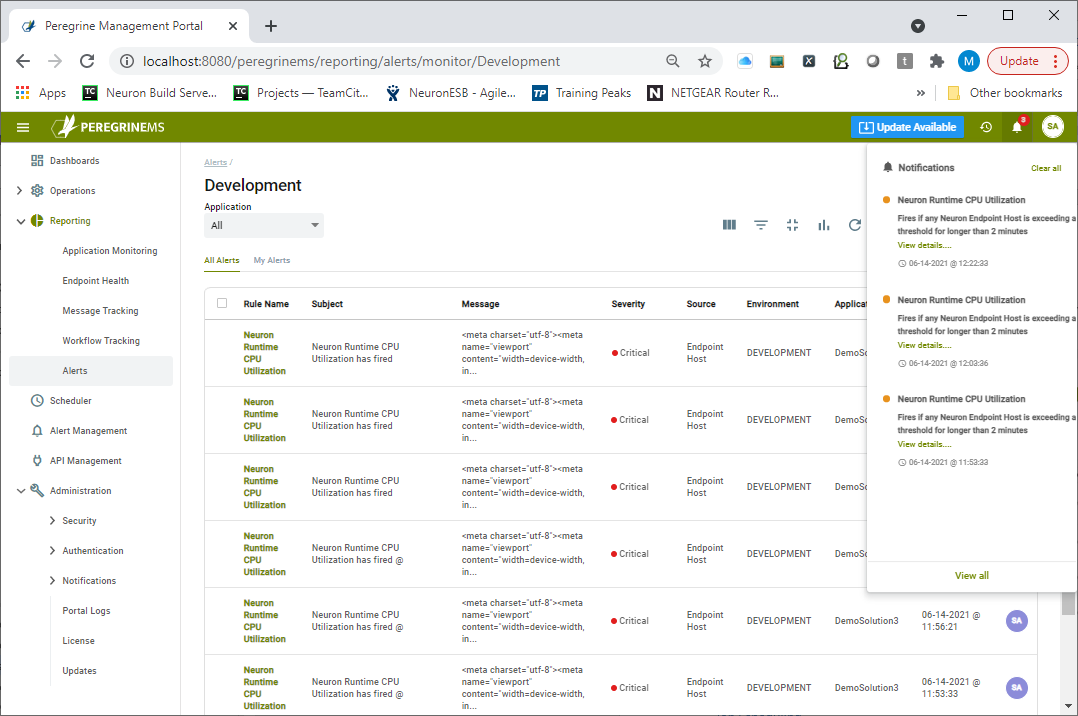
Users can also view Alert Rule activations as a list view which can be customized by add/remove columns or use a search on the list to find a specific alert. Alert notifications will also appear as new alarms on the top navigation bar as shown below. They provide a quick view of Alerts from any page that the user may be on when the Alert Rule is triggered.
Job Scheduling
An exciting new feature that ships with the Management Suite is the Job Scheduler. The Peregrine Management Suite Job Scheduler uses the Quartz job scheduling framework (https://www.quartz-scheduler.net/documentation/) that lets organizations schedule Neuron ESB Business Processes to be executed later, either just once or periodically. In the Job Scheduler, users can add new jobs, triggers, remove old ones, and can create complex schedules for executing any job. Examples are e.g. tasks that run daily, every other Friday at 7:30 p.m., or only on the last day of every month or year. When the Job Scheduler or its associated Neuron ESB runtime is stopped due to an unexpected event, it will store the jobs in a database, they will also survive Job Scheduler and runtime restarts and maintain their state. When the Job Scheduler is restarted, it will then run all the jobs it should have run while it was offline.
The Job Scheduler includes several features, including
- Support for Custom Jobs
- Scheduling any Business Process
- Reporting History
- Calendars
- Triggers
- CRON expressions
- Passing Messages and custom data to Jobs
Navigating to the Job Scheduler home page, organizations can get a summary view of all the Jobs scheduled for their Environments, each displayed in a Card view as shown below. The Job Card view provides a summary of recent jobs on a calendar. The top row shows the status of the Scheduler service and provides a button to start/stop the scheduler service.
The second row shows the calendar on the left and a list of recently executed/executing/failed or canceled jobs for the selected date to the right of it. Users can start adding new jobs and triggers from the buttons in the last row of this view.
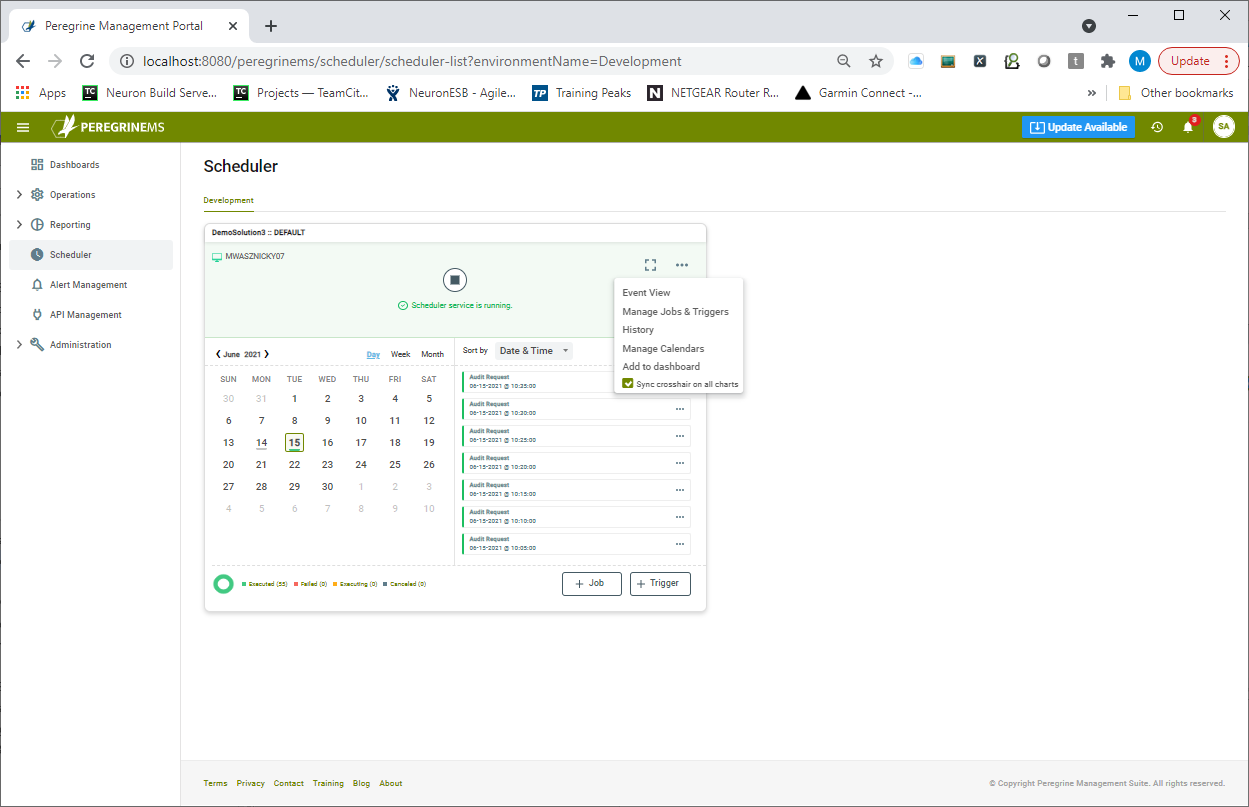
From the card view, users have access to a variety of functions including:
- Stop/Start the Scheduler Runtime
- Creating a Job
- Creating a Trigger
- Navigating to the Event View
- Managing existing Jobs and Triggers
- Viewing the Job History
- Managing Calendars
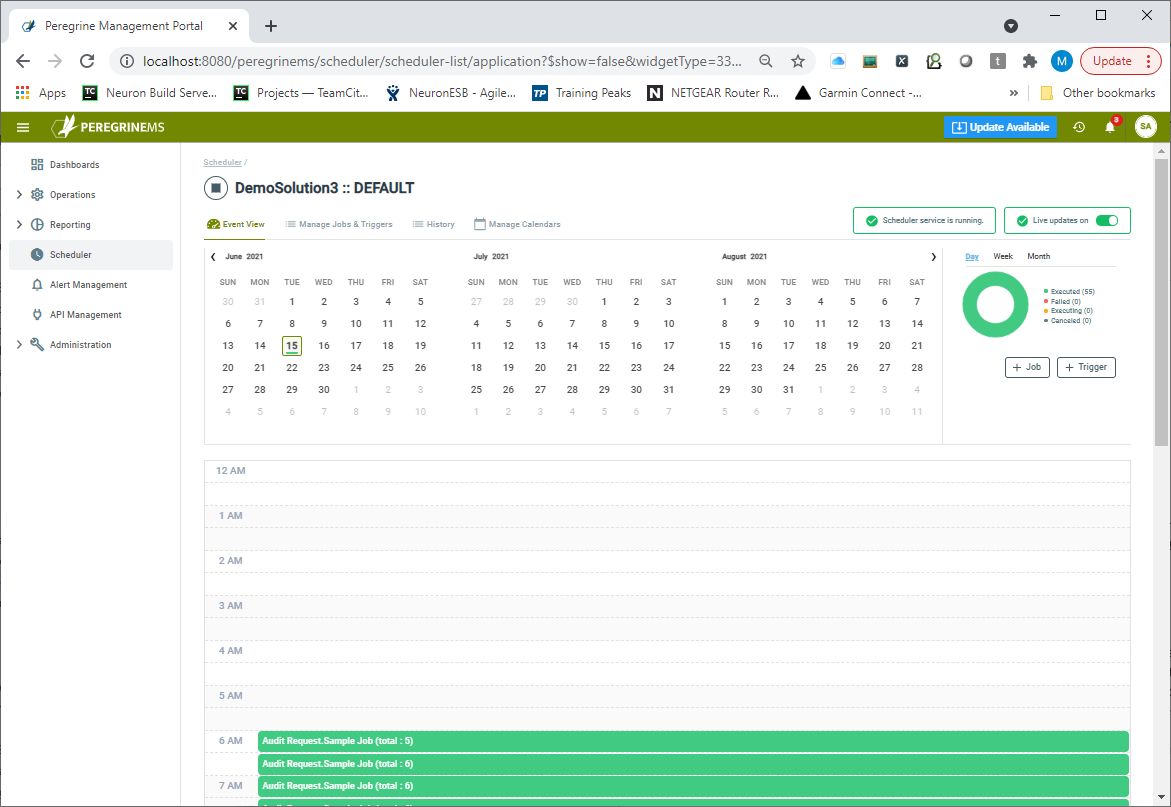
The Card View can be expanded to the Event View depicted below by clicking the expansion button. The Job event view provides an intuitive calendar-like interface to show the scheduled and executed jobs. Using this page, users can navigate to the Job definition, history, Triggers, and Calendars. Users can toggle between Event View and a list view (Manage Jobs and Triggers tab). Manage Jobs and Triggers provides more details in tabular format and is searchable.
The Event View shows a three-month calendar with running/recently completed/canceled/failed jobs on the calendar as well as in a pie chart in the right-hand top corner. There are two buttons below to create a new Job or a new Trigger for an existing Job.
On the top of Event View on the right-hand side, you can see if the scheduler service is running or not and whether or not the page keeps refreshing with the latest data (live updates are on). The Management Suite will prompt users to turn off live updates when editing so as to pause page refreshes.
Terminology
The Peregrine Management Suite Job Scheduler is a powerful feature that organizations can use to schedule almost any task within the enterprise. For example, a Neuron ESB Business Process can be created to sync several different systems. The Job Scheduler in turn can be used to execute that process each day, week or month at a specified time or interval. To use the Scheduler, it is important to understand some base concepts.
Jobs
The most important concept is the Job. Jobs can be of two types. Either a Neuron ESB Business process that is scheduled to run as a batch job or, a custom assembly that implements the IPeregrineJob interface. Users can accomplish most tasks by using a Neuron ESB Business Process. However, a custom assembly can be used if additional references are required that are not included in the Neuron ESB Business Process or an organization wants the freedom to implement their own custom logic using a solution developed with Visual Studio. The IPeregrineJob interface is built on .NET Core.
Business Process scheduled as Job
When a Business Process Job type is selected, a list of Neuron ESB Business Processes in the currently selected application appears under Neuron Entity. A business process can be selected to be run according to a Calendar and Trigger. For each job, a user may select an existing one or add a new Calendar and Trigger. With a combination of Calendar and Trigger, users can control exactly what day and times the jobs will run.
Users can create a .NET Core application library (DLL) containing a type that implements the IPeregrine job interface. Refer to included samples for an example. At the time of deployment, copy the DLL into the Neuron ESB Instance folder under the Peregrine Jobs sub-folder.
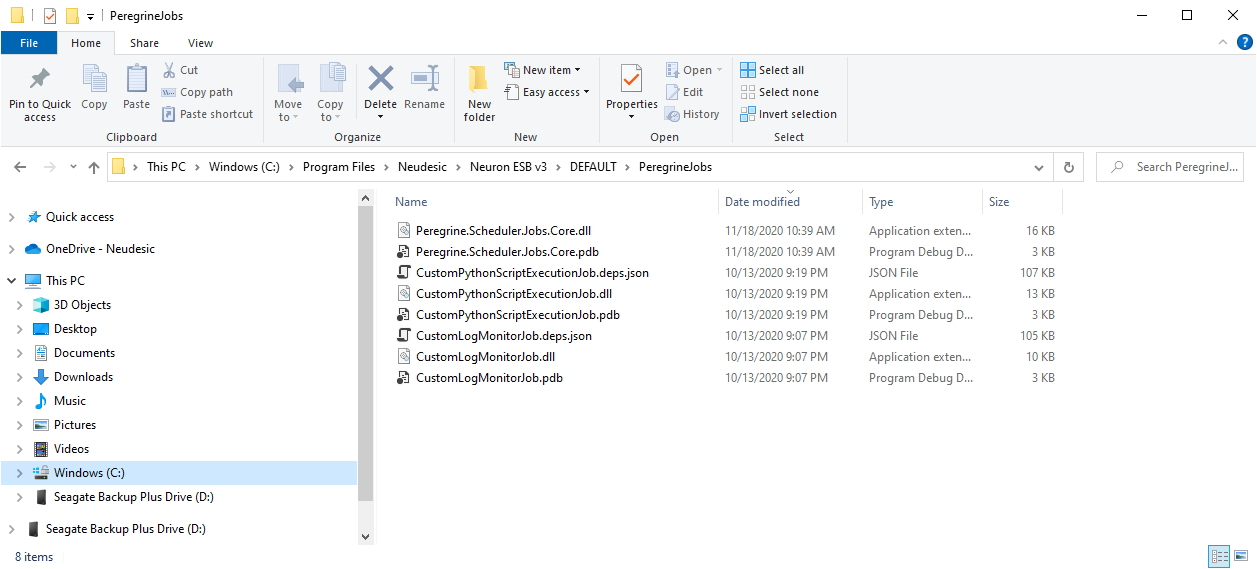
When this assembly is present it will appear as a job type in the dropdown box for the create job screen.
Triggers
Triggers are used to trigger the execution (or ‘firing’) of Jobs. When a user needs to schedule a Job, a Trigger is created, and its properties set to provide the scheduling required. Triggers may also have a JobDataMap associated with them – this is useful to passing parameters to a Job that are specific to the firings of the Trigger. The Job Scheduler supports two different Trigger types, Custom or Cron Expression.
Custom
A Custom Trigger is handy if you need ‘one-shot’ execution (just single execution of a job at a given moment in time), or if you need to fire a job at a given time and have it repeat N times, with a delay of T between executions. Users can select Repeats – Daily, Weekly, Monthly, or Yearly and specify the count of every how many days, months, weeks, or years it occurs.
A Cron Expression is useful if a user needs to have triggering based on calendar-like schedules – such as “every Friday, at noon” or “at 10:15 on the 10th day of every month”. When a Cron Expression is selected, users are provided a link to the cronmaker web page to create a Cron Expression that meets their needs. https://Cronmaker.com
Jobs and Triggers
Jobs can be created and stored in the Job Scheduler independent of a Trigger, and many Triggers can be associated with the same Job. Another benefit of this loose-coupling is the ability to configure Jobs that remain in the Scheduler after their associated Triggers have expired, so that that they can be rescheduled later, without having to re-define it. It also allows users to modify or replace a Trigger without having to re-define its associated Job.
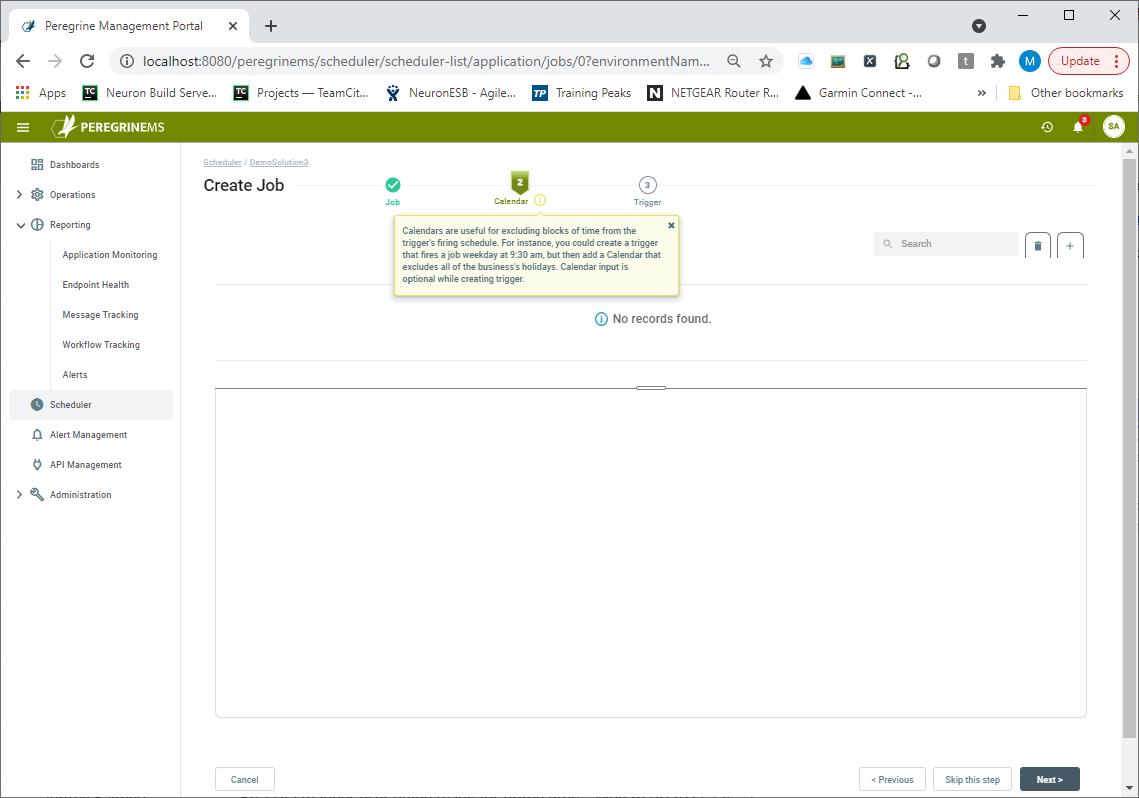
Calendars
A structure defining days to exclude or include when firing the trigger associated with the job. Calendars are useful for excluding blocks of time from the Trigger’s firing schedule. For instance, a user could create a trigger that fires a job every weekday at 9:30 AM, but then add a Calendar that excludes all the business’s holidays. Most likely, users will be interested in ‘blocking out’ entire days.
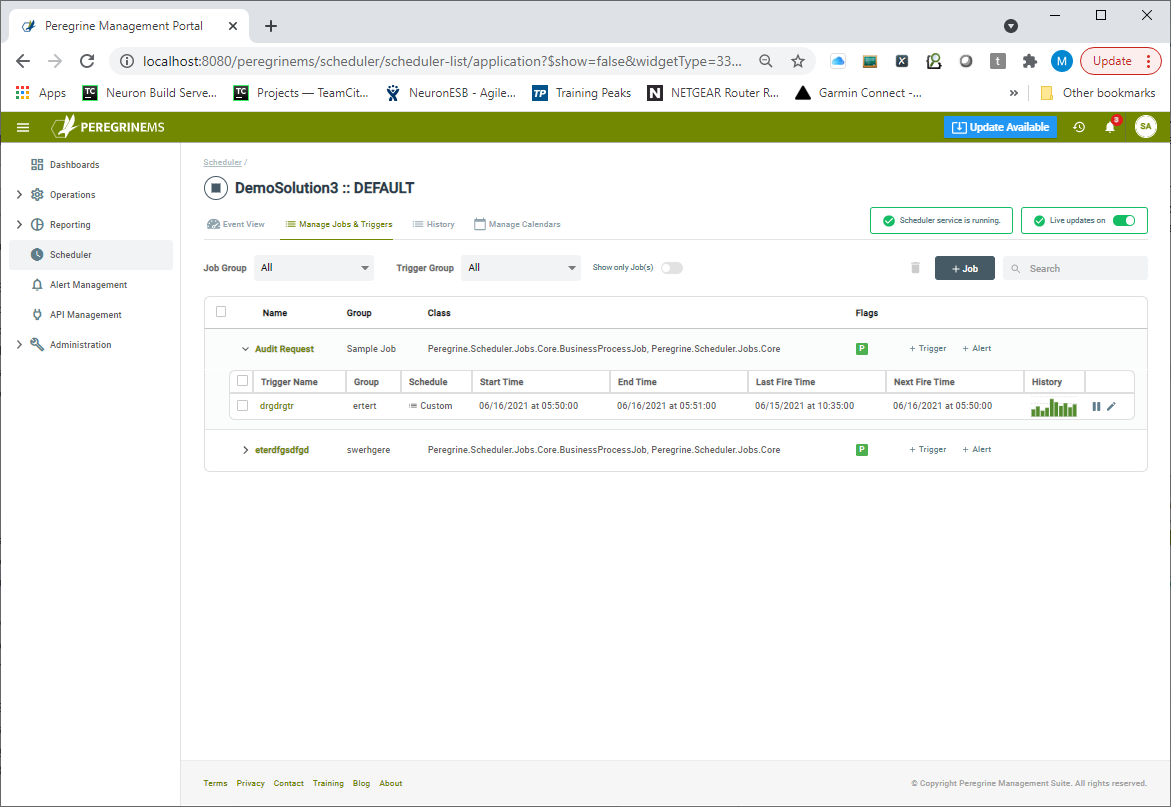
Manage Jobs and Triggers
When the Manage Jobs and Triggers tab is selected, users can see a list of the jobs and their associated Triggers. From here, Jobs and Triggers can be edited, and users are presented with a mini-view of the Job execution history in chart format. Users can also Pause and Resume Triggers from this view.
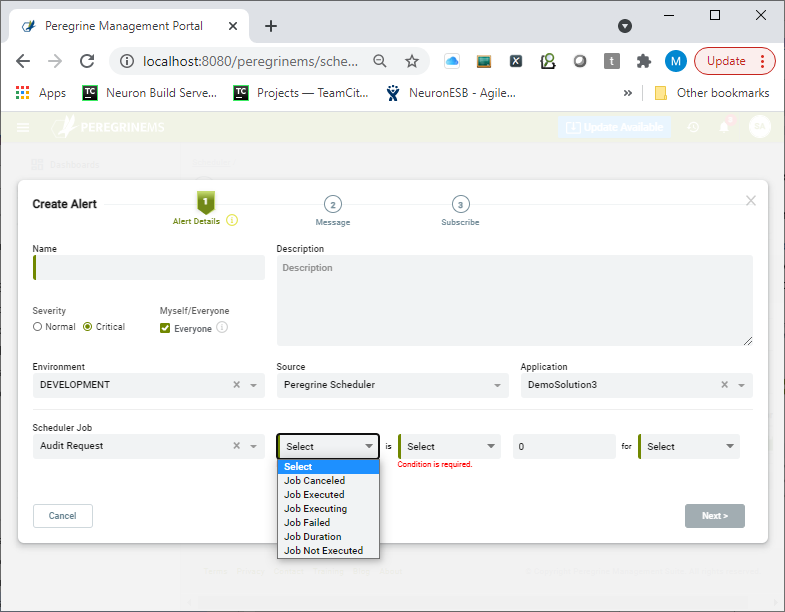
Alerts
Another useful feature is exposed here as well. The ability to create an Alert for a Job. Clicking on the “+ Alert” link launches the Alert creation wizard displayed below. Users can set up alerts on counts of Job Executed, Job Cancelled, Job Failed, Job Executing. Users can also set up alerts for the Job Duration and duration of Job Not Executed.
History
The History tab provides a detailed view of the execution history, including Trigger firings, Job executions, and log entries. Here, users can view each execution of the job, its status, result, the input and out messages as well as any modified Job Data that was modified by the Job. Additionally, users can also inspect all log entries made by the executing Job.
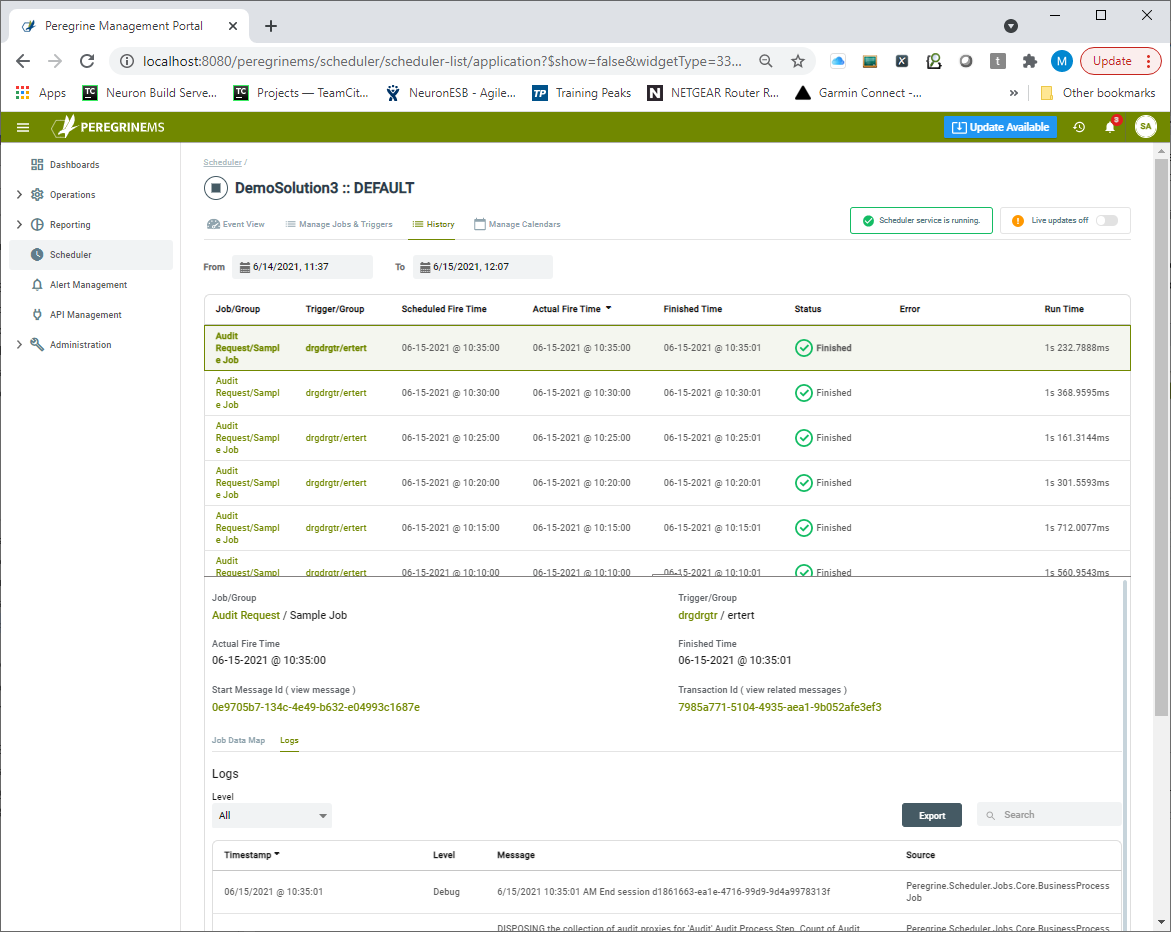
By clicking on either the Start Message-Id or Transaction ID field, the user will be navigated to the Message History module where those selected messages will be displayed and can be examined by the user.
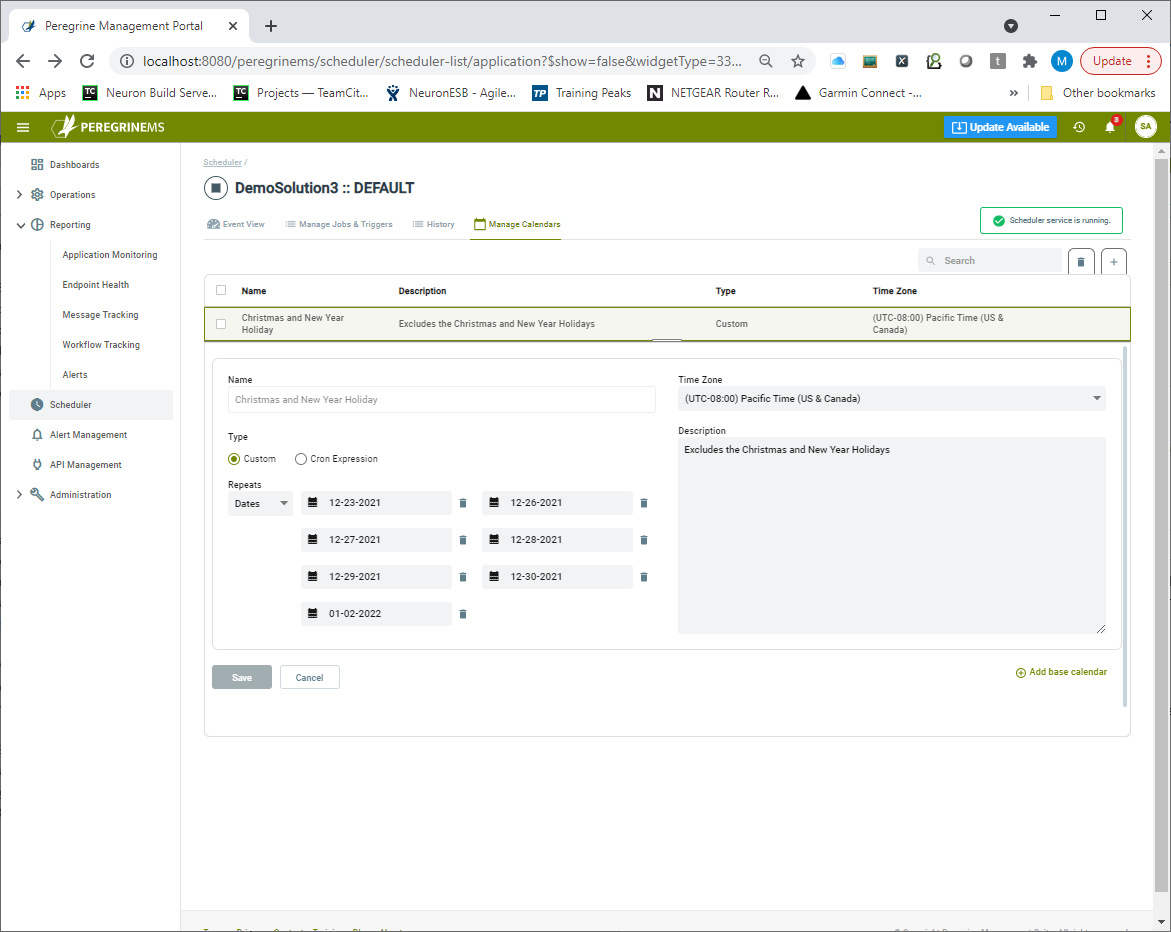
Manage Calendars
The Peregrine Management Suite Job Scheduler is based on the Quartz job scheduling system. A unique feature of Quartz job scheduling is the number of different ways you can customize Calendars to specify exactly when a job should or should not execute. Using this view, users can create or edit Calendars. Each Calendar can be chained to any number of base Calendars and have many of the same options as Triggers.
Creating a Job
Creating a Job, Trigger and Calendar can all be done through an interactive wizard available which can be launched from either the Summary Card page, the Events View, or the Manage Jobs and Triggers tab. Clicking on the add Job button (e.g. “+ Job”) will launch the first page of the wizard. Users have the ability to edit each part independently with the same interface after a Job is initially created from the Manage Jobs and Triggers screen. Users can also independently add Triggers to existing Jobs. A Job definition has three steps. The Job definition itself, an association of a calendar to the Job (an optional step), and creating a Trigger for the Job. The first page of the wizard displays the Job definition as shown below.
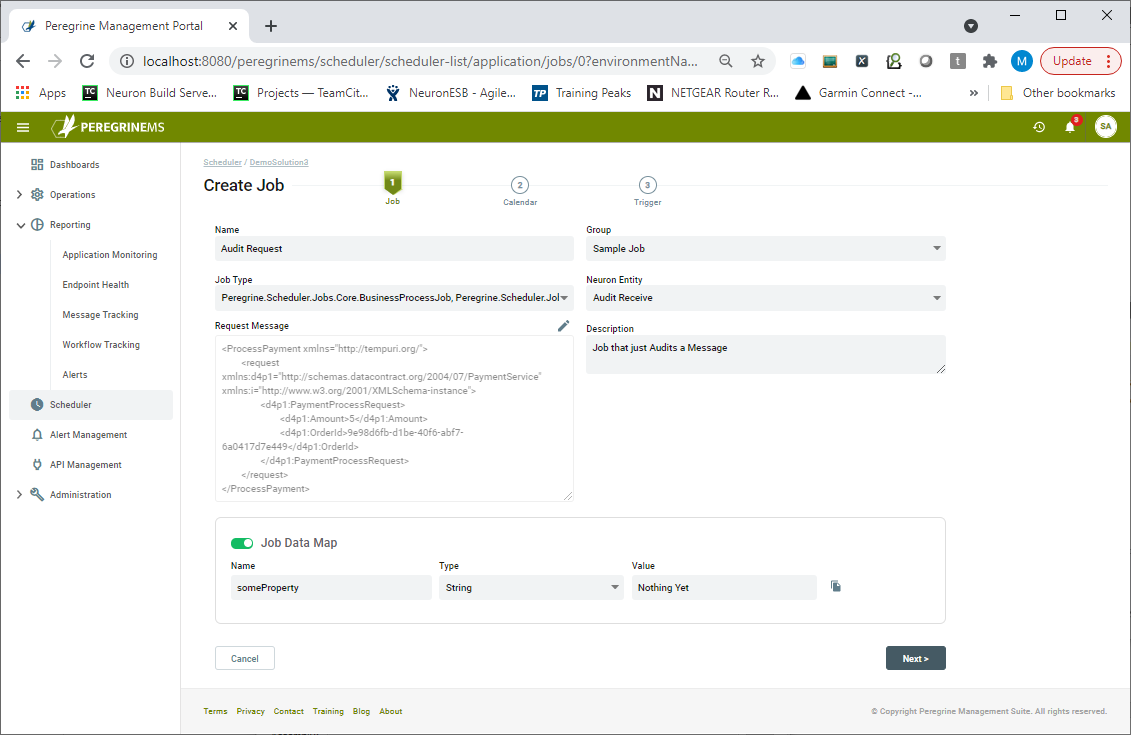
Users can add a request message that kicks the Job off. This would be passed to the Business Process in the form of an ESB Message. A Job Data Map can also be created. Essentially this is a serializable dictionary of variables initialized with values. These can be used to pass parameters such as URLs, UNC Paths, Connection Strings, API Keys, etc. Each data map entry consists of the Name, data type, and value for that entry. At runtime, the Business Process is passed both the request message as well as the dictionary of values. These can both be modified and returned by the Business Process so that the new values can be used the next time the Job executes.
For instance, a user may create a Business Process that syncs one system to another at specified intervals. However, after the Job fires, it can update a value in the Job Data Map with the ID or Datetime stamp of the last record updated. This way, the next time the Job fires it will know what record to start with.
The next step in creating a Job is assigning a Calendar to the Job from the existing Calendars created as per the section on Manage Calendars. Assigning a Calendar is optional though. If there are none, a user can create one by clicking on the “+” button at the top right as shown below.
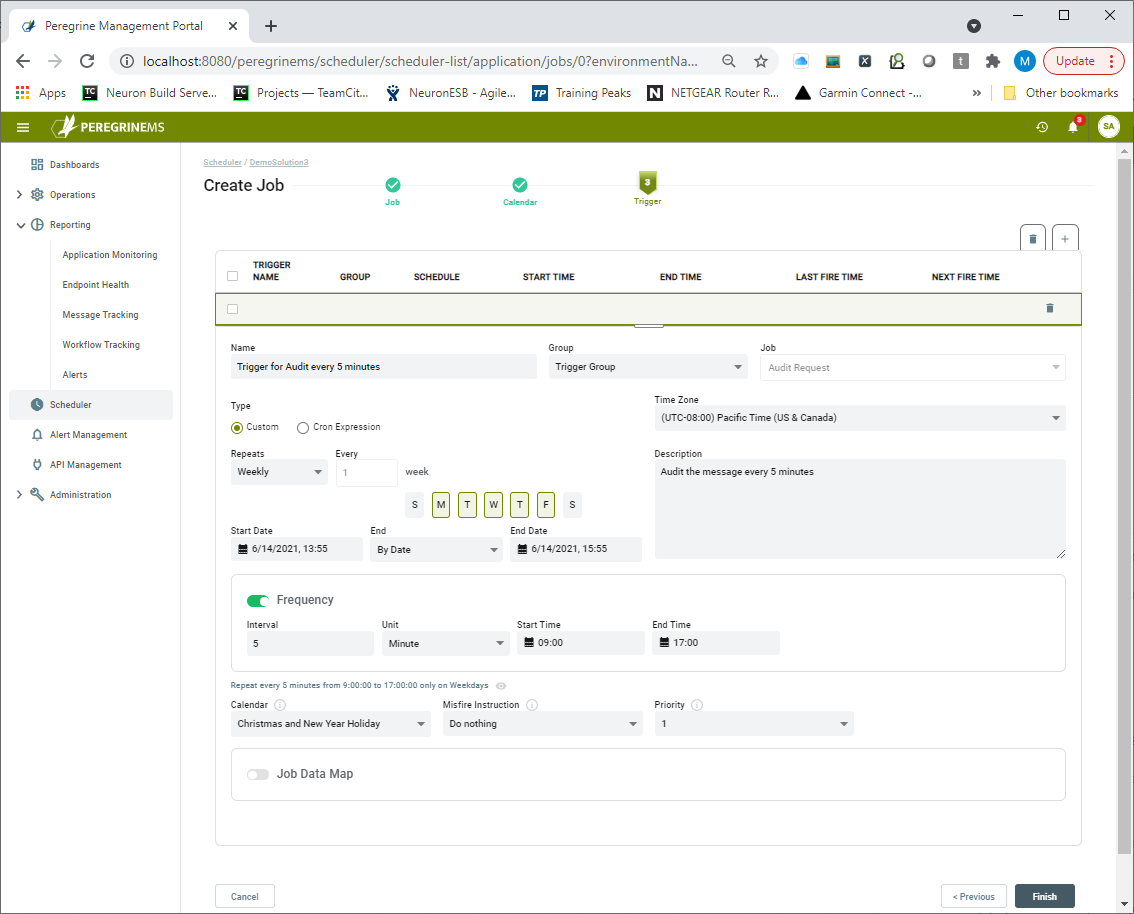
Lastly, the Trigger needs to be created here, or later on the Manage Jobs and Triggers page. This page of the Wizard lets a user specify all aspects of a Trigger including its Type, Frequency, Start and End Dates, Calendars, and whether there’s a Job Data Map at the Trigger level.
API Management
The Peregrine Connect Management Suite API Management feature allows organizations to provide Token-based authentication for Neuron ESB hosted service endpoint URLs (i.e. Client Connectors). Using the new features of Neuron ESB 3.7.5 and Peregrine Connect’s API Management, it is possible to secure Client Connectors with OpenId Connect and OAuth. The advantage of this identity and authorization mechanism is that it is an open standard and therefore Client Connectors secured using OAuth can be called securely across the internet and within an organization. This mechanism doesn’t rely on an organization’s Active Directory or any other internal LDAP directory.
Although the Management Suite ships with its own security provider, it does allow organizations the flexibility to use Microsoft Azure Active Directory as well as other compliant Open ID Connect and OAuth security providers (e.g. Google, Thinkatecture, etc.) in addition to our own default security provider, without sacrificing capabilities. Those extensions can be configured by selecting the OAuth Settings menu within the Administration section of the Management Suite.
Peregrine Connect makes it easy to treat internal and external users with the same security mechanisms. The entire process of setting up and configuring this security is made highly interactive and intuitive with the Management Suite and allowing organizations to use the best security without needing a Ph.D. in cryptography and security
How OAuth works with Client Connectors
There are multiple different flows for using OAuth between web applications. In Neuron ESB Client Connectors that use OAuth, the Client Credentials flow is generally implemented.
What is Client Credentials flow?
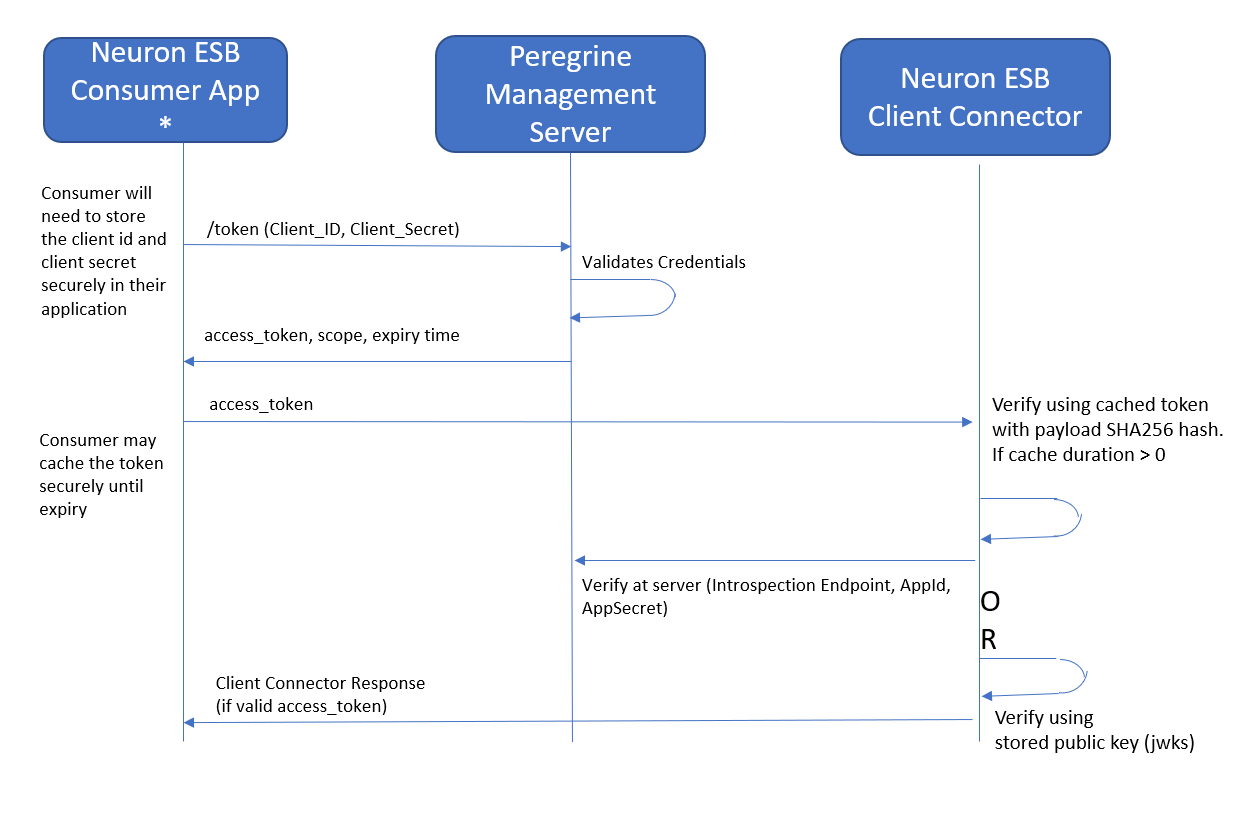
With machine-to-machine (M2M) applications, such as CLIs, daemons, or services running on your back end, the system authenticates and authorizes the app rather than a user. For this scenario, typical authentication schemes like username + password or social logins don’t make sense. Instead, M2M apps use the Client Credentials Flow (defined in OAuth 2.0 RFC 6749, section 4.4), in which they pass along their Client ID and Client Secret to authenticate themselves and obtain a token. M2M applications then use that token to get access to the backend API resource. The following diagram shows the sequence of events when accessing a Neuron ESB Client Connector using OAuth:
Other flows like hybrid and PKCE are also supported by Peregrine Connect’s API Management. These flows are used when the consumer of Neuron ESB Client Connector (a user-facing web application) is requesting consent from an individual user for authorization and user information.
Ultimately, it is the consumer application’s responsibility to properly code for getting and safeguarding the access token.
Securing Client Connectors
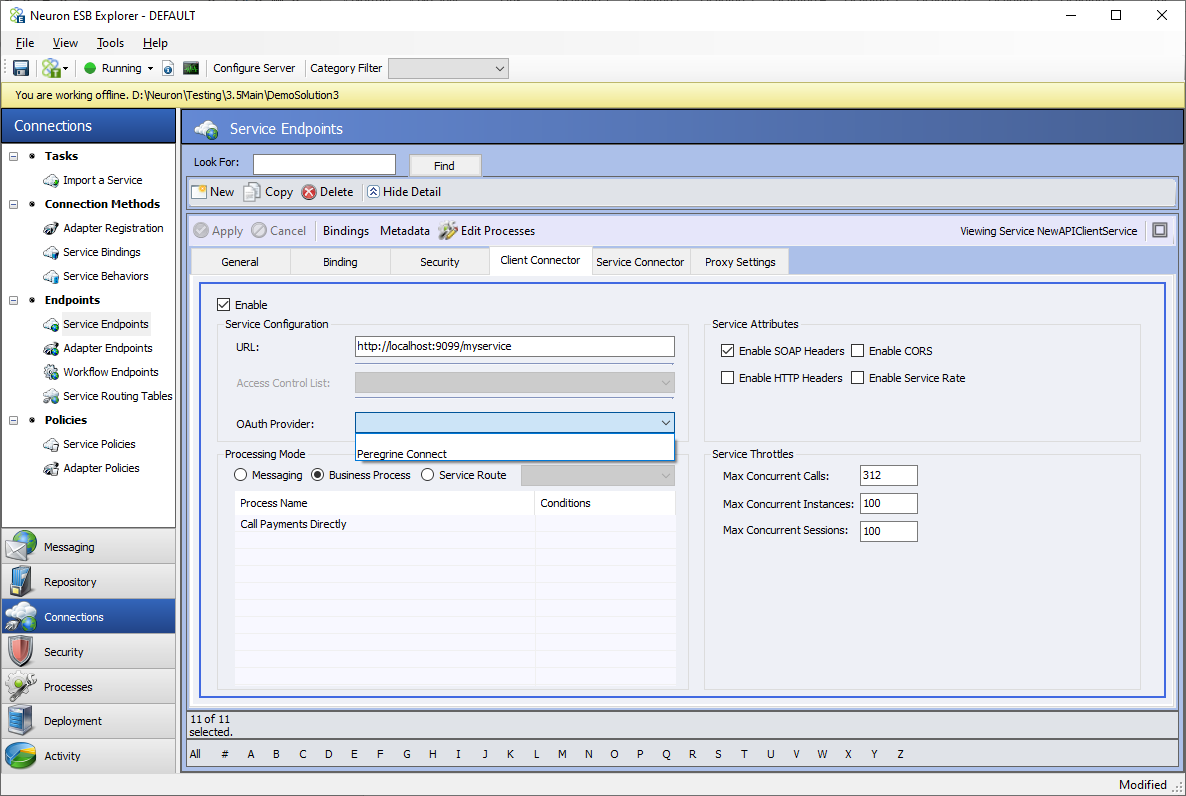
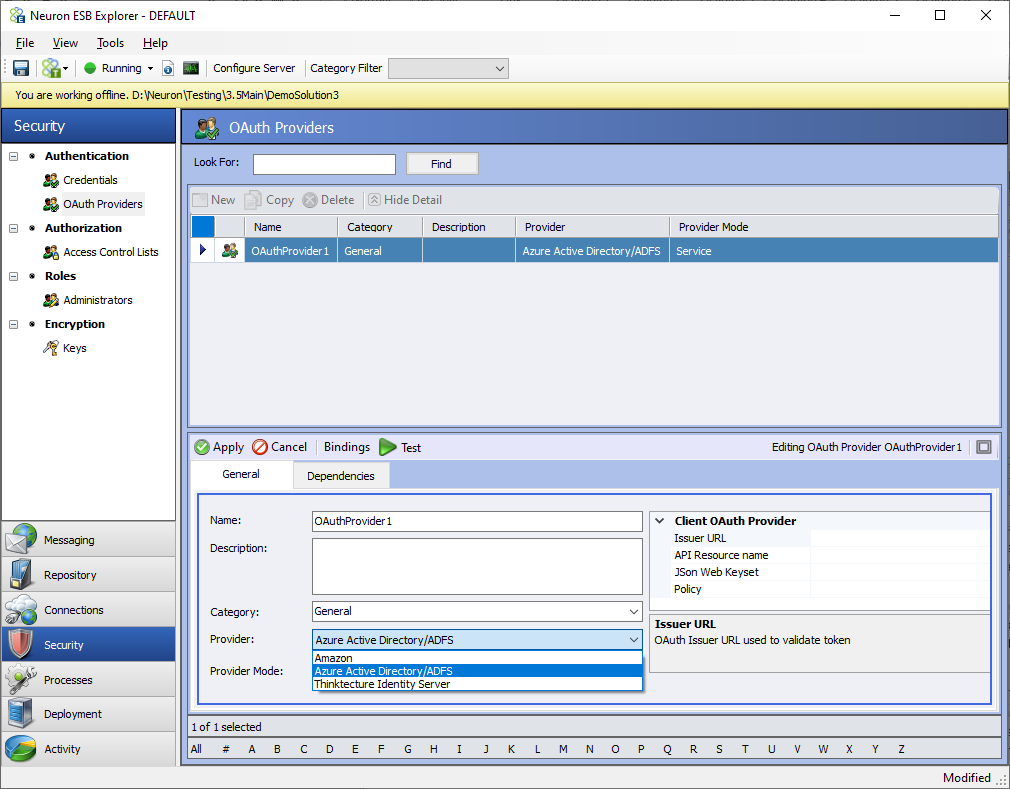
Neuron ESB Client Connectors can be configured to use the Token-based authentication offered by the API Management module when they are configured to use the REST binding and have their Security Model set to “None” or “Transport: None”. Once configured, the “Peregrine Connect” option will appear in the “OAuth Provider” drop-down box located on the Client Connector tab of the Service Endpoint as depicted below:
When “Peregrine Connect” is selected, the Client Connector will be able to be configured as an API Resource within the Peregrine Connect API Management module. However, there are several options for securing a Neuron ESB Client Connector. Besides using the Peregrine Connect API Management module, organizations can also use Microsoft Azure Active Directory, Amazon, Auth0, Okta, or Thinktecture Identity Server OAuth providers. Neuron ESB version 3.7.5 ships with three additional client-side OAuth providers: Azure, AWS, and Thinktecture as shown below. The Thinktecture provider will work with an on-premises implementation of the Thinktecture Identity server as well as most other identity providers such as Auth0 and Okta.
When configured this way, a calling application or user will have to obtain and attach a token to the request that is sent to the configured Neuron ESB Client Connector. This token will be validated at runtime by the Neuron ESB platform to allow or deny requests depending on the values of the Scope item in it. The content of the token can be used to further control what functionality of the Client Connector or its associated Business Process is available to which consumer application using Scopes.
Configuring an API Resource
To get started with API Management, organizations must create at least one API resource per Neuron ESB Application (solution) and include the Client Connectors in that application under that API resource. API Resources are defined as a group of Client Connectors that share the same values for Scope.
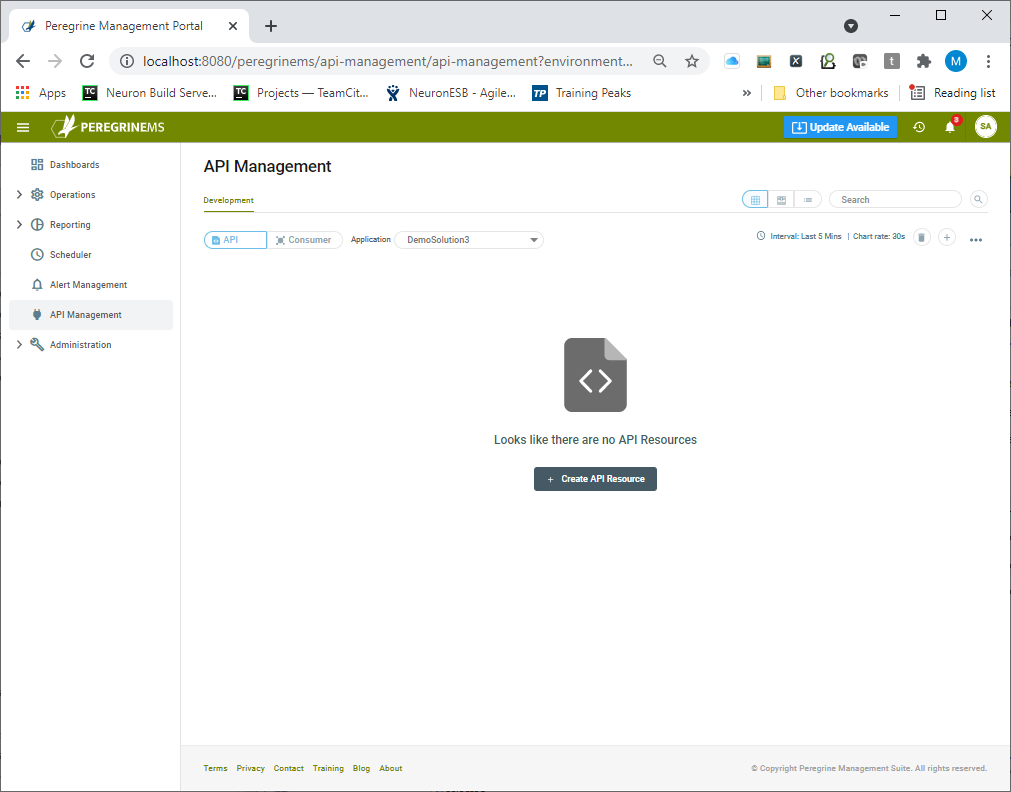
API resources can be created using the menu option within the API Management module. Select the API button on the top bar and the desired Neuron ESB Application in the application dropdown. Then click the + icon in the top right corner to launch the Create API wizard. Users have the option to switch between card view and list view by selecting the appropriate option to the left of the search. Alternatively, when no API Resources exist, a blank API Management home page is presented as shown below. Clicking the “Create API Resource” button will launch the Create API wizard.
The wizard is designed to step a user through the process of setting up an API resource. A user needs to add one or more Client Connectors, Scopes, and Consumers to the API resource. If Consumers don’t already exist, they can be added later.
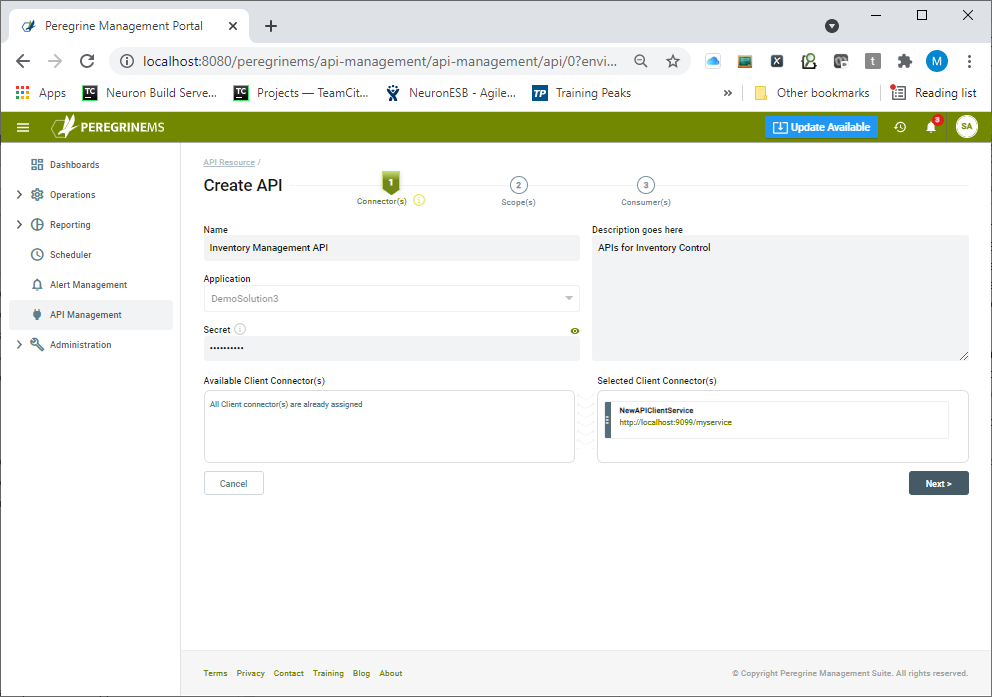
On the first page of the wizard, the API Name, description, and the API secret are entered. The API secret is used internally by Neuron ESB to validate the tokens presented to it. Client Connectors included in the API Resource can be dragged from the list of available Client Connectors to the Selected Client Connectors section located on the right.
Defining Scopes
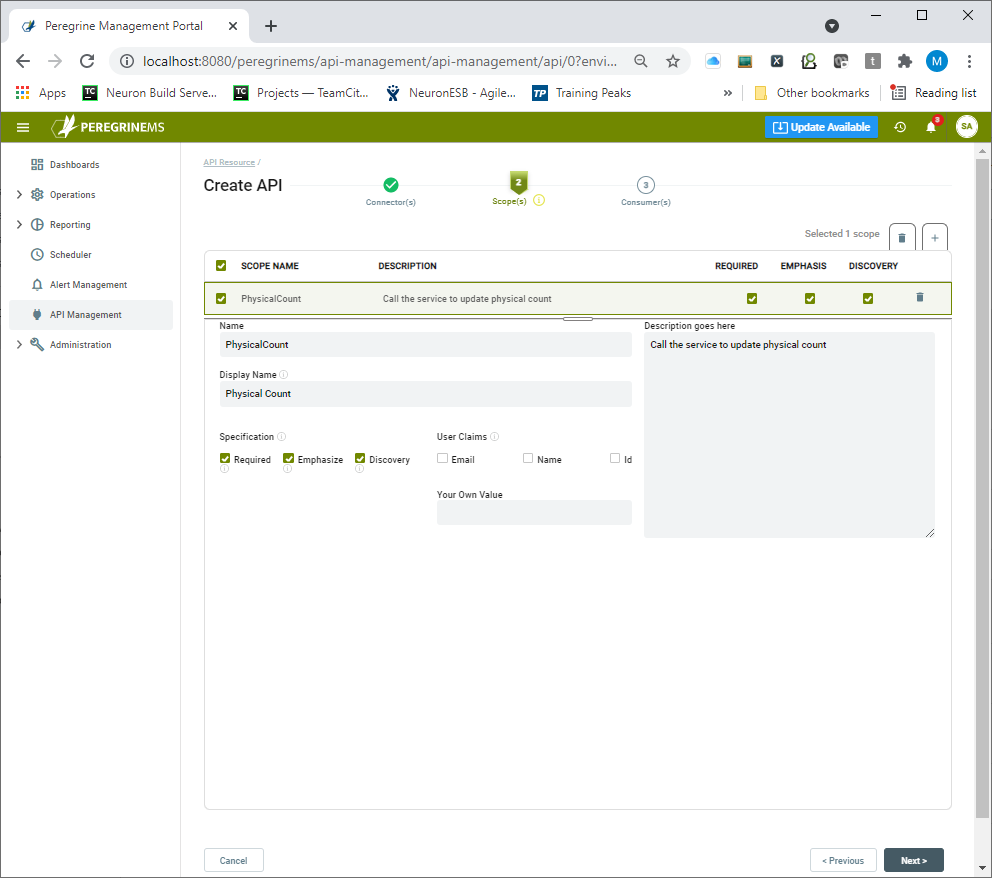
One or more Scopes for the API Resource can be created on the second page of the wizard. Scopes indicate the subject areas by which an organization may want to control access. For example, if a user wants to control read/write access, a read-only scope, write-only scope, and read-write scope may be created.
Choose a scope Name, Display Name, and Description that make sense in the context of the business use case. The checkboxes for Required, Emphasize, Discovery indicate whether the scope is a required value in the token, whether it should be emphasized when prompting the user for permission and whether the scope should appear in the discovery document for the identity server.
User claims are applicable when the consumer grant type is Hybrid or PKCE. This indicates that the token presented by the consumer application user will make the email, name, or id information available to the Neuron ESB Client Connector. A custom value for User Claims can also be entered. This value will then be included in all the user tokens issued.
Creating Consumer Applications
Existing consumers may be assigned to the API resource on the final page of the wizard as displayed below.
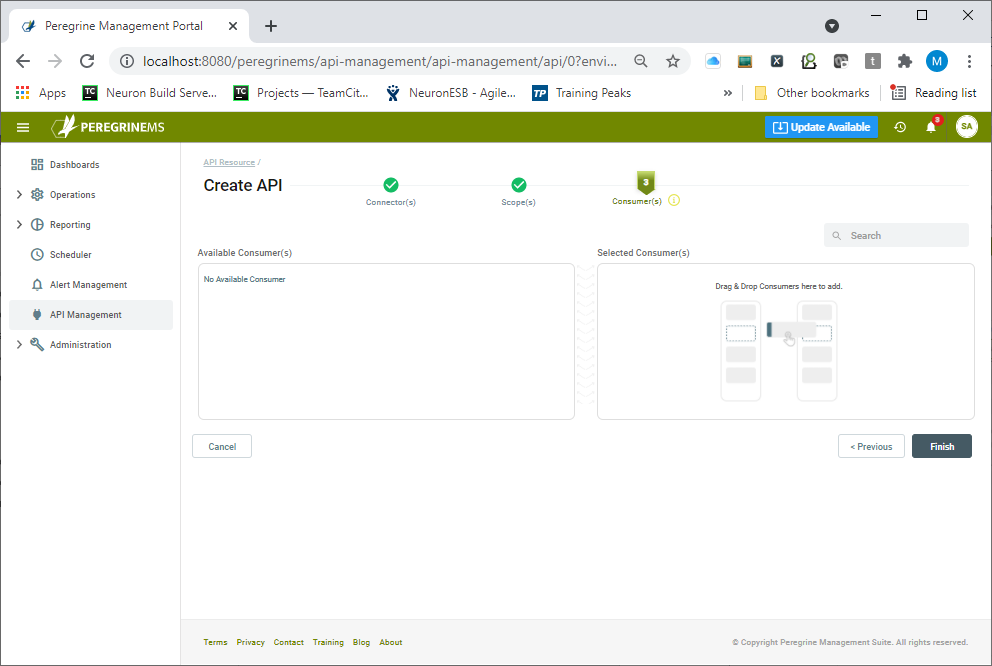
If consumers haven’t been created yet, the finish button can be clicked, and consumers can be assigned later after they have been created. Once the API Resource is added it is displayed in a card view format shown below. Alternate views of API Management (List view and Carousel view) show the same data in a more expanded format.
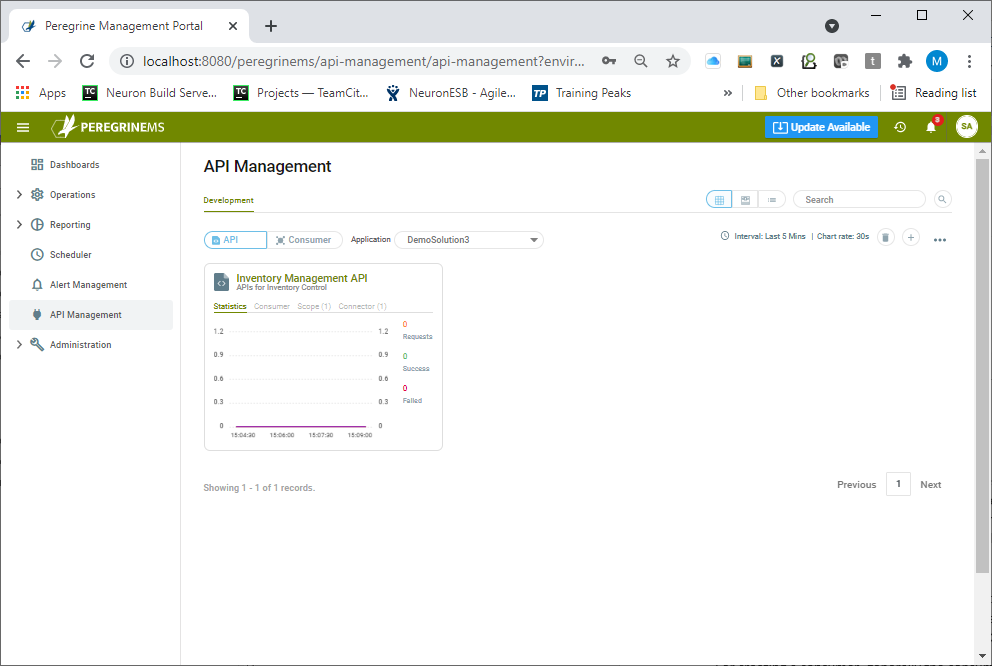
Consumers can be easily added by clicking the Consumer tab and then either clicking the “+” sign or the “Create Consumer” button. This will display the Consumer form.
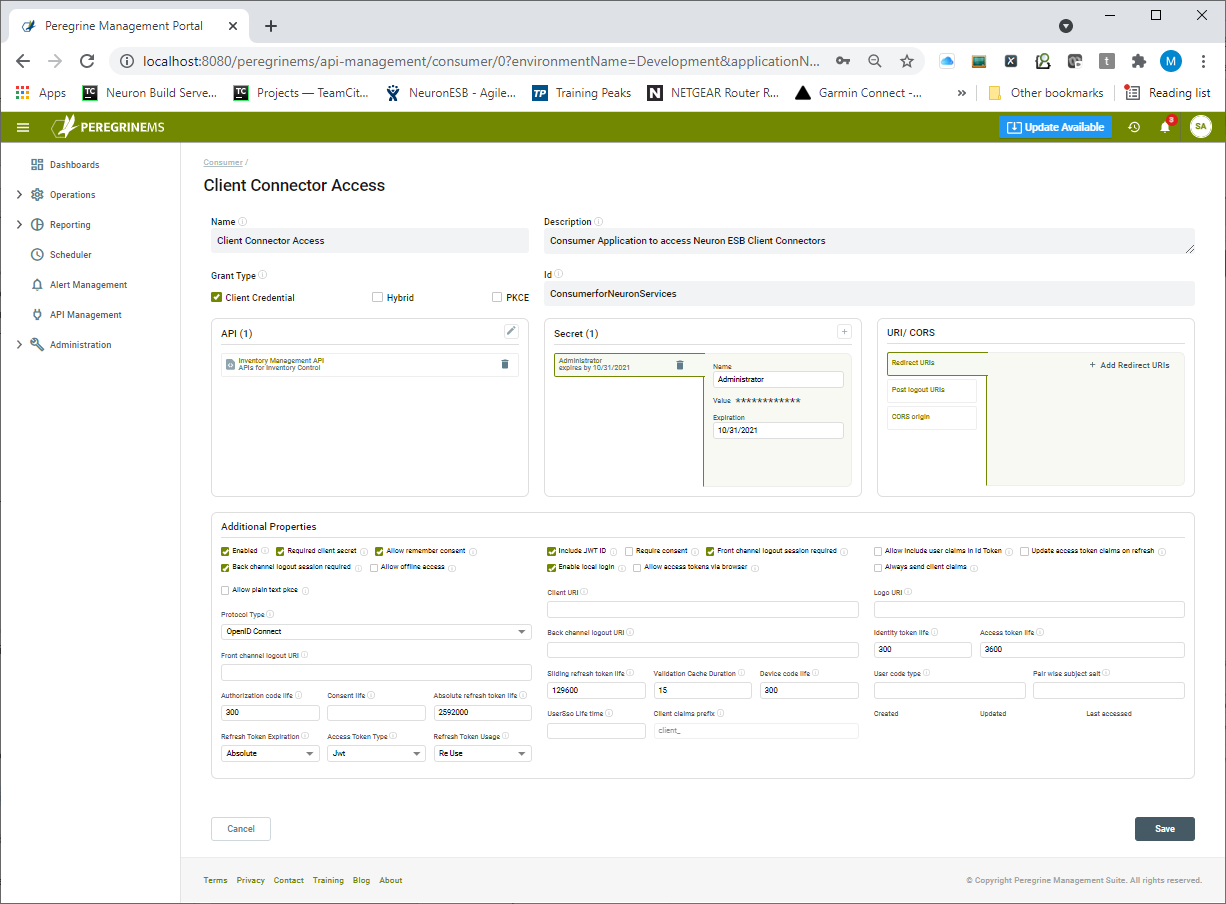
A Consumer application can be a native, mobile, or web application that needs to communicate with a Neuron ESB Client Connector. Consumer applications can have different grant types. For a Consumer application that has a backend server like ASP.NET, the grant type Client Credential is most common. If specific user information needs to be passed with the token, then a grant type of Hybrid or PKCE is more appropriate.
For creating a consumer, generally, the consumer name, description, id, API resource, and Consumer secret needs to be added. The API to which Consumers can have access can be added from the API box below by clicking the plus sign. Similarly, Consumer secrets can also be added. Note that you can assign Consumers to API from the API screen.
Additional properties and URIs/CORS are applicable with Hybrid or PKCE grant type.
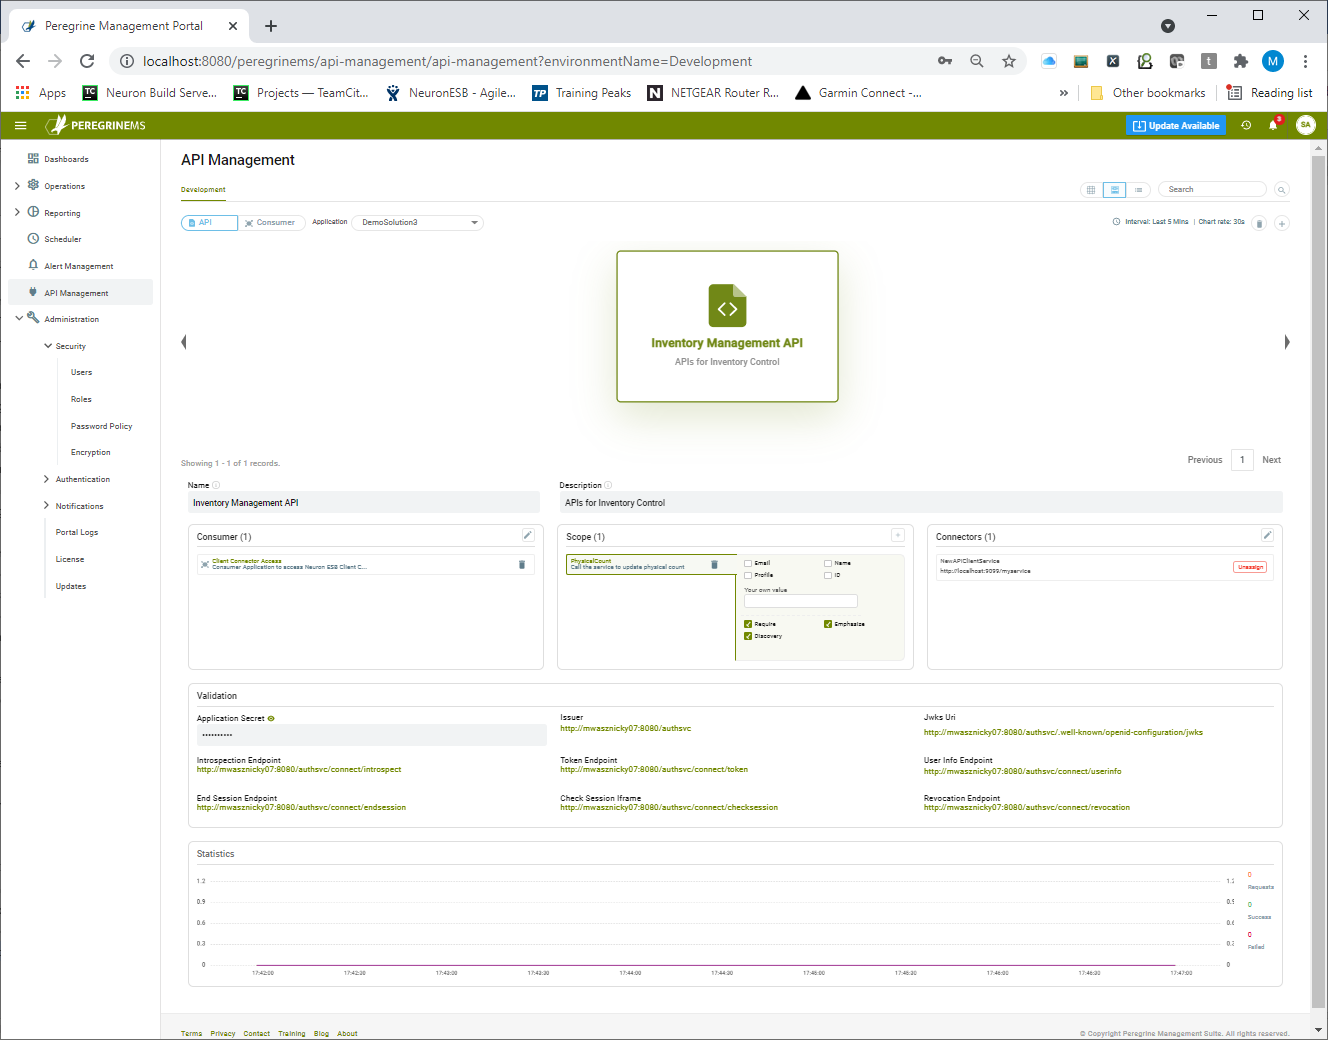
API Monitoring
The Peregrine Connect Management Suite API management adds a nice capability to monitor the number of requests, successes, and failures by API or Consumer. In addition to the overall application monitoring that the Management Suite provides for Client Connectors, this capability provides a window into how individual consumer applications and API resources are utilized and whether they are running successfully or not. By default, the Statistics tab is visible in the Card view (visible in Figure 69) of either the API Resource or Consumer. An expanded chart can be viewed by switching to either the List view or Carousel view as shown below:
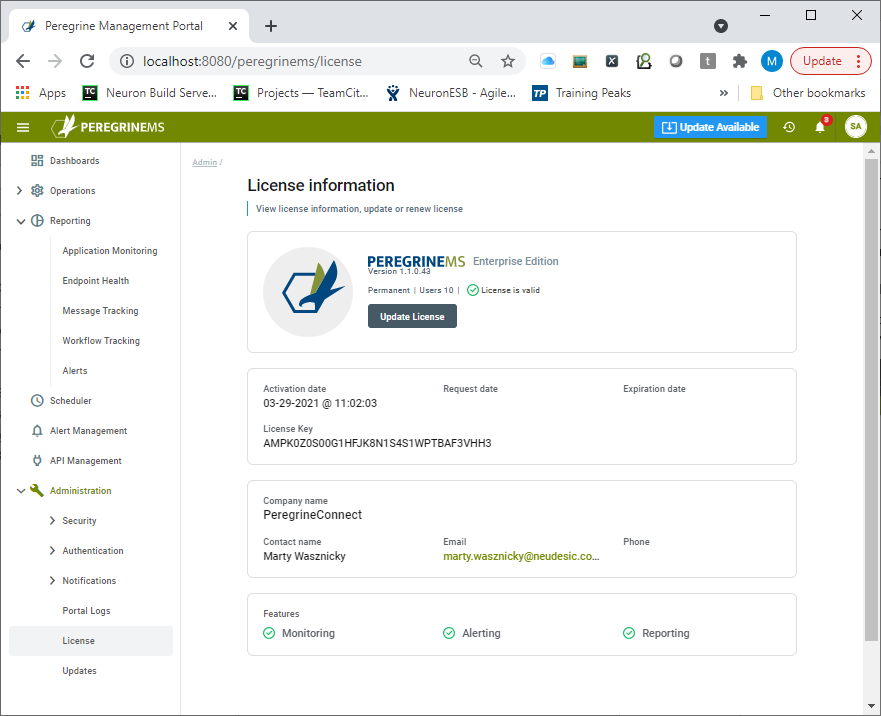
Licensing
Peregrine Connect Management Suite license allows organizations to deploy the Event Processor service and the Management Suite portal on multiple servers for load balancing and high availability purposes. Since the Peregrine Connect Management Suite is dependent on RabbitMQ and Elastic Search, both can be installed using the Peregrine Connect Management Suite installer. Alternatively, organizations may install them directly.
The Peregrine Connect Management Suite license information allows organizations to apply updated license keys for more users and features as required.
Summary
The Peregrine Connect Management Suite provides a powerful set of capabilities that allows organizations to manage and proactively monitor the integration environments deployed within an organization. The Peregrine Connect Management Suite can be deployed on-premise, in the cloud, and supports containerization using Docker or Kubernetes.
The Peregrine Connect Management Suite allows any number of workloads to be simplified, deployed, and monitored; from API Management and automated Workflow to scheduled integration flows.
The Peregrine Connect Management Suite was designed to ensure business continuity while reducing the disruptions that can occur with other integration platforms.
About the Author
Marty has almost 30 years of experience in the software development industry. He joined Peregrine Connect after six years as a Regional Program Manager in the Connected Systems Division at Microsoft. His responsibilities there included building out Microsoft’s BizTalk Server product integration business, managing a team of SOA/ESB/BPM field specialists and building strategic partner alliances. Marty created the Microsoft Virtual Technical Specialist program and owned the development of Microsoft’s Enterprise Service Bus Toolkit.
Read more about Peregrine Connect

-
Rabbit MQ Topics
Introduction Due to the open-source nature of RabbitMQ and constant updates, it is...
-
Port Sharing
One of Neuron ESB’s scalability features is the ability to install multiple...

-
The Integration Journey to...
The Integration Journey to Digital Transformation with Peregrine Connect
-
Saving Time and Money by...
Neuron ESB Application Integration and Web Service Platform: A Real-World Example...

-
Neo PLM
-
Loomis Case Study
Loomis Chooses Peregrine Connect as Their No/Low-Code Integration Platform:...

-

Decision Test Data Mapping
- Use decisions to drive the execution of...
-
Map Testing
Learn how to utilize FlightPath's testing functions...