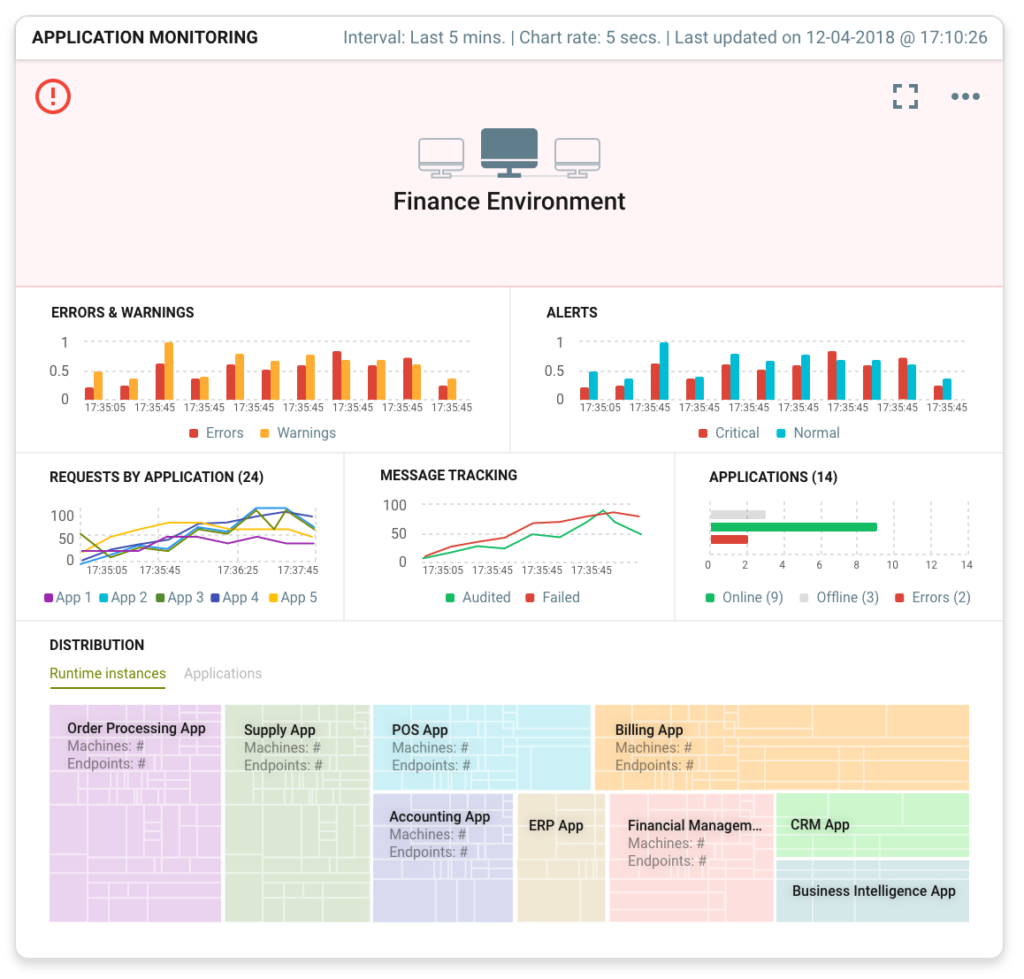
Peregrine Connect, a hybrid integration platform, provides IT professionals with the ability to monitor servers, runtime instances, and applications from a single dashboard.
When an application or workflow is failing, quickly drilling down to the root cause is critical. Peregrine Connect’s Management Suite now allows users to monitor the status of servers, runtime instances, and applications in a single dashboard. Not only can you see the real-time health of every environment in your organization, but you can go back in time to pinpoint the exact moment when things went wrong.
For too long, IT was left in the dark when it came to integration environment monitoring and alerting. Point-to-point integrations, in addition to many traditional ESB tools, do not give any visibility into the success or failure of servers, messages, or applications in a given environment. A lack of visibility results in thousands of dollars of wasted time and effort in maintaining and rebuilding workflows and connections that are broken. Often, the point of failure in a given workflow is undetectable, forcing developers to troubleshoot in the dark, wasting valuable time and resources.
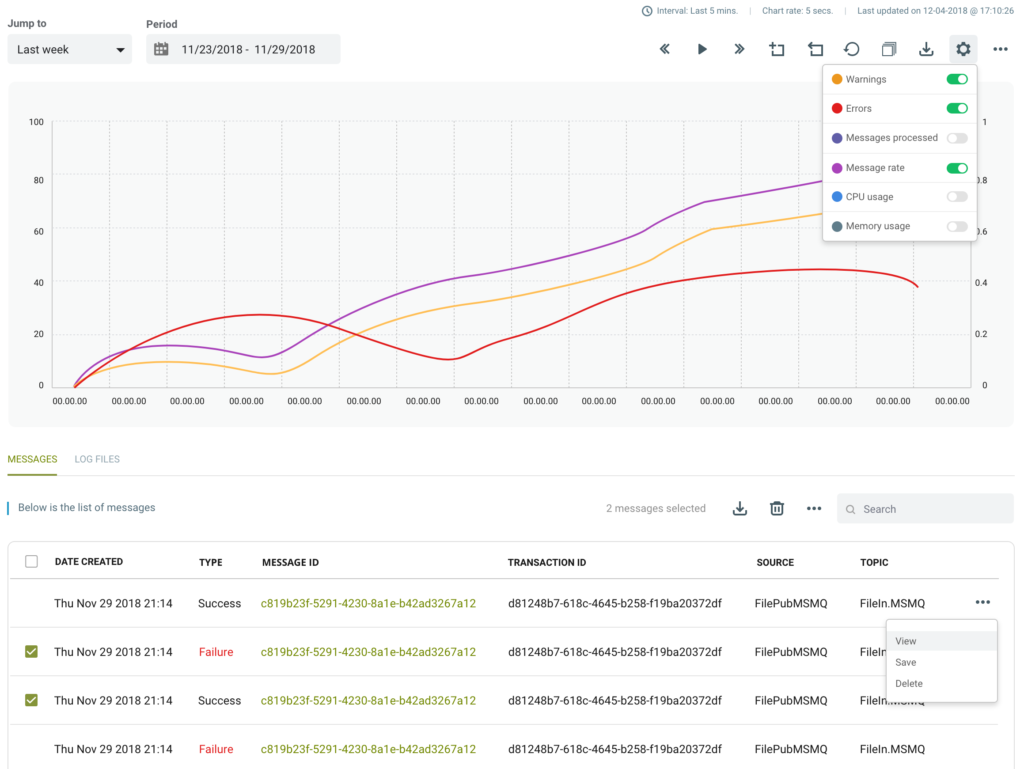
Overlay multiple charts for a selected time window to understand exactly what went wrong.
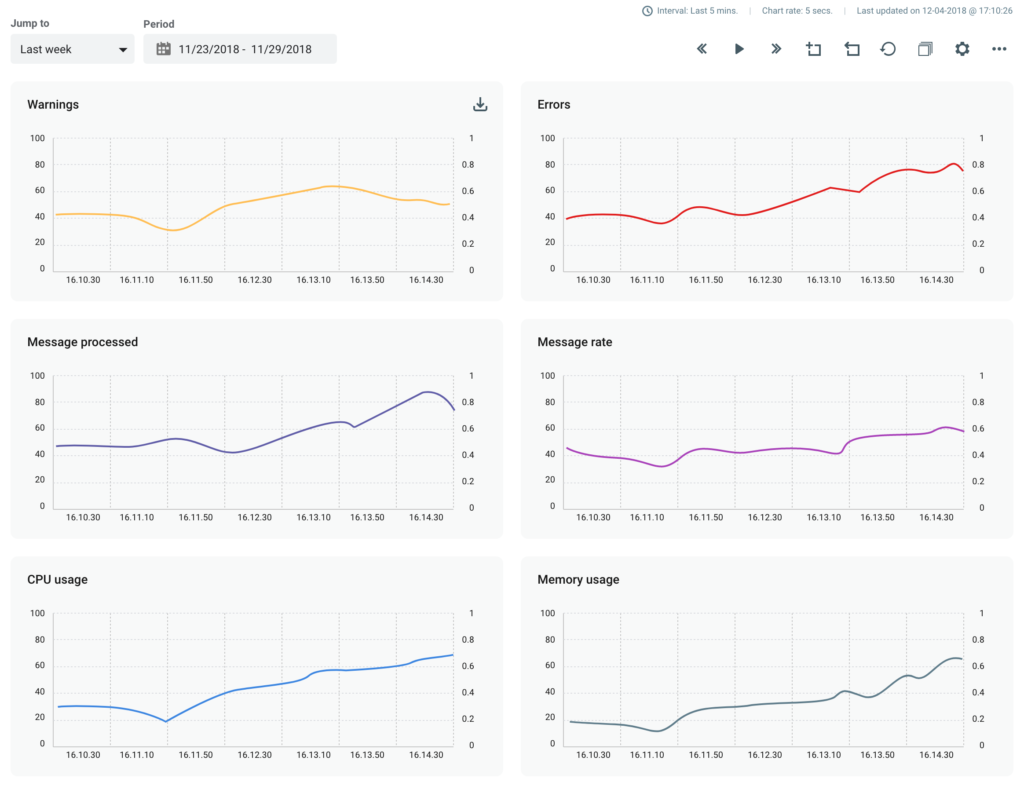
Or drill into each chart individually.
“It’s all about identifying the problem and getting from A to Z as quickly as possible,” said Marty Wasznicky. “We’ve always been about making things simple and easy to use, without sacrificing performance. Anyone can set up and customize operational dashboards and alerts in our Management Suite, regardless of your experience.”
Peregrine Connect’s new monitoring and alerting capabilities will help IT professionals spend as little time and money as possible to keep their resources up and running. Granular visibility and historical data let you drill down into the time of any event and view CPU utilization, heat maps, and more reporting tools to see exactly what’s affecting performance.
Read more about Peregrine Connect

-
Rabbit MQ Topics
Introduction Due to the open-source nature of RabbitMQ and constant updates, it is...
-
Port Sharing
One of Neuron ESB’s scalability features is the ability to install multiple...

-
The Integration Journey to...
The Integration Journey to Digital Transformation with Peregrine Connect
-
Saving Time and Money by...
Neuron ESB Application Integration and Web Service Platform: A Real-World Example...

-
Neo PLM
-
Loomis Case Study
Loomis Chooses Peregrine Connect as Their No/Low-Code Integration Platform:...

-

Decision Test Data Mapping
- Use decisions to drive the execution of...
-
Map Testing
Learn how to utilize FlightPath's testing functions...